Báo cáo lâm nghiệp: "The effects of thinning on the structural diversity of coppice forests" doc
Bạn đang xem bản rút gọn của tài liệu. Xem và tải ngay bản đầy đủ của tài liệu tại đây (523.61 KB, 9 trang )
771
Ann. For. Sci. 61 (2004) 771–779
© INRA, EDP Sciences, 2005
DOI: 10.1051/forest:2004074
Original article
The effects of thinning on the structural diversity of coppice forests
Fernando MONTES*, Isabel CAÑELLAS, Miren DEL RÍO, Rafael CALAMA, Gregorio MONTERO
Center for Forest Research-INIA, Ctra. A Coruña km 7,5, 28040 Madrid, Spain
(Received 14 August 2002; accepted 26 February 2004)
Abstract – Coppices are currently at a turning point: traditional uses have been abandoned and silviculture must be redefined according to new
uses. Thinning to improve the development of trees is often the silvicultural treatment chosen. This paper attempts to assess the changes in forest
structural diversity induced by different thinning regimes applied in coppice stands of Quercus pyrenaica and Quercus faginea. Structural
diversity is analysed through spatial pattern, crown dimensions, vertical and horizontal differentiation and foliage height diversity. Moderate
and heavy thinning have similar effects on stand structure, but the effects of light thinning are quite different for both species. The spatial pattern
shows a greater regularity as the intensity of the thinning regime increases. The response of Q. pyrenaica to thinning is noticeable both in tree
height and crown diameter, whilst in the case of Q. faginea, trees reacted to thinning by developing epicormic sprouts on the stem from the base
of the crown. Vertical differentiation shows opposite trends in both species: increasing the intensity of thinning leads to an increase in vertical
differentiation with Q. pyrenaica, but to a greater homogenisation shortly after thinning with Q. faginea. A neighbourhood analysis using
Gadow’s differentiation index is able to provide useful information on the changes in microstructure, while foliage height diversity index can
be used to describe complex changes in the vertical structure of the stand.
coppice / Quercus pyrenaica / Quercus faginea / structural diversity / thinning
Résumé – L’effet des éclaircies sur la diversité structurale des taillis. Aujourd’hui, les taillis se trouvent à une phase de changement : on a
renoncé à leur usage traditionnel, et alors la sylviculture est obligée de les redéfinir selon les nouveaux usage qu’on propose. Le recours aux
éclaircies pour améliorer le croissance des arbres est le traitement de préférence. Ce travail a pour but l’identification des changements qui se
sont produits dans la diversité structurale du peuplement, et qui ont été induits par l’application des divers types d’éclaircies sur les taillis de
Quercus pyrenaica y Quercus faginea. La diversité structurale est étudiée avec l’analyse du modèle de répartition des tiges, de la taille des cimes,
de la différenciation tant horizontale que verticale et des variations de hauteur du feuillage. Les éclaircies moyennes et fortes ont à peu près le
même effet sur la structure du peuplement, mais l’effet des éclaircies plus légères est bien différent dans les deux espèces. Le modèle spatial
montre une plus grande régularité au fur et à mesure que l’intensité de l’éclaircie augmente. La réponse de Quercus pyrenaica à l’éclaircie est
bien évidente tant en ce qui concerne la croissance en hauteur que le diamètre de la cime. Mais pour Quercus faginea, les arbres vont réagir
d’une autre façon, avec l’émission de bourgeons adventifs dès la partie inférieure de la couronne. La différenciation verticale va montrer deux
tendances différentes pour les deux espèces : augmenter l’intensité des éclaircies va conduire à une augmentation de la différenciation verticale
pour Quercus pyrenaica, tandis que pour Quercus faginea il y aura une plus grande homogénéisation peu après l’éclaircie. Une analyse du
voisinage avec l’indice de différenciation de Gadow permettra d’obtenir des informations très utiles sur les changements de la microstructure,
tandis que l’indice de hauteur du feuillage peut être employé pour décrire des changements complexes sur la structure verticale du peuplement.
taillis / Quercus pyrenaica / Quercus faginea / diversité structurale / éclaircie
1. INTRODUCTION
The structural attributes of forest stands are increasingly rec-
ognised as being of theoretical and practical importance in the
understanding and management of forest ecosystems because
structure is the attribute most often manipulated to achieve man-
agement objectives following the establishment of a forest stand
[10]. Moreover, structure is a readily measured surrogate for
functions or for organisms that are difficult to measure directly.
On the other hand, stand structure has also a value in itself, as
a product (e.g. wood) or in providing a service (e.g. landscape).
Methods applied in assessing different types of diversity are
as manifold as the ways of calculating measures of diversity.
Furthermore, any diversity determination is relative to the con-
ditions of the area concerned. Considering the growing condi-
tions of central and southern Europe, structural diversity gains
a comparatively higher importance, because of the low diversity
of tree species, especially in mountain forests. Also, in order
to characterize stand structure, several methods have been
applied, based on the spatial distribution of trees (horizontal
and vertical) or on other long-used indicators such as diameter
distributions.
* Corresponding author:
772 F. Montes et al.
Although there are many studies which focus on the meth-
odology to characterize stand structure [11, 12, 14, 18, 22, 24],
only few studies compare different indices of stand structure
in Mediterranean forests.
Coppice forests cover more than 2 400 000 ha in Spain.
Quercus faginea Lamk. and Q. pyrenaica Willd. stands repre-
sent the majority of Mediterranean coppice forests in this country.
Their traditional uses were for firewood, charcoal production
and grazing. Since the middle of the last century, the use of fire-
wood and charcoal as energy resources has reduced signifi-
cantly and the lack of sustainable silvicultural treatments and
thinnings has lead to dense coppice forests. In such conditions
the growth of saplings is low and shoots often wither during
the dry season. Due to the existence of these problems in exten-
sive areas and to the increasing interest in the implementation
of direct and indirect production uses for these stands (silvo-
pastoral uses, recreation, environmental preservation), there is
an urgent need to study and manage these coppice stands. In
most cases, thinning is the treatment carried out because it con-
centrates growth on standing trees and should result in open
woodlands where cattle grazing is the main use. In the long
term, openings improve crown development and acorn produc-
tion and can help seedlings to establish [20].
The response of the remaining trees to thinning depends on
species characteristics such as crown and root expansion rates,
tree age, site characteristics and the amount of growing space
released [23]. Barbour [4] suggested that thinning could accel-
erate the development of some features of stand structure found
in late seral stage forests. The effects of thinning on yield, diam-
eter distribution, height and diameter growth have been widely
studied for coppices [5, 6, 9, 17]. However, although studies
have been carried out recently on Q. ilex [13] and Q. pubescens
[15], changes in stand structure are not as well documented.
Moreover, assessing the effect of thinning on structural diver-
sity is very important in these Mediterranean ecosystems where
structure is directly related to basic aspects of forest manage-
ment such as fire risk or the presence of livestock.
The aim of this study was to analyse the effect of thinning
on the structure of Q. faginea and Q. pyrenaica coppice stands
and to evaluate the response in some crown features of these
species to the size of openings.
2. MATERIALS AND METHODS
2.1. Study site
More than 20 years ago, CIFOR-INIA has installed permanent thin-
ning trials in a selection of Spanish coppices comprising Mediterra-
nean species. In this study, the experimental trials carried out with
Quercus pyrenaica and Quercus faginea are analysed.
The plots chosen for Q. pyrenaica are situated in Navacerrada, in
the Sierra de Guadarrama (Central Range of Spain), 40º 43’ 54” N
and 4º 0’ 16” W. The stand is located on a north-west facing 20% slope
at an altitude of 1 250 m. The parent material is granitic and covered
with a shallow, permeable soil. Mean annual rainfall is 678 mm and
the mean temperature is 9.9 ºC. The stand was two storied, the upper
storey being about 40 years old and the lower about 20. The plots,
40 × 40 m in dimension, were low-thinned in 1979 with three different
intensities (Tab. I). Each intensity is considered as a treatment effect.
The experiment involved three random plots per treatment. Plots
were inventoried every five years, three times from 1980 to 1990.
The plots selected for Q. faginea are situated in Brihuega, Guada-
lajara, in the foothills of the Iberian range (40º 48’ 18” N and
2º 45’ 16” O), on a 20% North-west facing slope at an altitude of
850 m. Mean annual rainfall is 570 mm and the mean temperature is
12.3 ºC. Soils are formed from calcareous rock, with a high clay con-
tent and low permeability.
Plots are 40 × 40 m. Low-thinning was carried out with similar
intensity levels to those in the Q. pyrenaica trial (Tab. II). In the light
thinned plots one stem per stool was left, whereas in moderate and
heavy thinned plots some stools were completely removed. In this
case, the experiment involved two plots per treatment, and inventories
were also taken every five years from 1980 to 1990.
All the saplings were mapped in each plot. Diameter at breast height
(dbh), total height (ht), crown diameter (dc) and crown length (lc) of
all saplings within the plots were recorded in all the inventories.
2.2. Methods
2.2.1. Stand structure characterisation
Stand structure was characterised for each plot and inventory. In
order to characterize the structure, the following aspects were taken
into account:
(i) Spatial pattern
– Ripley’s K function
The spatial pattern was analysed using the Ripley’s function K(d)
[26]. K(d) was calculated from the equation:
(1)
where λ is the density of stems per unit area, d
ij
the distance from tree i
to tree j, and n the number of trees in a circular area of radius d. The
K value is compared to the expected value of a Poisson distribution
obtained through 99 simulations of the Poisson process [25]. Discard-
ing the 2.5% higher and lower values of the 99 simulations we can
establish also a 95% confidence bounds. Values of K above the upper
bound curve indicates there are more trees up to a distance d distant
Table I. Average number of stems per ha, basal area, mean diameter
at breast height (Dbh) and mean height for the 3 thinning intensities
carried out in Q. pyrenaica plots.
Thinning intensity Stems/ha Basal area
(m
2
/ha)
Dbh (cm) Height (m)
Light thinning 2025 9.46 6.84 4.80
Moderate thinning 1000 6.57 8.11 5.50
Heavy thinning 721 4.95 8.35 5.57
Table II. Average number of stems per ha, basal area, mean diameter
at breast height (Dbh) and mean height for the 3 thinning intensities
carried out in Q. faginea plots.
Thinning intensity Stems/ha Basal area
(m
2
/ha)
Dbh
(cm)
Height
(m)
Light thinning 1788 5.53 6.18 4.67
Moderate thinning 1025 4.36 7.18 5.41
Heavy thinning 750 2.92 6.85 5.38
λKd()
δ
ij
d()
n
j 1=
n
∑
i 1=
n
∑
,
ij,≠= δ
ij
d()
1 if d
ij
d≤
0 if d
ij
d>
Thinning effects on the structure of coppices 773
those expected under random distribution, so the spatial pattern is clus-
ter. The transformation proposed by Besag in the discussion of
Ripley paper [25] was used. This transformation linearizes and stabi-
lizes the variance of the K function:
.(2)
– Gadow’s uniform angle index (I
G
).
The spatial pattern was also analysed using Gadow’s uniform angle
index [12]:
(3)
where n is the number of neighbours considered (in this case n =3),
w
ij
is the angle formed by the two lines issued from a reference tree
and going through i and j neighbours and w is the ratio of 360º to n.
If stems were very uniformly distributed, w
ij
should be more wide than
under clumped distribution, so I
Gi
= 1 indicates that the trees in the
neighbourhood of the reference tree are clumped, I
Gi
= 0 indicates a
regular distribution of trees [1].
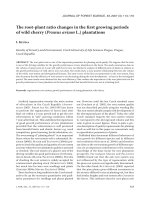
(ii) Canopy features
To characterize the canopy stratum of the plots, the following single
tree variables were computed (see Fig. 1):
– Total height of all the stems in the plot (h
t
).
– Crown diameter of all stems in the plot (d
c
), calculated averaging
two perpendicular measures of the crown width, using fixed directions
for all the trees.
– Crown length of all stems in the plot (l
c
), calculated as the dif-
ference of the total height to the height of the lower alive branch.
– The crown ratio calculated for each stem (cr) as the ratio between
crown length and total height.
(iii) Vertical and horizontal size differentiation was analysed in
each plot using Gadow’s differentiation index [12]:
(4)
with
(5)
where TDn is the mean differentiation calculated with n neighbours,
N the number of trees analysed per plot, TDn
i
the differentiation index
for tree i calculated with n neighbours, x
min
and x
max
are the smallest
and the largest diameters (horizontal differentiation) or heights (ver-
tical differentiation) among tree i and its n neighbours. As the usual
practice is to take into consideration the three nearest neighbours [11],
n was set to 3 in the calculations. The differentiation index gives a
quantification of the variation at microstructure level (the neighbour-
hood of a tree), where many ecological processes take place. TDn
ranges from 0 to 1. Values close to 0 indicate that the neighbours are
very similar sized to the reference tree, whereas values close to 1 indi-
cate high differentiation.
(iv) Foliage height diversity (FHD) [16] was estimated for each plot
using the Shannon index to characterize the distribution of the tree
crowns in vertical strata:
(6)
where p
i
is the relative abundance of foliage in strata i. To estimate
the relative abundance of foliage, the crown of trees was considered
as an ellipsoid of revolution (Eq. (7)), being the generatrix an ellipse
with the z axis equal to crown length and the x axis equal to crown
diameter (Fig. 1).
(7)
where d
c
is the crown diameter, l
c
is the crown length and h
t
is the total
height of the tree.
Making z ≡ h and
(8)
the ellipsoid volume for a given tree was calculated within each height
strata i through the following integral:
(9)
where V
i
is the crown volume of the tree in the strata i (from height
h
i1
to h
i2
). Four strata were defined: the lower strata ranged from
ground to h = 0.7 m, the second strata from 0.7 to 2 m, the third from
2 to 5 m and the upper strata above h = 5 m. The relative abundance
of foliage in strata i (p
i
) has been approximated as:
(10)
where N is the number of trees within the plot. The more equally the
crowns are distributed among the four strata, the higher is the FHD value.
A graphical analysis was performed to evaluate the trend of the ana-
lysed variables (h
t
, d
c
, cr, TDd3, TDh3 and FHD, being TDd3 and
TDh3 respectively horizontal and vertical differentiation indices with
n = 3) through the inventories.
2.2.2. Statistical methods
Since three inventories were carried out at each plot, the effect of
thinning intensity was evaluated using a repeated measurements analysis
of variance (RMANOVA) following the SAS procedure GLM [21,
27]. Tested variables were both single tree (canopy features) and plot
variables (differentiation and diversity indices). The general expres-
sion for a single factor RMANOVA is:
(11)
where Y
ijk
is the observed value for the response variable Y on the i
th
sample (tree or plot) under treatment j taken during the k
th
inventory;
is the overall mean value for the response variable Y; T is the treat-
ment effect, in this case, thinning intensity; is the time (inventory)
effect; is the time × treatment interaction effect and ε
ijk
∼N(0,σ)
indicates the random error terms, with variance-covariance matrix σ.
Mauchly’s criterion test for the compound symmetry of the variance-
covariance matrix was carried out for all the analysed variables.
L
ˆ
d()
L
ˆ
d()
K
ˆ
d()
π
d–=
I
Gi
1
n
· z
ij
j 1=
n
∑
= z
ij
1 if w
ij
w≤
0 if w
ij
w>
Figure 1. Single tree variables use to characterize the canopy stra-
tum; ht: total height, dc: crown diameter and lc: crown lenght. To
estimate the relative abundance of foliage in each stratum for the
FHD calculation, the crown of the trees was considered as an ellip-
soid of revolution with z axis as revolution axis.
TDn
1
N
TDn
i
i 1=
N
∑
=
TDn
i
1
n
1
x
min
x
max
–
j
j 1=
n
∑
=
FHD p
i
· p
i
()ln
∑
–=
x
2
y
2
+
d
c
/ 2()
2
zh
t
l
c
/ 2–()–
l
c
/ 2
2
+ 1=
r
2
x
2
y
2
+ d
c
/ 2()
2
d
c
/ 2()
2
· hh
t
l
c
/ 2–()–[]
2
l
c
/ 2()
2
–==
V
i
π
h
i1
h
i2
∫
· r
2
dh=
p
i
V
ji
j 1=
N
∑
/
V
ji
j 1=
N
∑
i 1=
4
∑
=
Y
ijk
µ T
j
γ
k
T ·
γ
jk
ε
ijk
+++ +=
µ
γ
T
γ
×
774 F. Montes et al.
Hypothesis of sphericity was only accepted for the Gadow’s differen-
tiation index applied to diameter and height and for FHD. In order to
evaluate treatment effect between samples, a null-hypothesis test was
used since it does not require a sphericity condition. As the sphericity
hypothesis for the variance-covariance matrix was not accepted for all
variables, a multivariate approach was followed using Roy’s greatest
root test to assess the significance of time and time × treatment effect
[21, 27].
The existence of significant differences between treatments within
the same inventory was evaluated following a univariate ANOVA.
Tukey’s test of multiple range was used to analyse the differences
among treatments (95% significance level).
3. RESULTS
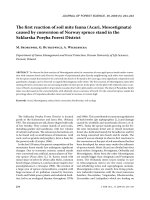
3.1. Spatial pattern
The spatial patterns of trees studied through the transformation
of Ripley’s K function are presented in Figures 2 and 3.
Light lines indicate 90% confidence interval boundaries for the
function of a Poisson distribution. When the func-
tion for the real distribution of trees (bold line) falls above the
upper boundary confidence interval, this denotes a clustered
distribution; if it falls under the lower boundary, the distribution
is regular.
The analysis through Ripley’s function K(d) shows that the
heavier the thinning, the longer is the range of regular pattern
for both species. Clustered distribution was found in lightly
thinned plots above a distance of 3 to 10 m in the case of
Q. pyrenaica (Fig. 2). This trend is steeper in plot 1a, which has
also the highest density (2.462 stems/ha). Plot 1f (moderately
thinned) shows also a clustered pattern.
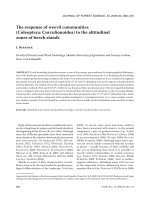
Clustered distribution above 7 m was only found in one of
the lightly thinned Q. faginea plots (Fig. 3b) and a cluster pat-
tern was found again in one of the heavily thinned plots above
a distance of 10 m (Fig. 3e).L
ˆ
d()
L
ˆ
d() L
ˆ
d()
Figure 2. Analysis of the spatial pattern of trees in Q. pyrenaica plots (a, b and c: light thinning; d, e and f: moderate thinning; g, h and i: heavy
thinning; 3 plots for each thinning treatment) using the transformation L(d) of Ripley’s function K(d). Solid lines: K function value for the real
distribution of trees; grey lines: 90% confidence interval boundaries of L(d) for a Poisson distribution.
Thinning effects on the structure of coppices 775
Gadow’s uniform angle index shows a random pattern in all
plots, with a mean value of 0.59 for Q. pyrenaica and a mean
value of 0.60 for Q. faginea (Tab. III).
3.2. Canopy features
The repeated measurements analysis of variance shows that
significant differences exist between the three thinning inten-
sities for all studied canopy variables in both trials. Time effect
and time × treatment interaction are also significant for all var-
iables (Tab. IV). Height and height increment, crown length
and increment, as well as crown diameter and its increment tend
to be lower for both species as thinning intensity decreases
(Fig. 4). However, differences between treatments are not sta-
tistically significant in all inventories (Tab. V).
In the Q. pyrenaica trial, the first inventory suggests that
light thinning produces a significantly lower value for height,
crown length and crown diameter than moderate or heavy thin-
ning. The differences between the treatments increase over
time (Tab. V). The relationship between thinning intensity and
crown ratio shows a similar trend although significant differ-
ences disappear for the last inventory.
In the first inventory, just after thinning, results in the Q.
faginea trial are not so clear. Crown ratio and crown diameter
return significantly higher values for light thinning (Fig. 4).
However, the differences among treatments increase over time,
with values increasing with the intensity of thinnings (Tab. V).
The greatest difference between the two species regarding
canopy behaviour, is that just after thinning Q. faginea devel-
ops epicormic shoots, leading to a very step increase of crown
ratio. However, in the Q. pyrenaica trial the crown ratio shows
a low increment just after thinning, although it increases mod-
erately in the second interval.
3.3. Vertical and horizontal size differentiation
For Q. pyrenaica, no significant differences between thin-
ning intensities were found in TDh3, but a time × treatment sig-
nificant effect was noted (for Roy’s greatest root Pr < F =
0.0047) (Tab. IV). Time and time × treatment effects are highly
significant for TDd3, furthermore treatment effect is also sig-
nificant at 0.05 level for this variable. In the first inventory, the
values for horizontal and vertical differentiation were lower
after light thinning than after moderate or heavy thinnings
(Fig. 5). Nevertheless, the lightly thinned plots show a trend
towards rising differentiation while in the case of moderately
and heavily thinned plots the differentiation tends to decrease
with time. In the third inventory, most of the heavily thinned
plots show lower vertical differentiation values than the others.
Table III. Mean value for each thinning intensity of Gadow’s uniform
angle index. Values from 0 to 0.33 indicate a regular pattern, from
0.33 to 0.66 a random pattern and above 0.66 an irregular pattern.
Thinning intensity Q. pyrenaica Q. faginea
Light 0.60 0.63
Moderate 0.60 0.59
Heavy 0.58 0.57
Figure 3. Analysis of the spatial pattern of trees in Q. faginea plots (a and b: light thinning; c and d: moderate thinning; e and f: heavy thinning;
2 plots for each treatment) using the transformation L(d) of Ripley’s function K(d). Solid lines: K function value for the real distribution of the
trees; grey lines: 90% confidence interval boundaries of L(d) of a Poisson distribution.
776 F. Montes et al.
Significant differences were found with Q. faginea for TDh3
at 0.05 level depending on which thinning regime was applied
(Tab. V). However, this was not the case for TDd3. Plots where
light thinning was carried out have higher horizontal and ver-
tical differentiation, while heavily thinned plots return the lowest
values (Fig. 5). Furthermore, in the first five years after thin-
ning, vertical differentiation increases in all plots, whereas the
opposite occurs with horizontal differentiation, which shows a
decreasing trend for 10 years after treatment. (Fig. 5). Never-
theless, the variations over time are lower than for Q. pyrenaica.
Table IV. Tests of hypotheses for treatment (tr), time and time × treatment effects in Repeated Measures Analysis of Variance. Pr < F indicates
the level of significance for the null hypothesis of no difference between effects. TDh3 and TDd3 are Gadow’s differentiation index calculated
using three neighbours for height and diameter respectively. FHD is the foliage height diversity index.
Va ria ble Q. pyrenaica Pr < F Q. faginea Pr < F
tr time time × tr tr time time × tr
Tree – level variables Height < 0.0001 < 0.0001 < 0.0001 < 0.0001 < 0.0001 < 0.0001
Crown length < 0.0001 < 0.0001 < 0.0001 < 0.0001 < 0.0001 < 0.0001
Crown ratio < 0.0001 < 0.0001 < 0.0001 0.0006 < 0.0001 < 0.0001
Crown diameter < 0.0001 < 0.0001 < 0.0001 < 0.0001 < 0.0001 < 0.0001
Plot – level variables TDh3 0.2448 0.0262 0.0047 0.0238 0.1408 0.2104
TDd3 0.0393 0.0002 0.0037 0.1285 0.0378 0.0221
FHD 0.4288 0.0500 0.4477 0.0498 0.0036 0.0514
Figure 4. Evolution of height (m), crown length (m), crown ratio and
crown diameter (m) with time (years after thinning) for Q. pyrenaica
plots (above) and for Q. faginea plots (below).
Figure 5. Evolution of Gadow’s differentiation index calculated
using three neighbours for height (TDh3) and diameter (TDd3) in Q.
pyrenaica plots (above) and in Q. faginea plots (below). Different
plots have been represented by different lines to show same treatment
variability.
Thinning effects on the structure of coppices 777
3.4. FHD
The thinning regime used for Q. pyrenaica had no significant
effect on FHD (Tab. IV). The rate of increase in FHD is slightly
higher for the second period. The highest FHD values in all the
inventories corresponds to lightly thinned plots (Fig. 6).
For Q. faginea the effect of treatment is significant at 0.05 level
(Tab. IV). The plots where moderate thinning was carried out
return the highest FHD values just after thinning (Fig. 6). The FHD
values rises up after thinning but tend to decrease in the second
period. This trend is steeper for heavy thinning. The lightly
thinned plots have the lowest FHD values in the third inventory.
4. DISCUSSION AND CONCLUDING REMARKS
In both trials, a similar response to thinning was found for height
and diameter growth [5]. Both trials are situated on low quality
sites, so growth response is smaller than that obtained in other
thinning trials with the same [6], or different species [13, 17].
Lower values for height growth is common in coppices
located on poor sites, as the locality of the Q. faginea plots,
where there is a stagnation of height growth.
Although it was expected that the range of regular pattern
in short distances would increase with thinning intensity, a clus-
tered pattern at distances around 10 m in lightly thinned plots
was unexpected. This clustered pattern could be due to the var-
iability of site conditions or to factors related to regeneration
processes, such as capability to root sprouting and to colonise
small gaps. The spatial pattern did not change over the three
inventories because of the low mortality rate. Gadow’s uniform
angle index did not reveal any differences between treatments
because the main differences are related to the scale of the pat-
tern. In fact, very similar results were found for the uniform
angle index in Scots pine forests with a much lower density [19].
As can be observed in Figure 4, the response of the crown
to thinning is different in each of the studied species. Thinning
Table V. Significant differences at 0.001 level between treatments for each inventory time (time 1: just after thinning; time 2: 5 years after thin-
ning; time 3: 10 years after thinning) evaluated through a univariate ANOVA.
Q. pyrenaica Q. faginea
Variable Treatment Time 1 Time 2 Time 3 Time 1 Time 2 Time 3
Tree – level variables Height Light
Moderate
Heavy
a
b
b
a
b
b
a
b
c
a
b
b
a
b
b
a
b
b
Crown length Light
Moderate
Heavy
a
b
b
a
b
b
a
b
c
a
c
b
a
b
b
a
b
b
Crown ratio Light
Moderate
Heavy
a
a
b
a
b
b
a
a
a
b
b
a
a
b
a
a
b
c
Crown diameter Light
Moderate
Heavy
a
b
b
a
b
b
a
b
c
b
a
a
a
b
b
a
b
c
Plot – level variables TDh3Light
Moderate
Heavy
a
b
c
a
a
a
a
a
a
a
a
a
a
ab
b
a
a
a
TDd3Light
Moderate
Heavy
a
b
b
a
a
a
a
a
a
a
a
a
a
a
a
a
a
a
FHD Light
Moderate
Heavy
a
a
a
a
a
a
a
a
a
a
a
a
a
a
a
a
ab
b
Treatments with the same letter indicate non significant differences for the studied variable in the period.
Figure 6. Evolution of foliage height diversity (FHD) calculated
through Shannon index with four vertical strata (lower strata compri-
ses from ground to 0.7 m height, second from 0.7 to 2 m, third from
2 to 5 m and upper strata above 5 m height) for Q. pyrenaica plots
(left) and for Q. faginea plots (right).
778 F. Montes et al.
increases the illumination on the stems and in the case of Q.
faginea this produces an intense sprouting from the stem,
instead of the reoccupation of openings through the horizontal
expansion of the crown in other species. The development of
sprouts is a characteristic of coppices, but different species
behave in different ways, in fact for holm oak the effect of
cleaning and thinning is similar to Q. faginea [8, 9], whereas
Q. pyrenaica sprouts mainly from the root. By studying canopy
characteristics, using vertical and horizontal size differentia-
tion indices, the response of the stand structure to thinning can
be determined.
Although the changes in horizontal structure brought about
by different thinning intensities are very similar in both trials,
the response of vertical structure to thinning seems to be very
different. Low thinning usually leads to a more homogeneous
stand [2, 3], but in the case of Q. pyrenaica, height differenti-
ation just after thinning increases with the thinning intensity
(Fig. 5). This means that there is a greater homogeneity
between neighbour stems (microstructure) in light thinned
plots, where the lower storey predominate over the upper sto-
rey, being the microstructure of moderate and heavy thinned
plots more heterogeneous. This neighbourhood differentiation
after moderate and heavy thinning gradually decreases with
time, showing two of the heavy thinned plots the lowest TDh
value ten years after the thinning. In another study carried out
in a one storied stand of Q. pyrenaica, diameter growth
appeared positively correlated with diameter [6], which may
indicate that big trees has advantage when filling out space after
thinning. However, in our study, Gadow’s differentiation index
reveals the opposite tendency, i.e. the lower storey trees gets
as high as the upper storey neighbours. This difference may be
due to the age difference between the two storeys or to a height
growth stagnation caused by limiting ecological conditions. It
may be that neighbourhood analysis through Gadow’s differ-
entiation index allows us to obtain information about structural
changes that are not revealed by other methods of analysis.
Nevertheless, there was a steadily increase in microstructure
differentiation in the lightly thinned plots after thinning,
whereas the opposite trend was found with the more intensive
thinning, leading to a decrease of differences between thinning
regimes with time.
In the case of Q. faginea the differentiation is lower just after
moderate and heavy thinnings, which means that the variation
is greater at microstructure than between more distant stems.
Following thinning, height differentiation increases, perhaps
because growth is concentrated on the upper strata. Gracia and
Retana [13] found that in holm oak coppices the diameter dis-
tribution becomes more regular with increased site quality.
Therefore, the low quality of the Q. faginea plots could be the
cause of the high differentiation in lightly thinned plots com-
pared to moderately and heavily thinned ones as low thinning
releases mainly small stems.
FHD measures have been widely used to asses habitat qual-
ity of forests and provides information about the occupancy of
the different vertical strata by the vegetation, in contrast to Leaf
Area Index (LAI), which focuses on the quantification of pho-
tosynthetic surface. FHD can be estimated using different vertical
strata, depending on the crop features. Strata must be chosen
according to the characteristics of the stand, reflecting the hab-
itat requirements of the different organisms inhabiting the
stand. MacArthur and MacArthur [16] used three vertical strata
(0–0.7 m, 0.7–7.6 m and more than 7.6 m). Neuman and Starlinger
[22] standardised the Shannon formula dividing it by log(N) (N,
number of strata). Layer boundaries were 0.2 × Hmax,
0.5Hmax and 0.8 × Hmax, (Hmax being the maximum height
on the plot). When studying successional changes in Q. pubes-
cens coppices Debussche [7] found that the following vertical
stratification was suitable for the study: ground level to 0.25 m,
0.25 to 0.5 m, 0.5 to 1 m, 1 to 2 m, 2 to 4 m, 4 to 8 m and more
than 8 m. The most remarkable effect that the thinnings had on
the FHD of the studied stands is the increase noticed in Q. fagi-
nea plots just after thinning (Fig. 6), due, as previously stated,
to the epicornic sprouts that appear on the lower part of the tree.
The results of this study show the importance of including
individual tree features, microstructure and vertical and hori-
zontal stand complexity in the analysis in order to correctly
interpret structural changes and the effect of thinning intensity
on stand structure. These changes are of great importance for
forest management. For the studied species, moderate and
heavy thinning improve the illumination of the crown and the
forest floor vegetation, which may improve grazing produc-
tion. The decrease foliage height diversity for Q. pyrenaica
with these thinning regimes reduce fire risk, but may be unde-
sirable for hunting or wildlife oriented management, because
the animal refuge function of multi-layered stands. For Q. fagi-
nea the moderate and heavy thinning regimes leads to a trunk
sprouting, so fire risk may increase because the vertical conti-
nuity of combustible, although the open canopy reduces the
horizontal continuity.
Acknowledgements: The authors wish to thank to A. Bachiller and
J.L. Montoto for their work in the inventories.
REFERENCES
[1] Aguirre O., Hui G., Gadow K.v., Jiménez J., An analysis of spatial
forest structure using neighbourhood-based variables, For. Ecol.
Manage. (2003) 137–145.
[2] Aguirre O., Kramer H., Jiménez J., Strukturuntersuchungen in
einem Kiefern-Durchforstungsversuch Nordmexikos, Allg. Forst
u. J Ztg. 169 (1998) 213–219.
[3] Albert M., Gadow K.v., Kramer H., Zur Strukturbeschreibung in
Douglasien-Jungbeständen am Beispiel der Versuchsflächen Man-
derscheid und Uslar, Allg. Forst u. J Ztg. 166 (1995) 205–210.
[4] Barbour R.J., Johnston S., Hayes J.P., Tucker G.F., Simulated stand
characteristics and wood product yields from Douglas-fir planta-
tions managed for ecosystem objectives, For. Ecol. Manage. 91
(1997) 205–219.
[5] Cañellas I., Montero G., San Miguel A., Montoto J.L., Bachiller A.,
Transformation of coppice of rebollo (Quercus pyrenaica Willd.)
into open woodlands by thinning at different intensities. Prelimi-
nary results, Invest. Agrar. Sist. Recur. For. Fuera de serie 3 (1994)
71–78.
[6] Cañellas I., del Rio M., Roig S., Montero G., Growth response to
thinning in Quercus pyrenaica Willd. coppice stands in Spanish
Central Mountain, Ann. For. Sci. 61 (2004) 243–250.
[7] Debussche M., Changes in the vegetation of Quercus pubescens
woodland after cessation of coppicing and grazing, J. Veg. Sci. 12
(2001) 81–92.
[8] Ducrey M., Boisserie M., Recru naturel dans des taillis de chêne
vert (Quercus ilex L.) à la suite d’exploitations partielles, Ann. Sci.
For. 49 (1992) 91–109.
Thinning effects on the structure of coppices 779
[9] Ducrey M., Toth J., Effect of cleaning and thinning on height
growth and girth increment in holm oak coppices, Vegetatio 99–
100 (1992) 365–376.
[10] Franklin J.F., Spies T.A., Pelt R.V., Carey A.B., Thornburgh D.A.,
Berg D.R., Lindenmayer D.B., Harmon M.E., Keeton W.S., Shaw
D.C., Bible K., Chen J., Disturbances and structural development of
natural forest ecosystems with silvicultural implications, using
Douglas-fir forests as an example, For. Ecol. Manage. 155 (2002)
399–423.
[11] Füldner K., Zur Strukturbeschreibung in Mischbeständen, Forstar-
chiv 66 (1995) 235–240.
[12] Gadow K.v., Zur Bestandesbeschreibung in der Forsteinrichtung,
Forst und Holz 21 (1993) 601–606.
[13] Gracia M., Retana J., Effect of site quality and thinning manage-
ment on the structure of holm oak forests in northeast Spain, Ann.
Sci. For. 53 (1996) 571–584.
[14] Kuuluvainen T., Penttinen A., Leinonen L., Nygren M., Statistical
opportunities for comparing stand structural heterogeneity in mana-
ged and primeval forests: an example from boreal Spruce forest in
Southern Finland, Silva Fenn. 30 (1996) 315–328.
[15] Logli F., Joffre R., Individual variability as related to stand struc-
ture in a Mediterranean oak coppice, For. Ecol. Manage. 142 (2001)
53–63.
[16] MacArthur R.M., Mac Arthur J.W., On bird species diversity, Eco-
logy 42 (1961) 594–598.
[17] Mayor X., Rodà F., Growth response of holm oak (Quercus ilex L.)
to commercial thinning in the Montseny mountains (NE Spain),
Ann. Sci. For. 50 (1993) 247–256.
[18] Moeur M., Characterizing spatial patterns of trees using stem-map-
ped data, For. Sci. 39 (1993) 756–775.
[19] Montes F., Cañellas I., Río M.d., Montero G., The effects of silvi-
culture on the structure of Scots pine stands in Spain, in: Procee-
dings of Towards the sustainable use of Europe’s forests, Tours,
France, 2003.
[20] Montoya J.M., Usos alternativos y conservación de los rebollares
de Q. pyrenaica Willd., Boletín de la Estación Central de Ecología
12 (1983) 35–42.
[21] Moser E.B., Saxton A.M., Pezeshki S.R., Repeated measures ana-
lysis of variance: application to tree research, Can. J. For. Res. 20
(1990) 524–535.
[22] Neuman M., Starlinger F., The significance of different indices for
stand structure and diversity in forest, For. Ecol. Manage. 145
(2001) 91–106.
[23] Oliver C.D., Larson B.C., Forest stands dynamics, McGraw-Hill,
USA, 1990.
[24] Pielou E.C., Mathematical Ecology, John Wiley & Sons, 1977.
[25] Ripley B.D., Modelling spatial patterns (with discussion), J.R. Stat.
Soc. 2 (1977) 172–212.
[26] Ripley B.D., Spatial statistics, John Wiley & Sons, New York, 1981.
[27] Sas I.I., Sas/Statlm users guide, Release 6.03 edition, Cary, USA,
1988.
To access this journal online:
www.edpsciences.org