Báo cáo lâm nghiệp: "Study of the properties of thirteen tropical wood species to improve the prediction of cutting forces in mode B" pptx
Bạn đang xem bản rút gọn của tài liệu. Xem và tải ngay bản đầy đủ của tài liệu tại đây (679.64 KB, 10 trang )
55
Ann. For. Sci. 61 (2004) 55–64
© INRA, EDP Sciences, 2004
DOI: 10.1051/forest:2003084
Original article
Study of the properties of thirteen tropical wood species
to improve the prediction of cutting forces in mode B.
Florent EYMA
a
*, Pierre-Jean MÉAUSOONE
b
, Patrick MARTIN
c
a
IUT Paul Sabatier, Dépt GMP, University of Toulouse, 1 rue Lautréamont, 65000, Tarbes, France
b
Enstib, University of Nancy, 27 rue du Merle Blanc, 88000, Épinal, France
c
Ensam, 4 rue des Augustin Fresnel, 57000, Metz, France
(Received 13 September 2002; accepted 16 December 2002)
Abstract – The aim of this study is to investigate the influence of the physical and mechanical characteristics on the behaviour of wood during
machining (for cutting process 90-0). In order to work on relatively homogeneous wood species, it was decided to use tropical woods. Different
characteristics were measured: Physical (specific gravity, shrinkage) and Mechanical (hardness, fracture toughness, shearing, compression
parallel to the grain), These characteristics were assessed separately to cutting forces involved during machining. Results obtained showed good
correlations, particularly with very good results for fracture toughness parameters. Then, different formulations, based on statistical analysis,
using all parameters, allowed to define a new material coefficient K
m
to predict the general behaviour of wood during machining and the cutting
forces involved more precisely. It appeared clearly that the study of wood characteristics is a good means to improve knowledge on cutting
condition optimisation, and to predict quality and efficiency of the cutting process.
cutting forces / mechanical characteristics / tropical wood / specific gravity / wood machining
Résumé – Étude des propriétés de 13 essences de bois tropicaux pour améliorer la prédiction des efforts de coupe en mode B. Le but de
ce travail est d’étudier l’effet des caractéristiques physiques et mécaniques du bois sur son comportement durant l’usinage (dans le processus
de coupe 90-0). De façon à travailler avec des essences de bois relativement homogènes, il a été décidé d’utiliser des bois tropicaux. Différentes
caractéristiques ont été mesurées : physiques (infradensité, retraits) et mécaniques (dureté, ténacité, cisaillement et compression parallèle au fil
du bois). Ces caractéristiques furent comparées séparément aux efforts de coupe induits lors de l’usinage. Les résultats obtenus ont montré de
bonnes corrélations, avec notamment de très bons résultats pour les paramètres de ténacité. Puis, on a obtenu plusieurs formulations basées sur
une analyse statistique, et utilisant l’ensemble des paramètres. Ces formulations, par l'intermédiaire d'un nouveau coefficient de matériau K
m
,
ont permis de définir plus précisément le comportement général du bois au cours de l'usinage et les efforts de coupe induits. Il apparaît
clairement que l'étude des caractéristiques du bois est un bon moyen pour améliorer les connaissances concernant l'optimisation des conditions
de coupe, et pour prédire la qualité et l'efficacité du processus de coupe.
efforts de coupe / propriétés mécaniques / bois tropicaux / infradensité / usinage du bois
1. INTRODUCTION
This work deals with the study of the routing cutting process
90-0 [15, 27], i.e. peripheral milling parallel to grain (rotating
cut), very often met in second processing wood industry.
Today, for wood industries, correct control of the cutting proc-
ess and better knowledge of the interaction between tools and
wood have become essential for productive and economical
purposes [9]. However, at present, to estimate cutting forces
during wood machining, a factor remains difficult to take into
consideration: the influence of wood species. Therefore, the
aim of this study is to understand the influence of the internal
structural characteristics and the behaviour of each species dur-
ing the machining operation.
Today, to quickly estimate cutting forces involved, most
methods just use Specific Gravity and Moisture Content to
describe the influence of wood [11]. However, wood anisot-
ropy provides wood species with completely different charac-
teristics. Thus, it is standard to find wood from the same species
with completely different specific gravities. It is also well
known that sometimes, two species with the same specific
gravity need very different cutting forces, or species with com-
pletely different specific gravities need similar cutting forces!
These considerations show that specific gravity and humidity
alone can not fully explain relationships between wood species
and cutting forces. That is the reason why the internal structural
characteristics of each species must be considered [29].
* Corresponding author:
56 F. Eyma et al.
Thus, nowadays, we just use specific gravity to estimate the
influence of wood species, and then, calculate cutting forces
involved. The aim of this work is to find better parameters,
linked to wood internal characteristics to estimate, more pre-
cisely, the relation between cutting forces and wood species
properties.
2. MATERIALS AND METHODS
In a previous study [12] several heterogeneous wood species were
compared for their specific gravity (e.g. Scot pine). The results were
very difficult to explain. Thus, it was difficult to conclude on the real
influence of wood species on cutting forces involved (problem of
cohesion between earlywood and latewood, …). In order to obtain
very homogeneous characteristics for each species, it was decided to
work on tropical wood species. The choice of these woods was made,
with the “CIRAD Forest” in Montpellier (France), on woods present-
ing a large range of specific gravity and very different mechanical
characteristics. Thirteen tropical wood species were used (Tab. I).
Moreover, Beech (“Fagus Sylvatica”) was added to the list because it
is a reference in a lot of studies.
2.1. Physical characteristics measurement
Each species studied was physically characterised. In collabora-
tion with the wood quality department of INRA (Nancy, France) a
microdensitometric analysis of wood samples [31, 33, 36], and a
measurement of specific gravity SG were done:
SG = M
0
/ V
sat
, i.e. anhydrous mass on saturated volume.
Moreover, a measurement of radial, tangential and volumetric
shrinkage was done, as described in the standard NF B 51-006 [1].
For radial and tangential measurements, samples used were 50 mm ×
50 mm × 10 mm respectively in radial, tangential and longitudinal
directions. For volumetric measurement, samples used were 20 mm
cubes. All the results obtained on the 14 different woods were the
average of ten measurements, and are presented in Table II. Moisture
content was fixed at 12% for all tests in order to obtain results close
to standard literature values. Finally, each wood sample used, was
free of defects.
2.2. Mechanical properties measurement
The mechanical characteristics studied because involved in the
routing cutting process, were chosen from many works found in liter-
ature and especially from the studies of Merchant [30] and Franz [15],
explaining the influence of mechanical characteristics on the routing
cutting process. They wrote the mechanical equilibrium in orthogonal
cutting of the force applied on an elementary chip, and tried to predict
chip formation, then, cutting forces involved during machining. Con-
sidering these formulations, previous mechanical tests [11] and other
works [14, 19, 22, 34, 40], we have chosen the following mechanical
characteristics:
– Shearing parallel to the grain;
– Monnin hardness;
– Compression parallel to the grain;
– Fracture toughness mode I.
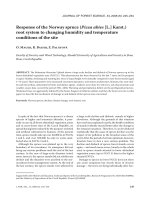
2.2.1. Shearing parallel to the grain measurement
Shearing test parallel to the grain was done following the standard
NF B 51-011 [3]. Sample sizes are 20 mm (T: Tangential), 10 mm (R:
Radial) and 150 mm (L: Longitudinal), and are illustrated on
Figure 1. The device used was a universal testing machine INSTRON
type 4467, with a load cell of 30 KN which allowed a precision of
± 15 N. Different factors were measured (Fig. 2):
– P (N.mm): elasticity (the slope of the curve force/displace-
ment);
– W
c
(J/m
2
): failure energy (the area under the curve before fail-
ure);
Table I. Presentation of the fourteen wood species studied, their specific gravity (SG) and cutting forces involved during their machining (F
c
).
Wood species studied Scientific name SG Fc (N)
Fromager Ceiba pentandra Gaertn. 0.204 21.14
Ayous Triplochiton scleroxylon K.Schum. 0.315 30.52
Virola Virola spp. 0.418 36.70
Niangon Tarrietia densiflora Aubrev. 0.47 46.60
Grignon franc Ocotea rubra Mez. 0.485 28.93
Dodomissinga Parkia nitida Miq. 0.499 41.65
Frake Terminalia superba Engl. Et Diels 0.554 34.59
Beech Fagus sylvatica 0.573 33.19
Bagasse Bagassa guianensis Aubl. 0.689 36.76
Eucalyptus Eucalyptus globulus Labill. 0.705 46.31
Moabi Baillonella toxisperma 0.714 35.09
Wacapou Vouacapoua americana Aubl. 0.755 34.06
Ipé Tabebuia sp. 0.851 44.92
Boco Bocoa prouacensis Aubl. 1.109 55.22
Figure 1. Sample of longitudinal shearing test.
Wood properties to predict cutting forces 57
–
σ
c
(Mpa): failure strain.
(1)
and
(2)
where, S is failure surface (m
2
); F
(t)
is the force carried on with the
displacement “t” (N); dr the failure displacement, and Fr, the force
applied to the failure displacement.
2.2.2. Monnin hardness measurement
This test followed the standard NF B 51-013 [4]. Samples used are
parallelepipeds whose dimensions are 20 mm (T), 20 mm (R) and
60 mm (L). During these tests, a strength of 200daN exerted progres-
sively with a cylinder of 30 mm diameter is applied perpendicular to
the grain direction for 5 seconds. The mark and the displacement
obtained “t” is then, correlated with a value of Monnin hardness “N”.
The factor measured “N” is described as:
(3)
The strength is applied to the tangential-radial sample plane, and
the penetration in done on the radial face. The use of a cylinder for
this test allowed avoiding irregularities of wood growth rings.
2.2.3. Compression parallel to the grain measurement
This test was carried out following standard NF B 51-007 ([2],
conform to the international standard ISO 3787). Sample dimensions
are the same as those used for hardness: 20 mm (T), 20 mm (R) and
60 mm (L). Different parameters were measured (Fig. 3):
– E
c
(Mpa): modulus of elasticity;
(4)
where σ
r
is the failure strain (Mpa), and d
r
is the failure displacement.
–
σ
r
(Mpa): failure strain;
(5)
where F
r
is the failure strength (N), and S the sample section (m
2
).
– W
rupt
(J/m
3
): energy for failure;
(6)
Table II. Presentation of results obtained concerning radial, tangential and volumetric shrinkage.
Wood species Volumetric shrinkage coefficient (%) Total radial shrinkage (%) Total tangential shrinkage (%)
Fromager 0.19 3.65 2.53
Ayous 0.28 4.36 3.46
Virola 0.53 9.84 6.53
Niangon 0.26 6.61 3.82
Grignon franc 0.35 7.03 3.22
Dodomissinga 0.36 7.36 4.33
Frake 0.30 5.19 4.31
Beech 0.46 10.13 5.60
Bagasse 0.47 4.66 3.52
Eucalyptus 0.48 8.99 6.10
Moabi 0.53 7.04 5.20
Wacapou 0.49 6.41 4.51
Ipé 0.59 5.01 5.07
Boco 0.54 7.02 6.11
W
c
1
S
Ft() · dt
0
dr
∫
×=
σ
c
F
r
S
=
Figure 2. Factors used to describe shearing test.
N
1
t
=
.
Figure 3. Factors used to describe compression test parallel to the
grain direction.
E
c
σ
r
dr
=
σ
r
F
r
S
=
W
rupt
1
V
Ft() · dt
0
dr
∫
×=
58 F. Eyma et al.
where V is the sample volume (m
3
); F(t) is the force carried on the
displacement “t” (N), and d
t
is the displacement.
2.2.4. Fracture toughness measurement
Generally, the crack propagation in the wood cutting process
influences either the quality of the chip in veneer cutting, or the qual-
ity of the residual surface in other cases. The theory of fracture
mechanics [6, 18, 25, 39, 41, 42] uses three cracking modes to define
stress distribution in the chip, and crack propagation (Fig. 4): mode I
(i.e. open crack), mode II (i.e. longitudinal shear crack) and mode III
(i.e. transversal shear crack).
The test realised here, concerns mode I, and the notch plane is TL
(Fig. 5): the first letter is the normal crack plane, and the second letter
is the crack propagation direction. The process used is currently sub-
jected to a European standard project [39]. Samples used are SEND
type (Single Edge Notched specimen in Bending), and their dimen-
sions are defined by Gustafsson [18] and illustrated on the Figure 5.
These samples are composed of three parts:
– Central part: which is the wood sample to be tested;
– Two lateral arms: their role is to allow a perfect test of 3 points
bending. The wood species used must present high stiffness
and specific gravity. In these tests, a tropical wood was chosen:
the Pao Rosa with a specific gravity close to 1.
These two arms are pasted on the central part with a phenol reor-
cinol formaldehyde glue. A notch of 21 mm long and 1.5 mm large is
obtained on the central part with a bandsaw (Fig. 5). On the test
machine INSTRON, a load cell of 1KN was used, and allowed a pre-
cision of ±1N.
Different properties were computed (Fig. 6):
–G
f,I
(J/m
2
): fracture energy;
(7)
where S is the failure surface (m
2
); d
r
is the failure deflection (m); F(t)
is the force applied to the displacement “t” (N), and mg is the sample
weight (N).
– P
f,I
(Mpa): slope of the curve in the elastic part;
(8)
where S is the length between supports (m); α is the slope of the ori-
gin tangent; b is the sample width (m), and (w-a) is the breaking seg-
ment section (m);
–
σ
r,I
(Mpa): equivalent failure strain;
(9)
where F
r
is the force applied to the failure (N).
2.3. Measure of machining parameters
These tests were run on a CNC router (Computer Numerically
Control) in the peripheral milling parallel to the grain cutting process.
This machining was done by down-milling, in the cutting direction
90-0-I [28], Figure 7. The dimensions of specimens were: 22 mm in
the tangential direction “T”, 42 mm in the radial direction “R” and
135 mm in the longitudinal direction “L”. A groove was made on the
side of specimens in order to do the cutting process only with the side
of the tool’s edge and never with the top. Then, normal and tangential
cutting forces were measured with a piezo-electric dynamo-meter
attached to the router table (Fig. 8), and allowed the calculation of the
resulting cutting force. Each value of total cutting force is an average
of 30 values for each wood species.
Machining parameters were fixed in respect to correct utilisation,
and optimisation of the router [5]:
– N = 9000 tr/min (rotation spindle rate).
– H = 2 mm (depth of cut).
Figure 4. Definition of three cracking modes, in theory of fracture
mechanics: open crack (I), longitudinal shear crack (II), and transver-
sal shear crack (III).
Figure 5. Picture of tenacity sample (dimensions defined by Schatz
[31]).
G
f, I
1
S
Ft() mg+[] · dt
0
dr
∫
×=
Figure 6. Curve forces - displacement obtained during tenacity tests.
P
f, I
α
S
3
4 b× wa–()
3
×
×=
σ
r, I
3 F
r
× S×
2 b× wa–()
2
×
=
Figure 7. Definition of cutting directions: A = cutting direction 90-
90; B = cutting direction 90-0, and C = cutting direction 0-90.
Wood properties to predict cutting forces 59
– Vf = 4 m/min (feed rate).
– b = 0.9 cm (width of cut).
Characteristics of the tool:
– ∅ = 14 mm (tool diameter).
– Straight tool: 1 tooth with one tooltip related; rake angle: 23°;
clearance angle: 15°.
3. RESULTS AND DISCUSSIONS
The aim of this study is to improve the relation that allowed
calculating cutting forces involved during machining, and to
take into account, more precisely, the influence of wood mate-
rial in this relationship.
3.1. Relationship between physical characteristics
and cutting forces
3.1.1. Relations obtained with specific gravity
Results of specific gravity and cutting forces obtained are
presented in Table I. Concerning the relationship between cut-
ting forces and specific gravity, it was obtained by linear cor-
relation as illustrated on Figure 9. It appears that cutting forces
increase with specific gravity. This has been already explained
by several authors [20, 22]; a greater specific gravity essen-
tially means fewer cell cavities and more cell walls in the
wood. Consequently, the force required to move the tool must
also be greater. However, the coefficient of determination
obtained in this case (R
2
= 0.54) is quite low.
In fact, several authors have worked on the influence of
specific gravity: [14, 20, 29] and found a very good linear cor-
relation between specific gravity and force requirements. Nev-
ertheless, for [7, 16, 22, 38], there is a correlation between spe-
cific gravity and power requirement (power being directly
linked to cutting forces), but this factor is not enough to char-
acterise the influence of wood species precisely. There are
always exceptions, and in our case also, there are some ones.
For example, Grignon and Niangon present similar specific
gravity but required completely different cutting forces (47 N
compared to 29 N).
Then, a study of different wood properties was made.
3.1.2. Relationship obtained with shrinkage
Results obtained on the 14 wood species (Tab. II) are very
close to information found in the data base of Cirad forest. The
relationship between shrinkage and cutting forces presents
average correlations. The best relationship was obtained for
radial shrinkage (R
2
= 0.37), and there is no correlation with
tangential shrinkage.
3.2. Relationship between mechanical properties
and cutting forces
3.2.1. Shearing parallel to the grain
Results obtained on shearing are presented in Table III. On
the three parameters measured, best relations were obtained
with the elastic factor “P”, the linear correlation being very
close to results obtained with specific gravity:
F
c
= (0.0045 × P) + 16.071 (10)
R
2
= 0.59; F
c
: total cutting force.
The influences of failure strain (R
2
= 0.44) and cutting
energy (R
2
= 0.18) on cutting forces are not significant (signif-
icance to 1%: 0.44). Compared to results obtained with spe-
cific gravity (R
2
close to 0.54), shearing parameter “P” seems
Figure 8. Sketch of router’s table with its cutting forces measuring
device; where 1 is the cutting tool; 2 is the wood specimen; 3 is
piezo-electric sensors; 4 is amplificators, and 5 is the cutting forces
system of measurement (Dadisp).
Table III. Results obtained during shearing test parallel to the grain
direction, where σ
c
is the failure strain; W
c
is the energy for failure,
and P is the elasticity parameter.
Shearing test σ
c
(Mpa) W
c
(J/m
2
) P (N.mm)
Fromager 1.30 3.970 1577
Ayous 2.48 7.730 2324
Virola 4.64 11.790 4672
Niangon 5.15 16.030 4352
Grignon franc 5.43 17.350 4554
Dodomissinga 6.70 22.470 5226
Frake 5.96 23.070 4636
Beech 7.67 34.260 5029
Bagasse 5.64 16.800 5223
Eucalyptus 6.20 20.730 5126
Moabi 6.48 25.650 4829
Wacapou 7.76 29.050 5889
Ipé 8.26 31.580 5765
Boco 8.78 25.290 7897
Figure 9. Evolution of cutting forces with specific gravity (SG). F
c
=
(27.716 × SG) + 21.036; R
2
= 0.54.
60 F. Eyma et al.
able to explain the relation between wood species and cutting
forces more precisely, and even if the relation is not perfect,
this mechanical factor can explain some exceptions that spe-
cific gravity does not explain. For example, dodomissinga and
frake are wood species with very close specific gravity. How-
ever, frake required lower cutting forces, and also present
lower shearing characteristics.
Concerning the importance of elastic parameters, several
explanations can be given:
– Firstly, from a mechanical point of view: during mechanical
tests, the determination of failure strain is done extremely
locally, and the lowest mechanical characteristics are obtained;
whereas, during wood machining the localisation of cutting
forces is extremely accurate and the lowest characteristics are
not always measured. Concerning elastic parameters, during
mechanical tests, generally an average modulus of elasticity is
obtained, very global, that erases local phenomenon, and so,
allowed the determination of a better approximation of cutting
forces involved during machining.
– The second explanation can be based on the analysis of
graphs obtained during wood machining. In fact, cutting forces
are measured in a very short period of time (0.6 ms), and each
total cutting force measured is the mean of 6 pics obtained dur-
ing these 0.6 ms. Then, it is frequent to obtain pics with different
heights (Fig. 10). So, it is possible that in some cases (b), the
strains involved are very close to wood limit strains (and so,
failure strains): case of very high pics. In other cases (a), during
the 0.6 ms of measurement, it is possible that the maximum
strains were never met (it is generally the case of woods like
dodomissinga: a rool chip is obtained and the maximum strain
is never obtained).
3.2.2. Hardness
Results obtained for Monnin hardness are presented in
Table IV. The relationship between Monnin hardness and cut-
ting forces was expressed by the following linear relationship:
F
c
= (1.0327 × N) + 31.861. (11)
This correlation presents an average coefficient of determi-
nation (R
2
= 0.53). In this case too, as for shearing, even if
the relation is not perfect, some exceptions met with specific
gravity can be explained with Monnin hardness. Then, moabi
whose specific gravity is similar to eucalyptus specific gravity
( 0.71), asked for a lower cutting force and also, presented a
lower hardness. In fact, during machining, the tool edge rubbed
the wood surface permanently, and through friction coefficient
[21, 32, 37], hardness appeared to be a very important factor
to be considered.
3.2.3. Compression parallel to the grain
Results obtained in compression are presented in Table V.
A good correlation is obtained between cutting forces and the
modulus of elasticity in compression:
F
c
= (0.0032 × E
c
) + 20.554. (12)
This correlation is not perfect (R
2
= 0.60) but is the best one
between compression factors and cutting forces. The other
relations with cutting forces were for σ
rupt
(R
2
= 0.58) and for
cutting energy (R
2
= 0.41). In this case too, as for shearing, the
Figure 10. Sketch of results obtained during the cutting forces
measurement; where “a” and “b” are different heights of pics, and “t”
is machining time.
≈
Table IV. Results obtained for Monnin hardness, with the measure
of the depth of mark “t” and the determination of Monnin hardness
“N”.
Monnin hardness Depth of mark (mm) N
Fromager 2.928 0.34
Ayous 1.148 0.87
Virola 0.898 1.11
Niangon 0.46 2.17
Grignon franc 0.753 1.33
Dodomissinga 0.38 2.63
Frake 0.198 5.05
Beech 0.242 4.13
Bagasse 0.158 6.33
Eucalyptus 0.134 7.46
Moabi 0.185 5.41
Wacapou 0.143 6.99
Ipé 0.084 11.90
Boco 0.042 23.81
Table V. Results obtained during the compression test parallel to the
grain direction, where σ
rupt
is the failure strain; W
rupt
is the energy
for failure, and E
c
is the elasticity modulus.
Compression test σ
rupt
(Mpa) E
c
(Mpa) W
rupt
(KJ/m
3
)
Fromager 16.17 1373 168.8
Ayous 28.58 2292 371.6
Virola 49.10 4262 335.5
Niangon 50.61 4658 345.5
Grignon franc 48.16 4310 346.1
Dodomissinga 54.63 5197 413.5
Frake 60.72 4906 550.8
Beech 55.44 4841 599.8
Bagasse 91.87 6951 855.6
Eucalyptus 79.74 6408 685.4
Moabi 73.90 6103 718.9
Wacapou 84.39 6957 692.5
Ipé 97.26 6540 1553.8
Boco 148.11 9940 1362.6
Wood properties to predict cutting forces 61
modulus of elasticity appeared to be the best factor to predict
cutting forces involved. It is something very well established
in Section 3.3.
As for hardness and shearing, but for different cases, the
factor (“E
c
”) can lead to new information on wood species
behaviour.
3.2.4. Fracture toughness
Results obtained concerning fracture toughness are pre-
sented in Table VI. The best correlation is obtained, in this
case too, for the elastic parameter “P
f,I
”, with the relation:
F
c
= (0.0015 × P
f,I
) + 27.15 (13)
R
2
= 0.66.
For the other parameters, relations obtained are relatively
good with a coefficient of determination of 0.59 for the equiv-
alent failure strain parameter “σ
r,I
”, and 0.49 for the fracture
energy parameter “G
f,I
”. This mechanical test although real-
ised in static, allowed a very good approximation of true wood
behaviour during machining. In fact, the unique parameter
“P
f,I
” is able to explain almost 70% of the variations of cutting
forces involved during machining. In comparison with results
obtained with specific gravity only, there is an improvement of
15% of the percentage of variation explained.
This test, although a little more complicated to achieve,
allowed an estimation of wood cracking resistance (phenome-
non extremely important during machining process [10, 41]).
Moreover, it is the best mechanical test used here, to describe
cutting forces involved. However, even if this formulation
seems correct, it is obvious that some exceptions still don’t have
explanations. It is, thus, necessary to relativize these results,
and some improvement must still be done. Maybe it is possible
that the addition of some physical or mechanical characteristics
to the specific gravity could increase the accuracy of the rela-
tionship between cutting forces and wood species! This is the
reason why statistical models were studied as explained
Section 3.3.
3.2.5. Comments about specific gravity
This study showed that all properties measured presented
good correlations with specific gravity (SG), following the
model [17, 22–24, 26, 35]:
S = a × SG
b
.
where S represents mechanical characteristics, and SG is the
specific gravity.
These correlations are illustrated in the following equations:
σ
c
= 10.33 × SG
1.1
, R
2
=0.84
with σ
c
: failure strain in shearing (Mpa);
N = 15.81 × SG
2.59
, R
2
=0.95
with N: Monnin hardness;
σ
r
= 125.59 × SG
1.26
, R
2
= 0.98
with σ
r
:
failure strain in compression (Mpa);
P
f,I
= 18444 × SG
2.11
, R
2
=0.86
with P
f,I
: equivalent elasticity in fracture toughness (Mpa).
The best correlations were obtained for elastic and failure
parameters (with coefficient of determination close to 0.9),
and the worst for energy parameters (R
2
0.75). Correlations
obtained are very close to results found in the Cirad forest data
base in Montpellier.
3.3. Study of a statistical model
Each physical and mechanical characteristic not being able
to explain alone cutting forces involved during machining,
their combination will probably improve the prediction! Then,
it was decided to work on different models.
The methodology used was multiple linear regression, and
variance analysis (utilisation of Microsoft software, excel).
Some combinations of factors were made with specific grav-
ity, cutting forces, mechanical and physical characteristics.
The validation of each regression was done, thanks to the
Fisher test (reliability level in Fisher’s table used is 0.95).
Moreover, in order to know if each factor is significantly sep-
arate in the correlation, a student test “t” was carried out. As
for the Fisher test, the risk was fixed at 5%, which means a
probability of 0.975 (because this is a bilateral test, [8]).
3.3.1. Characterisation of the final model
Several models were obtained and the best significant cor-
relation was obtained for the following equation composed of
these three characteristics: P
f,I
(elastic parameter in fracture
toughness), Ec (modulus of elasticity in compression), and SG
(specific gravity):
F
c
= (0.00139 × P
f,I
) + (0.0031 × ) (14)
R
2
= 0.80.
This model allowed an improvement of the coefficient of
determination and a reduction of 60% of errors sum of squares
(SCE, Tab. VII of the variance analysis). However, to pre-
cisely compare the coefficient of determination from simple
Table VI. Results obtained for tenacity test, where σ
r,I
is the
equivalent failure strain; G
f,I
is the representation of fracture energy,
and P
f,I
is the elastic parameter.
Tenacity test G
f,I
(J/m
2
) σ
r,I
(Mpa) P
f,I
(Mpa)
Fromager 27.38 1.78 403
Ayous 137.64 4.71 2254
Virola 149.27 4.09 1940
Niangon 243.76 9.89 9148
Grignon franc 175.83 5.92 3038
Dodomissinga 216.20 8.18 4583
Frake 155.25 9.60 8664
Beech 299.75 11.35 5959
Bagasse 75.83 6.14 7244
Eucalyptus 325.60 13.00 8245
Moabi 378.12 13.84 7552
Wacapou 132.10 8.83 8456
Ipé 212.52 13.07 14672
Boco 457.16 17.85 18080
≈
Ec
SG
62 F. Eyma et al.
and multiple correlations, a new coefficient must be calcu-
lated; partial coefficient of determination: R’
2
[43]:
R’
2
= 1 – (15)
It is thus possible to compare results obtained with only
specific gravity (R’
2
= 0.50), and results obtained with this
model (R’
2
= 0.77). Then, this formulation allows an improve-
ment of 27% of the percentage of cutting forces variation
explained.
In this model, the factor “E
c
/SG” characterises the specific
compression modulus, and in this way, the cellular-wall
mechanical strength, while specific gravity arises only like cor-
rective parameters. Nevertheless, specific gravity influence is
included into the tenacity parameter “P
f,I
” (coefficient of deter-
mination of 0.86 between these two factors).
The second factor of the equation is the modulus of tenacity.
As described previously, it presents good simple correlation
with cutting forces, and translates wood cracking behind the
cutting edge. It is something very important during machining
and chip formation.
During these tests, it appeared that elastics parameters were
the best factors. Two reasons were given in Section 3.2.1
(mechanical and machining point of view); in addition, there
are good correlations between failure strains and modulus of
elasticity (coefficient of determination close to 0.90).
Then, this kind of model, with factors interactions, seems to
be able to explain wood species behaviour and solicitations
involved during machining.
3.3.2. Comparison with different methods
Today, in France, one of the calculating methods frequently
used to estimate quick cutting forces in routing, milling or
dressing, use the formula:
F
c
= F
1
×b×K
e
×K
h
(16)
where F
1
and b are factors depending on cutting parameters;
K
e
is the species coefficient (Tab. VIII), and K
h
is the moisture
content coefficient [Kivimaa].
This method presents difficulties in precisely estimating
cutting forces involved during machining, particularly with
difficulties in taking the influence of wood species into
account accurately (with the specific gravity factor “Ke”). To
solve this problem, a new calculation method was studied with
results found there. In fact, a new factor was introduced for the
estimation of wood species influence: Km (material coeffi-
cient), described as:
K
m
= (5.73 × 10
–5
× ) + (2.57 × 10
–5
×P
f,I
). (17)
This coefficient “Km” takes the place of the coefficient
“Ke” in the formula (16), and the new equation becomes:
F
c
= F1 × b × Km × Kh. (18)
In order to estimate the importance of this new formula, it
is interesting to compare different calculation methods to esti-
mate cutting forces. As illustrated in Table IX, best results are
obtained for new formulation [18] with a gap of only 8.7%
with the reality (61.6% with the formula [16] and 13.8% in the
case with only the specific gravity).
Moreover, verification tests were done on other tropical
wood species: movingui “Distemonanthus benthamianus Baill.”,
and similar results were obtained. In fact, after several other
tests, it appeared that this formula seems to be very efficient
for all hardwoods (tropical and native), and a little less efficient
for softwoods [13].
Figures 11, 12 and 13 showed the improvement of accuracy
with the new formula (18), with a better correlation between
cutting forces calculated and cutting forces measured. In fact,
there is a wage of 25% of the percentage of cutting forces
explained, thanks to wood mechanical characteristics.
4. CONCLUSION
The aim of this study was to improve the cutting forces pre-
diction in milling process introducing chosen mechanical and
physical parameters in the model.
It was observed that specific gravity was not able to explain,
accurately and alone, the relation between wood species and
cutting forces involved during machining. In fact, it appeared
that best results were obtained for a combination of specific
Table VII. Variance analysis of the first model including interactions between factors: elasticity modulus in compression “E
c
”, specific gravity
“SG”, and Monnin hardness “N”.
Degrees of freedom Sum of squares Mean square F (Fisher)
Regression 2 786.37 393.19 24.07
Error 12 195.99 16.33
Total 14 982.36
n 1–
np– 1–
1R
2
–()×
.
Ec
SG
Table VIII. Determination of the coefficient “K
e
” in the calculation
of cutting forces involved during machining; formula (16).
Wood species “K
e
” coefficient
Balsa 0.5
Polplar 0.7
Silver fir 0.8
Beech 1.0
Niangon 1.2
Sipo 1.3
Oak 1.4
Méranti 1.5
Azobe 2.1
Plywood 1.3
Wood particle board 1.2
Fiber building board 2.5
Wood properties to predict cutting forces 63
gravity with some mechanical parameters. Something surpris-
ing is the importance of elastic parameters and the bad corre-
lations obtained with energy parameters. This phenomenon
was explained, by the way, to measure cutting forces and
mechanical characteristics (difficulty in measuring mechanical
characteristics locally, etc.). Moreover, among physical param-
eters, only specific gravity seems to be interesting to use.
However, the last formula (18) showed that internal struc-
tural characteristics of each species, and mechanical properties
more precisely, were able to lead to knowledge on wood behav-
iour during machining. And if correlation is not perfect today,
it is better; and the use of static mechanical tests is maybe one
reason for the imperfection of this new formula. Different
results and interpretations will be presented more accurately in
the thesis of Eyma [13]. In addition to this work on cutting
forces, a similar analysis was done on surface roughness. More-
over, something very interesting is that mechanical properties
measured in this work are very close to results found in the
Cirad forest data base. So, it is possible to extrapolate these
results to the whole of wood species of the Cirad forest.
To conclude, it appeared that the study of physical and
mechanical characteristics is a first means to take the wood
species factor into consideration correctly, without having to
undergo a microscopic analysis. The introduction of this new
material coefficient “Km”, and the creation of a new formula
(18), allowed an improvement of cutting forces evaluation,
and a better knowledge of wood behaviour during machining.
However, the correlation is still not perfect, and can still be
improved, maybe by new physical or mechanical tests ? or,
maybe by the introduction of friction coefficient, ? All these
tests should be done in the future.
Table IX. Comparison of different methods to calculate cutting forces: measure on routing (F
measured
), measure with formulations [16], [18]
and only with the specific gravity (F
[16]
, F
[18]
and F
(ID)
). Gaps between different methods.
F
measured
F
[16]
Gap
(F[16]/Fmes)
F
(ID)
Gap
(FID/Fmes)
F
[18]
Gap
(F[18]/Fmes)
Fromager 21.14 27.33 29 26.69 26 21.46 2
Ayous 30.52 38.26 25 29.77 2 25.74 16
Virola 36.70 43.72 19 32.62 11 34.37 6
Niangon 46.60 65.68 41 34.06 27 43.50 7
Grignon franc 28.93 38.26 32 34.48 19 31.83 10
Dodomissinga 41.65 43.72 5 34.87 16 38.73 7
Frake 34.59 54.65 58 36.39 5 39.55 14
Beech 33.19 54.65 65 36.92 11 34.53 4
Bagasse 36.76 76.51 108 40.13 9 41.41 13
Eucalyptus 46.31 76.51 65 40.58 12 39.70 14
Moabi 35.09 76.51 118 40.82 16 37.05 6
Wacapou 34.06 71.05 109 41.96 23 40.38 19
Ipé 44.92 81.98 83 44.62 1 44.27 1
Boco 55.22 114.77 108 51.77 6 52.97 4
37.55 N 60.45 N 61.59% 37.13 N 13.76% 37.12 N 8.66%
Figure 11. Relationship between cutting forces measure and cutting
forces estimate with the formula presented on Figure 9: F
figure9
=
(0.508 × F
measured
) + 18.255; R
2
= 0.52.
Figure 12. Relationship between cutting forces measure and cutting
forces estimate with the formula (17): F
formule16
= (1.824 × F
measured
) –
7.339; R
2
= 0.54.
Figure 13. Relationship between cutting forces measure and cutting
forces estimate with the formula (19): F
formule18
= (0.755 × F
measured
) +
9.05; R
2
= 0.78.
64 F. Eyma et al.
Acknowledgements: We would like to thank the Cirad forest for
funding experimental tropical wood, and all the staff of INRA –
Champenoux center – for their help in the achievement and interpre-
tation of specific gravity results.
REFERENCES
[1] AFNOR, French standard NF B 51006, approved in February 1942,
No. 85364, 1985.
[2] AFNOR, French standard NF B 51007, approved in February 1942,
No. 85365, 1985.
[3] AFNOR, French standard NF B 51011, approved in February 1942,
No. 80095, 1980.
[4] AFNOR, French standard NF B 51013, approved in February 1942,
No. 74789, 1974.
[5] Aguilera A., Optimisation des conditions de coupe pour l’usinage
du bois, Thèse de l’Univ. Henri Poincaré de Nancy I, 2000.
[6] Beauchêne J., Évolution du comportement mécanique du bois vert
avec la température – application à l’étude du déroulage et du tran-
chage de quelques bois Guyanais, Thèse présentée à l’ENGREF,
1996.
[7] Chardin A., Utilisation du pendule dynamométrique dans les
recherches sur le sciage des bois, Rev. Bois For. Trop. 58, 1958.
[8] Cisia-Ceresta, Aide-mémoire statistique, ISBN 2-906711-35-7,
1995.
[9] CTBA, État de l’art et évolutions des performances des machines
d’usinage du bois travaillant par enlèvement de copeau, 1991.
[10] Duchanois G., mesure de la ténacité et étude du comportement
mécanique des joints bois-colle, Thèse de l’INPL, 1984.
[11] Eyma F., Influence des caractéristiques physiques et mécaniques du
bois sur l’usinage, Rapport de DEA sciences du bois, Univ. Nancy I,
1999.
[12] Eyma F., Méausoone P.J., Martin P., Influence of the transitional
zone of wood species on cutting forces in the router cutting process
(90-0), Holz Roh-Werkst. 59 (2001) 489-490.
[13] Eyma F., Caractérisation des efforts de coupe de différentes essen-
ces de bois à l’aide de leurs paramètres mécaniques, thèse de l’Uni-
versité Henri Poincaré Nancy I, 2002.
[14] Fischer R., Wood cutting simulation – A program to experiment
without a machine, Proc. of the 14th IWMS, ISBN 2-87614-362-3,
1999, pp. 553–562.
[15] Franz N.C., An analysis of the wood-cutting process, Univ. of
Michigan Press, Ann. Arbor., Mich., 1958.
[16] Gonçalves M.T.T., Rodrigues R., Takahashi J.S.I., An experimen-
tal analysis of the influences of machining conditions on the paral-
lel cutting force in orthogonal cutting for ten Brazilian wood spe-
cies, Proc. of the 13th IWMS, 1997, pp. 481–487.
[17] Guitard D., Mécanique du matériau bois et composites, Cépaduès
éditions, ISBN 2.85428.152.7, 1987.
[18] Gustafsson P.J., Larsen H.J., Fracture energy of wood in tension
perpendicular to the grain - results from a join test project, Proc. of
CIB-W18A meeting in Lisbon, 1990.
[19] Huang Y-S., Hayashi D., Basic analysis of mechanism in wood-
cutting, Stress analysis in orthogonal Cutting parallel to grain, Mok.
Gak. l19 (1973) 7–12.
[20] Kivimaa E., Cutting force in wood working, Helsinki, 1950.
[21] Klamecki B.E., Friction mechanisms in wood cutting, Wood Sci.
Technol. 10 (1976) 209–214.
[22] Koch P., Wood machining process, Cambridge, Ronald press, 1964.
[23] Kollmann & Coté, Principles of wood science and technology,
Vol. I, Solid wood, ISBN 3-540-04297-0, Springer-Verlag, 1984.
[24] Kretschmann D.E., Green D.W., Modeling moisture content-
mechanical property relionship for clear southern pine, Wood Fiber
Sci. 28 (1995) 320–327.
[25] Larricq P., Une méthode d’estimation des caractéristiques de rup-
ture différée d’un matériau viscoélastique orthotrope, Application
au bois, Thèse de l’univ. de Bordeaux I, 1992.
[26] Martin P., Bois et Productique, Cépaduès éditions, ISBN
2.85428.128.4, 1992.
[27] McKenzie W.M., Fundamental analysis of the wood cutting pro-
cess, thesis of the dept. of wood tech., School of natural resources,
Univ. of Michigan, Ann. Arbor., 1961.
[28] McKenzie W.M., The basic wood cutting process, Proc. of the 2nd
IWMS, 1967, 3–8.
[29] McKenzie W.M., Ko P., Cvitkovic R., Ringler M., Towards a
model predicting cutting forces and surface quality in routing laye-
red boards, Proc of the 14th IWMS, ISBN 2-87614-362-3, 1999,
pp. 489–497.
[30] Merchant M.E., Mechanics of the metal cutting process (I) - ortho-
gonal cutting and a type II chip, J. Appl. Phys.16 (1945) 267–275.
[31] Mothe F., Duchanois G., Zannier B., Leban J-M., Analyse micro-
densitométrique appliquée au bois : méthode de traitement des don-
nées utilisée à l’Inra-ERQB, Ann. Sci. For. 55 (1998) 301–313.
[32] Murase Y., Coefficient of friction and temperature in the sliding
friction between wood and steel, Mok. Gak. 36 (1980) 571–575.
[33] Nicault A., Rathgeber C., Tessier L., Thomas A., Observations sur
la mise en place du cerne chez le pin d’Alep (Pinus halepensis
Mill.): confrontation entre les mesures de croissance radiale, de
densité et les facteurs climatiques, Ann. For. Sci. 58 (2001) 769–784.
[34] Orlenko L., Orlenko E., Making the mathematical model of the
wood cutting process, Proc. of the 14th IWMS, 1999, pp. 719–723.
[35] Pluvinage G., La rupture du bois et de ses composites, Cépaduès
éditions, ISBN 2.85428.292.2, 1992.
[36] Polge H., Établissement des courbes de variation de la densité du
bois par exploration densitométrique de radiographies d’échan-
tillons prélevés à la tarière sur des arbres vivants. Applications dans
les domaines technologiques et physiologiques, Ann. Sci. For. 23
(1966) 1–206.
[37] Sajus H.W., Irving E., Coiffet P., Modélisation et identification de
la force de frottement, Rev. Autom. Prod. Appl. l6 (1993) 65–79.
[38] Sales C., La scie à ruban - théorie et pratique du sciage des bois en
grumes, CTFT départ. du CIRAD, 1990.
[39] Schatz T., Zur bestimmung der bruchenergierate GF bei holz, Holz
Roh-Werkst. 53 (1995) 171–176.
[40] Stewart H.A, Chip formation when orthogonally cutting wood
against the grain, Wood Sci. 3 (1971) 193–203.
[41] Triboulot P., Application de la mécanique de la rupture aux bois
massifs considérés comme matériaux de construction, Thèse de
l’univ. de Metz, 1981.
[42] Triboulot P., Asano I., Ohta M., Rapport final du séjour effectué par
P. Triboulot au laboratoire du bois de Mr le professeur Asano, Mok.
Gak. l29 (1983) 11–117.
[43] Wonnacott T.H., Wonnacott R.J., Statistique - économie, gestion,
sciences, médecine, ISBN 2-7178-2072-8, 1991.