Báo cáo lâm nghiệp: "Leaf morphology as species indicator in seedlings of Quercus robur L. and Q. petraea (Matt.) Liebl.: modulation by irradiance and growth flush" potx
Bạn đang xem bản rút gọn của tài liệu. Xem và tải ngay bản đầy đủ của tài liệu tại đây (562.72 KB, 8 trang )
73
Ann. For. Sci. 61 (2004) 73–80
© INRA, EDP Sciences, 2004
DOI: 10.1051/forest:2003086
Original article
Leaf morphology as species indicator in seedlings of Quercus robur L.
and Q. petraea (Matt.) Liebl.: modulation by irradiance
and growth flush
Stéphane PONTON, Jean-Luc DUPOUEY*, Erwin DREYER
Unité Mixte de Recherches INRA-UHP-Nancy, « Écologie et Écophysiologie Forestières », 54280 Champenoux, France
(Received 7 February 2002; accepted 17 February 2003)
Abstract – Morphological description of leaves provides the most reliable criteria to discriminate between the two oak species Quercus petraea
and Q. robur. However, most earlier studies only assessed leaf morphology of adult trees, whereas interspecific variations between seedlings
were poorly documented. We studied variations of leaf morphology on two-year-old seedlings growing in a common garden experiment and
exposed to different irradiance regimes. Morphological measurements were performed on leaves from each growth flush. Large interspecific
differences were detected. The discrimination between the two species was slightly better with first flush leaves. Irradiance influenced leaf size,
but did not affect the characters usually used to discriminate the two species, like relative petiole length or angle of auricle at the base of the
lamina. A discriminant function, based on the two most discriminating traits (lamina pilosity density and angle of auricles at the lamina base),
provided less than 0.5% leaf misclassification. It appeared that, contrary to what is generally accepted, species recognition of oak seedlings
based on leaf morphology is possible. Moreover, this is true whatever the irradiance regime, and even slightly easier under light shade than in
full sun.
morphology / leaf / light / flush / oak
Résumé – La morphologie foliaire comme indicateur spécifique chez les semis de Quercus robur L. et Q. petraea (Matt.) Liebl.: variation
avec l’éclairement et l’unité de croissance. La discrimination taxonomique des espèces Quercus petraea et Q. robur est essentiellement basée
sur l’examen des fructifications, souvent absentes, ou de la morphologie foliaire. Alors que l’ensemble des travaux sur le sujet concerne des
arbres adultes, nous avons étudié les variations morphologiques foliaires de jeunes plants de Q. petraea et Q. robur croissant sous différents
régimes d’éclairement. La morphologie des feuilles des différents flushs a été analysée durant la deuxième année de croissance des plants en
pépinière. Une analyse factorielle des correspondances portant sur l’ensemble de l’échantillon et intégrant toutes les variables morphologiques
aboutit à une discrimination interspécifique nette dans la majorité des cas. La discrimination apparaît cependant meilleure pour les feuilles de
la première unité de croissance. Le régime d’éclairement a principalement affecté la taille des feuilles. Les variables usuelles permettant la
discrimination morphologique entre Q. petraea et Q. robur n’ont pas été affectées par les différences d’éclairement. Une fonction discriminante
a été construite avec les deux variables les plus discriminantes (densité de pilosité du limbe et angle des oreillettes), aboutissant à moins de
0.5 % d’erreur dans le classement des feuilles. Contrairement à une opinion répandue, la discrimination des espèces de chêne est possible dès
le stade jeune plant. De plus, elle ne nécessite pas obligatoirement l’observation des seules feuilles développées en pleine lumière. Elle est même
légèrement meilleure sous un léger ombrage.
morphologie / feuille / lumière / unité de croissance / chêne
1. INTRODUCTION
An efficient identification of Quercus petraea and Q. robur
is essential for foresters and scientists because these two inter-
fertile and sympatric oak species display different ecological
requirements [16]. Because of the large variability among indi-
viduals in morphological features, this identification may be
difficult, in particular within mixed stands where the taxonom-
ical status of trees is often uncertain. In the absence of fruits,
leaf morphology remains one of the most reliable criteria to dis-
criminate between the two species [1, 7, 9, 12, 13, 15]. Conse-
quently, many studies comparing Q. petraea and Q. robur use
identification criteria based on leaf morphology. In particular,
genetic studies aiming to find species-specific molecular mark-
ers still rely on morphological characters to define these two
species [6, 18, 19].
Most of the studies assessing interspecific variations of leaf
morphology were performed on sun leaves of adult trees.
Kleinschmit et al. [14] analysed the morphology of offspring
from controlled crosses and reported the occurrence of a juve-
nile leaf morphology, which differed from that of adult indi-
viduals. Nevertheless, there is still a need to unequivocally
* Corresponding author:
74 S. Ponton et al.
identify seedlings from the two species in natural regenera-
tions (i.e., shaded by surrounding adult trees). For sun leaves
of adult trees, the best features discriminating between the two
species are pilosity development, presence of intercalary
veins, length of petiole and angle of the auricles at the lamina
base [3, 7, 8]. However, leaf morphology is influenced by
shading. Besides the well-known increase of leaf size and
decrease of thickness [2] under shade, Blue and Jensen [5]
indicated that sun leaves of oak (Q. velutina, Q. rubra and
Q. palustris) had larger and deeper sinuses, a narrower blade
and a higher number of veins than shade leaves located at the
same level in the crown. Rushton [23] and Baranski [4] con-
sidered that, for leaf characters, the typical expression of the
genotype of a tree occurs in the most light-exposed part of the
crown.
Another source of variation of leaf morphology is related to
the polycyclic pattern of growth of oaks that usually build two
or three growth units (flushes) during the growing season.
Kissling [13] found that leaves of the second flush presented a
narrower base, shallower lobes, a reduced pubescence and a
shorter petiole than those of the first flush. This is of particular
importance as the shape of the lamina base, pilosity and peti-
ole length are among the main criteria used to discriminate the
two species.
The objectives of the present study were:
– to check whether the discrimination was still possible
among the two species (i) on seedlings, (ii) under different
light environments and (iii) with leaves from various growth
flushes;
– to examine the variations induced in leaf morphology on
seedlings exposed to different irradiance regimes during their
development;
– to assess the variations in morphology occurring between
flushes and to compare them with light-induced variations;
– to provide a useful tool for a rapid identification of oak
seedlings from these two species, under different irradiance
levels and at different stages of development.
To answer these questions, seedlings of Q. petraea and
Q. robur were grown under different irradiance regimes dur-
ing two years. Leaf morphology measurements were per-
formed at the end of the experiment.
2. MATERIAL AND METHODS
2.1. Plant material and experimental design
Acorns were collected during autumn 1997 in two adjacent pure
stands of Q. petraea and Q. robur in the forest of Perseigne (48° 24’
21” N, 0° 19’ 33” W, Western France). Adult trees were identified
based on acorn peduncle size and characteristic leaf traits [8]. The
two specific sets of acorns were a composite harvest from around
20 randomly selected trees. Acorns were sown in an experimental
nursery (Champenoux, Nancy, N.E. France) during spring 1998.
Seedlings were grown in 10 litre plastic containers filled with a sand/
peat mixture (2/1, v/v) until autumn 1999. They were automatically
irrigated twice a day and fertilised two times during summer (Nutri-
cot
®
, N/P/K 13/13/13 + trace elements, 4 g·L
(substrate)
–1
). Before ger-
mination, the containers were distributed to four treatments differing
by transmitted irradiance: 8 (deep shade), 18 (medium shade), 48
(light shade) and 100% (full sun) of external global irradiance. Shad-
ing was obtained using shelters built with polyethylene nets incorpo-
rating aluminium strips. Three different mesh sizes provided the
required levels of transmitted irradiance.
Ten seedlings were randomly selected per species during autumn
1999 for subsequent morphological analysis in each of the four irra-
diance treatments. A detailed description of the experimental design
and microclimate is provided in Ponton et al. [21].
2.2. Morphological analysis
At the end of the experiment, seedlings had developed up to four
growth flushes. This number of flushes was influenced by growth
irradiance, but there was no significant interspecific difference within
an irradiance regime. Before leaf senescence, one fully expanded leaf
per flush was sampled from between 8 and 10 seedlings per species
and irradiance level. Leaves of the fourth flush were discarded
because it developed on only 21% individuals of the total sample.
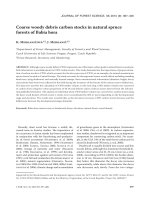
Table I. List of descriptors of leaf morphology measured or
calculated. Letters in parentheses refer to labelled points in Figure 1.
Primary variables
Dimensional characters
PL: petiole length (A-B, cm)
LL: lamina length (B-D, cm)
PERI: lamina perimeter (cm)
AREA: lamina surface area (cm
2
)
LW: maximal lamina width (E-F, cm)
LWL: length of lamina to the largest width (B-G, cm)
MASS: leaf mass (g)
Lobes and veins
NLOB: number of lobes (except the terminal lobe, irrigated by the midrib)
NLUB: number of lobules (lobes irrigated by a third order vein)
LOBL: mean of the length of the six largest lobes (e.g. HI, mm)
LOBT: mean of the thickness of the six largest lobes (e.g. LK, mm)
LOBH: mean of the height of the six largest lobes (e.g. JM, mm)
NIV: number of intercalary veins (veins irrigating a sinus)
AURI: average angle of the two auricles at the lamina base (e.g. A-B-C, °)
AVEIN: mean of the vein angles of the six largest lobes (e.g. K-G-D, °)
ASIN: mean of the sinus angles of the six largest lobes (e.g. I-J-K, °)
ALOB: mean of the angles of the six largest lobes (e.g. J-K-M, °)
Abaxial pubescence
PPD: petiole pilosity density, score from 0 (hairless) to 6 (dense pilosity);
grading system from Kissling [13]
MPD: midrib pilosity density
LPD: lamina pilosity density
PPL: hair length on the petiole, graded from 0 (hairless) to 4 (very long)
MPL: hair length on the midrib
LPL: hair length on the lamina
Calculated variables
PRL: relative length of the petiole, PL / (LL+PL) (%)
LRW: relative width of the lamina, LW / LL (%)
LWRL: relative length of lamina at largest width, LWL / LL (%)
ARPE: surface area to perimeter ratio, AREA / PERI
ISOP: isoperimetric deficit, 1 – (4π AREA / PERI
2
)
ELD: elliptic deficit, (π LL LW) / (4 AREA)
IVLOB: number of intercalary veins per lobe, NIV / NLOB (%)
RLIV: relative length of intercalary vein (e.g. NO/NP, %)
PERINL: perimeter to number of lobes ratio, PERI / NLOB (cm)
LUBLOB: number of lobules per lobe, NLUB / NLOB (%)
LMA: leaf mass per area, MASS / AREA (g·cm
–2
)
×
×
×
×
Variability of leaf morphology in oak seedlings 75
Leaves of the third flush of Quercus petraea grown under 8% irradi-
ance could be collected from five trees only. For each growth flush
on the main stem, the largest leaf of the final rosette (top of the growth
unit) was harvested. Selected leaves were free of insect attacks or dis-
ease symptoms. Finally, 221 leaves were sampled from 80 trees.
Measurements were performed with a digitizing tablet interfaced
with a computer. The protocol of leaf morphology assessment is
described by Dupouey and Badeau [8]. Twenty-three variables were
measured and used to derive 11 calculated variables (Tab. I and
Fig. 1). These variables concern various aspects of leaf morphology
such as size, shape and pilosity. The dry mass of each leaf was meas-
ured and the leaf mass to area ratio calculated.
2.3. Statistical analysis
The set of morphological descriptors included quantitative contin-
uous variables as well as quantitative discrete (counted variables) and
qualitative variables (describing pubescence). In order to analyse the
relationships between these variables, all the quantitative continuous
variables were converted into scored variables, each made of five equi-
distributed groups (equal number of observations in each group).
When discrete and qualitative variables contained initially more than
five groups, initial groups were combined into five new groups with
equal or nearly equal numbers of observations. Then, these 34 varia-
bles × 5 classes were analysed by multiple correspondence analysis
(MCA). A stepwise discriminant analysis was performed to select the
two best variables for species discrimination.
The effects of species, irradiance regime, growth flush and their
interactions on continuous morphological variables and on MCA fac-
tors were estimated and tested with an analysis of variance (ANOVA).
The following linear model was used:
Y
ijkl
= a + b
i
+ c
j
+ d
k
+ (bc)
ij
+ (bd)
ik
+ (cd)
jk
+ e
ijkl
(model 1)
with Y
ijkl
: measured value for flush k of seedling l, within species i,
under irradiance regime j, a: overall mean, b
i
: effect of species i,
c
j
: effect of irradiance regime j, d
k
: effect of flush k, (bc)
ij
: interaction
between effects of species and irradiance regime, (bd)
ik
: interaction
between effects of species and flush, (cd)
jk
: interaction between
effects of irradiance regime and flush, e
ijkl
: error term.
Third order interaction between irradiance, species and flush
effects was never significant. Thus, it was finally excluded from the
model. The effects of species, irradiance regime and growth flush on
quantitative discrete (PL, NLOB, NLUB, NIV) and qualitative mor-
phological variables (pubescence related variables) were separately
tested using a Chi-square test. Tukey studentized range tests (also
called HSD) were used for multiple comparisons of means. Pearson
and Spearman (rank) correlation coefficients were used as exploratory
tools. Data are presented as means ± standard deviation. Statistical
analyses were performed using the SAS software (SAS, version 6.03,
Institute Inc., Cary, NC, USA) [24].
3. RESULTS
3.1. Modulation of leaf morphology by irradiance
The effects of irradiance regime on leaf morphology were
mainly visible on size related variables (Tabs. II and III), but
also on relative length of petiole (PRL) and leaf mass per area
(LMA). Irradiance regime was the first source of variation
(25% of total variability) for leaf length (LL + PL). Very sig-
nificant correlations occurred between leaf length and other
dimensional traits (LWL, PERI, AREA, LOBL, LW, LOBT…
see Tab. IV). Beside these expected correlations, a weaker but
still significant correlation was observed with petiole length
(r = 0.58, P < 0.001 for Q. petraea and r = 0.37, P < 0.001 for
Q. robur) which is usually considered to be one of the most
reliable traits to discriminate between the two species. No cor-
relation occurred with relative petiole length. Leaf length was
maximum under medium shade (12.5 ± 2.4 cm), decreased in
light shade (11.6 ± 2.3 cm) and deep shade (10.3 ± 1.9 cm),
and was minimum under full sun (9.1 ± 2.2 cm). The other
size variables (MASS, LW, LWL, PERI, SURF, NLOB,
LOBL, LOBT, LOBH) displayed the same trend. This pattern
of irradiance regime-induced variations was observed on both
species, although it was slightly more marked on Q. robur
(larger magnitude of values from medium shade to full sun).
Figure 1. Typical leaves of Q. robur and
Q. petraea. The landmarks used for mor-
phological measurements are indicated.
76 S. Ponton et al.
As expected, leaf mass per area gradually increased with
increasing irradiance. Leaves of medium and light shades had
a higher degree of dissection of the blade than leaves of deep
shade and full sun (ELD, ISOP). These two dissection param-
eters were weakly related to leaf size (r = 0.26, P < 0.001 and
r = 0.22, P < 0.01, respectively; Tab. IV).
3.2. Leaf morphology variation among growth units
Flushing was the second source of variation in leaf size
(20% and 7% of the total variability of leaf length and surface
area, respectively; Tabs. II and III). Leaf size increased with
flush rank in both species: average leaf lengths were 9.4 ±
2.0 cm, 11.5 ± 2.4 cm and 12.1 ± 2.4 cm, from the first to the
third flush, respectively. Lamina dissection (ELD, ISOP)
increased from the first to the third flush, even if the ratio
‘number of lobes to perimeter’ slightly decreased. The effects
of growth flush rank on leaf size and lamina dissection were
larger on Q. petraea than on Q. robur (larger range of values
from flush 1 to flush 3). For both species, the number of inter-
calary veins (NIV) increased from flush 1 to 3 (0.3 ± 0.6 to
2.3 ± 1.6 for Q. petraea, 2.5 ± 0.5 to 3.9 ± 1.7 for Q. robur).
Lamina pubescence (LPL) decreased from flush 1 to 3, in
Q. petraea only. The angle of lamina base (AURI) was larger
in flushes 1 and 2 than in flush 3 in Q. petraea. In Q. robur,
auricles at the lamina base were slightly more developed in
flush 3 than in flush 2 (i.e. larger AURI values in flush 2).
Table II. Sources of variation (species, irradiance regime, flush and
their interactions) for morphological variables and coordinates on
the first two axes of MCA, revealed by ANOVA. P-values are sym-
bolized as follows: * P < 0.05, ** P < 0.01, *** P < 0.001, and non
significant otherwise. Variables for which no significant effect was
observed are not shown.
Variable Species Irradiance Flush
Species*
light
Species*
flush
Light*
flush
MASS *** *** *** * *
LMA *** *** *** ***
LL *** *** *
LTOT ** *** *** *
LW ***
LWL * *** *** **
PERI *** ***
AREA * *** ***
PRL *** *** *** * *
LRW ***
ARPE *** *** * *
ISOP *** ** *** ***
ELD *** * ***
RLIV *** *** ***
PERINL *** *** *** **
LUBLOB *
IVLOB *** ***
AURI *** **
LOBL *** ***
LOBT *** *** *** *
LOBH *** *** **
AV E I N ** *
ASIN ** * ***
ALOB *** *
MCAaxis1 *** *** *** * ** *
MCAaxis2 *** *** ***
Table III. χ
2
test of species, light and flush effects on morphological
discrete variables. See Table II for significance of stars.
Variable Species Irradiance Flush
PL *** **
PPD ***
PPL *** *
MPD ***
MPL *** * *
LPD ***
LPL *** ***
NLOB ***
NLUB ** *
NIV *** ***
Table IV. Significant Pearson’s correlation (P < 0.05) between leaf
length (LL + PL) and others morphological traits (n = 221) or coor-
dinates on the first two axis of MCA. See Table II for significance of
stars.
Variable Coefficient of correlation
LL 0.99 ***
LWL 0.89 ***
PERI 0.89 ***
AREA 0.89 ***
LOBL 0.81 ***
MCA axis2 0.79 ***
LW 0.77 ***
LOBT 0.76 ***
MASS 0.74 ***
ARPE 0.71 ***
PERINL 0.58 ***
LOBH 0.52 ***
MCA axis1 –0.44 ***
PL 0.43 ***
LRW –0.35 ***
NLOB 0.32 ***
ELD 0.26 ***
ISOP 0.22 **
NLUB 0.22 **
LMA –0.14 *
Variability of leaf morphology in oak seedlings 77
3.3. Species differentiation
The three first synthetic variables of MCA explained 6.9%,
6.6% and 4.0% of the total variance, respectively, over a total
of 170 classes analysed. The first factor was highly correlated
with morphological traits that are usually recognized as spe-
cies specific (in descending order of correlation: AURI, LPD,
MPD, NIV, LPL…). The second factor of MCA correlated
with size variables (in descending order of correlation: LOBL,
LL, LW, AREA, PERI, LWL…). The third synthetic variable
was mainly related to the degree of lamina dissection (in
descending order of correlation: ARPE, AREA, ISOP, ELD,
ASIN, ALOB…). The plane of the first two axes of MCA
showed a clear discrimination between the two species, with
very limited overlap (Fig. 2). When considering leaves from
the first flush only, a total separation was observed between
the two species on this factorial plane. Average values of the
main discriminant variables for the two species are given in
Table V.
The two first variables selected by stepwise discriminant
analysis of leaf morphology were lamina pilosity density
(LPD) and average angle of auricles at lamina base (AURI).
The discriminant function was (Fig. 3):
ID
1
= 2367 – 537 × LPD – 13 × AURI.
This function provides positive ID
1
values for Q. robur and
negative ones for Q. petraea. According to this function, the
percentage of misclassification of leaves was below 0.5% (one
misclassified leaf over 221). The whole data set showed a very
clear bimodal distribution for ID
1
values (Fig. 4). The degree
of discrimination between the two species was separately tested
for each flush by a comparison of mean ID
1
values. The dis-
crimination was larger for the leaves from the first flush (F =
827, P < 0.001), intermediate for the leaves from the second
flush (F = 540, P < 0.001), and lower for the leaves from the
third flush (F = 463, P < 0.001). Tested by the same method
within each irradiance regime, the species discrimination was
larger in light shade (F = 723, P < 0.001) than in medium shade
(F = 548, P < 0.001), and lower under full sun (F = 342, P <
0.001) and deep shade (F = 339, P < 0.001). The only one mis-
classified leaf came from the third flush of a Q. robur seedling
growing under deep shade.
We tested the stability across growth flushes of morpholog-
ical traits which discriminate between the two species. Rank-
ing of the seedlings according to their ID
1
values strongly var-
ied from one flush to the next. Rank correlations were not
significant for Q. robur (P > 0.05) and only significant
Figure 2. Position of the 221 leaves along the first two factors of a
multiple correspondence analysis (MCA). Large symbols: leaves
from flush 1, small symbols: leaves from flushes 2 and 3. Q. petraea:
{, Q. robur: ¡.
Table V. Minimum, average and maximum values of discriminant or
remarkable morphological traits for Q. petraea and Q. robur. Leaves
from all light treatments, but from the first flush only, are taken into
account.
Va ria bl e
Q. petraea (n = 38) Q. robur (n = 40)
Min Average Max Min Average Max
LPD 2.0 4.0 5.0 0.0 0.2 2.0
MPD 1.0 2.8 4.0 0.0 0.8 2.0
PPD 0.0 0.9 4.0 0.0 0.0 0.0
LPL 1.0 1.6 3.0 0.0 0.3 3.0
MPL 2.0 3.5 4.0 0.0 2.2 4.0
PPL 0.0 1.3 4.0 0.0 0.0 0.0
AURI (°) 112 143 155 –10 41 113
PL (mm) 2.0 5.1 10.0 0.0 1.6 5.0
LL (mm) 57 88 123 58 92 145
AREA (cm
2
) 11 28 53 10 28 70
NIV 0.0 0.3 2.0 0.0 2.5 6.0
NLOB 6.0 12.3 18.0 8.0 10.6 15.0
NLUB 0.0 1.6 10.0 0.0 1.1 4.0
LMA (g·cm
–2
) 0.36 0.68 1.11 0.38 0.65 1.08
Figure 3. Distribution of the 221 leaves according to the average
angle of auricles at the lamina base (AURI) and the lamina pilosity
density (LPD). The diagonal straight line is the discriminant line:
2367 – 537 LPD – 13 AURI = 0. Q. petraea: {, Q. robur: ¡.
×
×
78 S. Ponton et al.
between flushes 1 and 2 (r = 0.35, P < 0.05) and between
flushes 2 and 3 (r = 0.37, P < 0.05) for Q. petraea.
To compare our results obtained on seedlings with those
obtained on adult trees, another discriminant function was cal-
culated based on petiole length (PL) and number of intercalary
veins (NIV), as proposed by Dupouey and Badeau [8] and
Kremer et al. [15]:
ID
2
= 4178 – 1507 × PL + 900 × NIV.
Using this function resulted in the misclassification of 13
Q. robur and 11 Q. petraea leaves (11% of the total number of
leaves).
4. DISCUSSION
The multivariate correspondence analysis separated the
sampled leaves into 2 groups corresponding to the two oak spe-
cies, Q. robur and Q. petraea (Fig. 2). As frequently mentioned,
no absolute diagnostic character discriminating between the
two species could be detected [1, 3]. However, species discrim-
ination was already very efficient with a combination of only
two morphological traits. This situation is in agreement with
what has been classically observed on sun leaves collected from
first growth flush of adult trees, where a clear bimodal distri-
bution was detected for synthetic discriminant variables
[3, 8, 15].
On adult trees, Bacilieri et al. [3] observed 1% misclassifi-
cation by means of a factorial discriminant analysis computed
with 16 morphological characters, and Kremer et al. [15] cal-
culated a discriminant function resulting in 1.6% misclassifi-
cation with two variables only. This rate was obtained using
samples of five leaves per tree and increased up to 5.6% with
samples of only one leaf. Based on average angle of auricles at
lamina base (AURI) and lamina pilosity density (LPD), our
discriminant function (ID
1
) revealed only one misclassified
leaf (Fig. 3). These two traits appeared to be very discriminant
but are not very easy to measure. However, using the more
classical petiole length (PL) and number of intercalary veins
(NIV), as did Kremer et al. [15], resulted in 11% misclassifi-
cation in our sample. Thus, these two last traits were not as
reliable in the case of young seedlings as for adults.
Even if species identification with ID
1
values was correct in
nearly all cases, it appeared that the discrimination between
Q. robur and Q. petraea was better with leaves from the first
flush than from the followings. The number of intercalary
veins (NIV) was strongly influenced by flush, what could par-
tially explain the mediocre species discrimination based on
ID
2
values. Leaves from flushes 2 and 3 differed less from
each other than they did from flush 1, as already observed by
Masarovicova and Pozgaj [17]. Potter [22] reported that leaves
exhibit a larger variability on the second than on the first flush.
These observations could be related to the fact that the first
growth unit is entirely preformed in the winter bud, whereas
the second and third growth units bear both preformed and
neoformed segments [10]. Thus, neoformed leaves could be
under stronger influence of the environment than preformed
ones, the development of the latter being probably more genet-
ically controlled. This hypothesis is reinforced by the observa-
tion that oak epicormic shoots, which usually display atypical
leaves similar to those found on lammas (second flush) shoots,
are also entirely neoformed [11]. Following previous authors
[13, 20, 22], we recommend that leaves from both lammas and
epicormic shoots should be discarded from samples used for
species discrimination.
According to the result of the F-test of species effect on ID
1
under each irradiance regime, individuals growing under inter-
mediate levels of shade displayed the most species-discrimi-
nating features. This observation opposes the common prac-
tice for adult trees, where shaded leaves are discarded for
species identification [5, 8, 20, 23]. This effect of light regime
could be partly related to the leaf size, because we observed a
link between irradiance level, leaf size and species discrimina-
tion: for a given flush, small leaves of Q. robur and Q. petraea,
grown under full sun or deep shade were poorly separated,
whereas larger leaves were better identified, as was the case
under light and especially medium shade (Fig. 5). Finally, one
can note that under natural regeneration conditions, the frac-
tion of global irradiance reaching forest floor is generally
between 20 and 40%, which corresponds to the range of irra-
diance where the specific discrimination was the best in our
study.
5. CONCLUSION
Our results showed a clear interspecific discrimination
among leaves sampled on oak seedlings exposed to different
irradiance regimes and collected on successive growth units.
Identification of the species, at the seedling stage, was possi-
ble using only two morphological traits, the density of pilosity
of the lamina and the average angle of auricles at the lamina
base. Consequently, Q. robur and Q. petraea offspring can be
discriminated in experimental or natural conditions, whenever
shaded or not by surrounding adult trees, and preferably using
leaves from the first flush. Species recognition could probably
Figure 4. Distribution of the discriminant function values: ID
1
=
2367 – 537 × LPD – 13 × AURI for the 221 tested leaves.
Variability of leaf morphology in oak seedlings 79
be even improved using of a discriminant function based on
the average measurements of several leaves collected on the
same tree.
Acknowledgements: S. Ponton was supported by a PhD grant from
the Institut National de la Recherche Agronomique and from the
Regional Council of Lorraine. We gratefully acknowledge the
technical assistance of Roger Schipfer, Virginie Legroux, Sébastien
Diette and Christian Kieffer for morphological analyses, and of Jean-
Marie Gioria for seedling cultivation. Financial support from the
French initiative “GIP-Ecofor” for experiment installation is
gratefully acknowledged. The study was partly carried out with a
financial support from the Commission of the European Communities,
Agriculture and Fisheries (FAIR) specific RTD programme
(PATHOAK), CT97-3926 (“Long term dynamics of oak ecosystems:
assessment of the role of root pathogens and environmental constraints
as interacting decline inducing factors”).
REFERENCES
[1] Aas G., Taxonomical impact of morphological variation in Quercus
robur and Q. petraea: a contribution to the hybrid controversy,
Ann. Sci. For. 50 (1993) 107s–113s.
[2] Aranda I., Bergasa L.F., Gil L., Paros J.A., Effects of relative
irradiance on the leaf structure of Fagus sylvatica L. seedlings
planted in the understory of a Pinus sylvestris L. stand after
thinning, Ann. For. Sci. 58 (2001) 673–680.
[3] Bacilieri R., Ducousso A., Kremer A., Genetic, morphological,
ecological and phenological differentiation between Quercus
petraea (Matt.) Liebl. and Quercus robur L. in a mixed stand of
Northwest France, Silvae Genet. 44 (1995) 1–10.
[4] Baranski M., An analysis of variation within white oak (Quercus
alba L.). North Carolina Agric. Exp. Sta. Tech. Bull. 236 (1975)
176 p.
[5] Blue M.P., Jensen R.J., Positional and seasonal variation in oak
(Quercus; Fagaceae) leaf morphology, Am. J. Bot. 75 (1988) 939–
947.
[6] Bodénès C., Joandet S., Laigret F., Kremer A., Detection of
genomic regions differentiating two closely related oak species
Quercus petraea (Matt.) Liebl. and Quercus robur L., Heredity 78
(1997) 433–444.
[7] Dupouey J L., Analyse multivariable de quelques caractères
morphologiques de populations de chênes [Quercus robur L. et
Quercus petraea (Matt.) Liebl.] du Hurepoix, Ann. Sci. For. 40
(1983) 265–282.
[8] Dupouey J L., Badeau V., Morphological variability of oaks
[Quercus robur L., Quercus petraea (Matt.) Liebl., Quercus
pubescens Willd] in northeastern France: preliminary results, Ann.
Sci. For. 50 (1993) 35s–40s.
[9] Feuillat F., Dupouey J-L., Sciama D., Keller R., A new attempt at
discrimination between Quercus petraea and Quercus robur based
on wood anatomy, Can. J. For. Res. 27 (1997) 343–351.
[10] Fontaine F., Chaar H., Colin F., Clément C., Burrus M., Druelle J
L., Preformation and neoformation of growth units on 3-year-old
seedlings of Quercus petraea, Can. J. Bot. 77 (1999) 1623–1631.
[11] Fontaine F., Druelle J-L., Clément C., Burrus M., Audran J-C.,
Ontogeny of proventitious epicormic buds in Quercus petraea. I. In
the 5 years following initiation, Trees 13 (1998) 54–62.
[12] Grandjean G., Sigaud P., Contribution à la taxonomie et à l'écologie
des chênes du Berry, Ann. Sci. For. 44 (1987) 35–66.
[13] Kissling P., Clef de détermination des chênes médioeuropéens
(Quercus L.). Ber. Schweiz. Bot. Ges. 90 (1980) 29–44.
[14] Kleinschmit J.R.G., Bacilieri R., Kremer A., Roloff A.,
Comparison of morphological and genetic traits of pedunculate oak
(Q. robur L.) and sessile oak [Q. petraea (Matt.) Liebl.], Silvae
Genet. 44 (1995) 256–269.
[15] Kremer A., Dupouey J-L., Cottrell J., Csaikl U., Deans D.,
Finkeldey R., Goikoetxea P., Jensen J., König A., Van Dam B.,
Ducousso A., Badeau V., Morphological variation in mixed oak
Figure 5. Typical leaves of Q. robur and Q. petraea grown
under full sun or medium shade. Leaves from flushes 1 and
2 were sampled on the same tree.
80 S. Ponton et al.
stands (Quercus robur and Quercus petraea) is stable across
western European populations, Ann. For. Sci. 59 (2002) 777–787.
[16] Lévy G., Becker M., Duhamel D., A comparison of the ecology of
pedunculate and sessile oaks: radial growth in the centre and
northwest of France, For. Ecol. Manage. 55 (1992) 51–63.
[17] Masarovicova E., Pozgaj J., Comparative analysis of the leaf area
in three oak species – a methodical contribution, Biológia
(Bratislava) 43 (1988) 449–457.
[18] Moreau F., Kleinschmit J.R.G., Kremer A., Molecular differentia-
tion between Quercus petraea and Quercus robur assessed by ran-
dom amplified DNA fragments, For. Genet. 1 (1994) 51–64.
[19] Muir G., Fleming C.C., Schlötterer C., Species status of hybridizing
oak, Nature 405 (2000) 1016.
[20] Olsson U., A morphological analysis of phenotypes in populations
of Quercus (Fagaceae) in Sweden, Bot. Not. 128 (1975) 55–68.
[21] Ponton S., Dupouey J-L., Bréda N., Dreyer E., Comparison of
water-use efficiency of seedlings from two sympatric oak species:
genotype × environment interactions, Tree Physiol. 22 (2002) 413–
422.
[22] Potter S.M., Practical methods for distinguishing the two native
British oaks and their intermediates, Q. J. For. 88 (1994) 27–34.
[23] Rushton B.S., Quercus robur L. and Quercus petraea (Matt.) Liebl.:
a multivariate approach to the hybrid problem, 1. Data acquisition,
analysis and interpretation, Watsonia 12 (1978) 81–101.
[24] SAS/STAT User’s Guide, Version 6.03, SAS Institute Inc., Cary,
N.C., 4th ed., 1989, 1848 p.
To access this journal online:
www.edpsciences.org