Báo cáo lâm nghiệp: "Influence of individual tree and stand attributes in stem straightness in Pinus pinaster Ait. stands" pps
Bạn đang xem bản rút gọn của tài liệu. Xem và tải ngay bản đầy đủ của tài liệu tại đây (322.24 KB, 8 trang )
141
Ann. For. Sci. 61 (2004) 141–148
© INRA, EDP Sciences, 2004
DOI: 10.1051/forest:2004005
Original article
Influence of individual tree and stand attributes in stem straightness
in Pinus pinaster Ait. stands
Miren DEL RÍO, Felipe BRAVO*, Valentín PANDO, Gemma SANZ, Rosario SIERRA DE GRADO
Dept. Producción Vegetal y Recursos Forestales, Universidad de Valladolid, Avda. de Madrid 57, Palencia 34004, Spain
(Received 14 June 2002; accepted 2 January 2003)
Abstract – The potential relationships between stem straightness and site, and both individual and stand attributes were studied in Pinus
pinaster Ait. stands. To this effect, 32 plots encompassing different densities and sites of varying quality were laid out in mature stands. In a
young stand, a completely randomised design with 9 plots was set up in order to compare three regeneration densities. During the study
numerous saplings were bent down by heavy snowfalls. Data analysis using multinomial logistic regression failed to show any relationship
between stem straightness and the attributes under study in mature stands. In young stands, however, stem straightness appeared to be influenced
by the height/diameter ratio as well as by the total height and the density of the stand at the time of the snowfalls. High density plots were
severely affected by snow and consistently contained the least satisfactory instances in terms of stem straightness.
stem straightness / Pinus pinaster / regeneration density / height-diameter ratio / snowfall
Résumé – Influence des caractéristiques des arbres individuels et des peuplements sur la rectitude du tronc dans les peuplements de
Pinus pinaster Ait. Le rapport entre la rectitude du tronc et les caractéristiques du site, des arbres individuels et des peuplements a été étudié
dans des peuplements de Pinus pinaster Ait. On a mesuré 32 parcelles dans des peuplements matures couvrant des sites de différentes densités
et qualités. On a établi tout à fait au hasard, dans un jeune peuplement, un modèle comprenant 9 parcelles dans le but de comparer trois densités
de régénération. Pendant cette étude, des chutes de neige ont plié un nombre élevé d’arbres dans les jeunes parcelles. L’utilisation de la
régression logistique polynomiale n’a pas permis d’établir de rapport dans les peuplements matures entre la rectitude du tronc et les
caractéristiques étudiées. Dans les peuplements jeunes, la rectitude du tronc a été influencée par le rapport hauteur/diamètre ainsi que par la
hauteur totale et la densité du peuplement après les chutes de neige. Les parcelles à densité élevée ont été davantage touchées par la neige et
montraient des troncs moins droits.
rectitude du tronc / Pinus pinaster / densité de régénération / rapport hauteur-diamètre / chutes de neige
1. INTRODUCTION
In management and genetic improvement of forests it is
important to consider such a major character as stem straight-
ness. Whenever large numbers of sinuous trees occur in a stand,
it is certain that the cost of harvesting and the revenues from
timber will be adversely affected. Moreover, stem curvatures,
usually associated with the presence of compression wood, will
surely diminish timber quality [2, 6, 21].
Stem malformation may be due to genetic, ecological and
silvicultural factors. The genetic control of stem straightness is
very variable. Different levels of heritability have been men-
tioned in reports dealing with a variety of species [8, 9, 26, 46].
Roussell [36], Yoshizawa et al. [48] and Sierra de Grado [37]
found that the susceptibility to deformation and the magnitude
and rate of the reaction producing compression wood differ
between species and even between families within species.
Timell [44] pointed to wind and snow as the most important
environmental factors causing stem deformations. Snow usually
generates crooked stems after bending down slender trees or
through the pressure exerted by snow creep. On the other hand,
the relationship between unidirectional wind and basal sweep
has been reported in several studies on different species [11, 33,
43]. The effects of snow and wind on stem straightness are often
heavier on steep slopes. Other ecological factors that can deter-
mine stem straightness include the frequencies of frosts, insect
attacks, fungal diseases or herbivore damage as when browsing
on the apical shoots of young trees. This kind of damages
induces lateral branch dominance that causes curvatures in the
bole [16, 24, 44]. Lateral incidence of light plays also an impor-
tant role in stem form [38]. This factor particularly affects inter-
mediate or suppressed trees and trees growing at the edge of a
stand.
Reactions to environmental factors vary according to the sil-
vicultural characteristics of the stand. Thus, snow and wind
deformation and damage depend on stand and individual
attributes, such as density and height/diameter ratio [32, 35].
High stand densities favour higher rates of straight stems [27],
* Corresponding author:
142 M. del Río et al.
although at the risk of increasing snow damages. Stand and tree
characteristics could be modified by thinning, improving stem
quality if an adequate selection is applied. Moreover, thinning is
in relation to the formation of compression wood, associated with
reorientation processes [5, 34, 44]. Root characteristics and
deformations are also reported as influenced factors in stem
straightness because of the relationships between root system
and tree stability in first ages, particularly in plantations [12,
23].
Pinus pinaster is the most extensive conifer in Spain, cov-
ering over 700 000 ha in pure stands and 600 000 hectares in
mixed stands, most of them in the Mediterranean area. The spe-
cies has a widespread natural distribution and it is often used
in reforestation. Twenty provenance regions of P. pinaster have
been defined in Spain [4]. Pinus pinaster shows a general ten-
dency for sinuosity in comparison with other Pinus species with
a more straight characteristic stem. However, there is a wide
variation between provenances, having some of them very
straight stems typically, and very crooked others. This charac-
teristic has been studied in provenance test trials and its stability
out the original environment has been demonstrated [3, 39].
Sierra de Oña provenance is characterised by the low quality
and sinuosity of their stems. This provenance usually presents
polycyclic growth and some fire adaptations: great production
of cones, serotinous cones and thick bark. After forest fires,
high-density regeneration stands are common. Sierra de Oña
provenance is isolated from other populations of this species.
Although there are information on silvicultural practices and
population structure of maritime pine in the Mediterranean
Spain [7, 18, 19, 28–31], references in the literature to stem
straightness in young and mature stands are scarce [38, 39]. On
the other hand, there are few studies that focus in the relation
between stand and tree variables and stem straightness [5, 22,
27, 44].
In this paper we study the possible influence of silvicultural
practices on the straightness of maritime pine trees from the
Sierra de Oña provenance. Should this influence be confirmed,
it would make possible an improvement in the quality of the
stems by applying the appropriate silvicultural treatments. The
aims of the present work are: (a) to find relationships between
stem straightness and environmental, stand and individual
attributes in different mature stands of this region; (b) to study
the effect of density in young growth stands on the stem
straightness.
2. MATERIALS AND METHODS
2.1. Study site
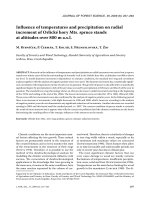
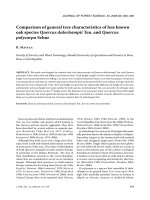
The study area is situated at 700–1000 m.a.s.l. in Sierra de Oña
provenance (northern Spain) covering 15 000 ha. Its climate shows
Mediterranean influences: an annual average rainfall is 528 mm; a
drought period of 2.46 months in summer and an annual mean tem-
perature of 10.8 ºC (Fig. 1). Soils are diverse: siliceous and limestone
and frequently sandy with a pH ranging from 6.2 to 8.9. Silvicultural
practice in this area is based on natural regeneration with a rotation of
100–125 years. Forest fires have a strong influence in stand dynamics
in the area. Stands have adapted to fires and, consequently, high den-
sities can be found in stands established after forest fires.
2.2. Sampling design and measurements
2.2.1. Mature stands
The sample includes 32 plots from a management-oriented inven-
tory developed by using a 170 m squared grid. Plots were circular with
radius equal to 11 m. In each plot exposure (sexasegimal degrees),
Figure 1. Walter-Lieth Climate Diagram and location map showing Oña area and its position in the Iberian Peninsula. The shadow area in the
map indicates the distribution of maritime pine in the Iberian Peninsula. Climate Diagram Legend: T: annual average temperature; P: annual
average rainfall; k: relative drought period/relative humid period ratio; a: period of relative drought in months.
Influence factors in stem straightness 143
slope (%) and altitude (m.a.s.l.) were recorded; climatic factors have
not been considered because of their low variability in this area. In
addition, the diameter at breast height (DBH) was measured in all trees
over 10 cm; in two dominant trees randomly chosen the total height
was also measured and in one tree per plot the total age was recorded.
With the raw data several variables such as basal area (BA) in squared
meters per hectare, number of trees per hectare (N), mean quadratic
diameter (Dg) in cm and dominant height (H
0
) in m were obtained.
Gonzalo and Sánchez [20] site curves were used to estimate site index
(SI). The 32 plots from the original data set were chosen to study the
stem straightness to cover the range of (BA) and dominant height of
maritime pine stands in Sierra de Oña. The main plot characteristics
are represented in Table I. In order to select representative trees in each
plot, the diameter distribution was divided in five parts and one tree
per class was chosen randomly. In these trees, basal diameter (DB) in
cm, total height (HT) in dm, age (A) and stem straightness class (SC)
were recorded (Tabs. II and III). The competition position of each tree
was represented by the ratio between the basal area in larger trees
(BAL) as is described by Wykoff et al. [47] and the basal area. This
ratio is equal to 0 in a full dominant tree and closer to 1 as the trees
became fully dominated. In order to describe stem form in mature
stands Galera et al. [15] proposed one classification for stem sinuosity
and another one for stem lean. In “Sierra de Oña” provenance stem
sinuosity in mature trees is very sharp, being an own character more
outstanding than stem lean. In this way, the stem straightness in mature
stands was determined by the stem sinuosity classification [15]:
SC1: Straight.
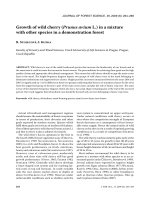
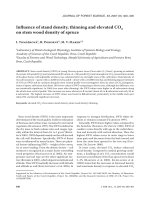
SC2: Light sinuosity. Curvature deflection (see Fig. 2) lower than
the breast diameter (DBH) in the top third of the stem.
SC3: Light sinuosity. Curvature deflection lower than DBH in the
middle or bottom part of the stem.
SC4: Middle sinuosity. Curvature deflection lower than DBH in
the middle and bottom part or in all stem.
SC5: High sinuosity. Curvature deflection between DBH and
2 × DBH.
SC6: Crooked. Curvature deflection larger than 2 × DBH.
Table I. Main characteristics of the 32 plots used to analyses the silvicultural effect on stem straightness in older stands.
SC SI Altitude (m) Slope (%) Exposure N BA Dg H
0
Mean 3.7 7.7 780 6.3 134.2 577 31.74 26.48 11.32
Minimum 3 6 544 0.5 2 316 8.60 18.61 7.35
Maximum 5 10 952 11.5 352 1421 67.23 36.83 15.50
Std. deviation 0.7 1.4 267.3 14.98 4.56 1.76
SC: stem straightness class according to Galera et al. (1997), SI: site index according to Gonzalo and Sánchez (1997), BA: basal area in squared meters
per ha, N: number of trees per ha, Dg: mean quadratic diameter in cm, H
0
: dominant height in m.
Table II. Main characteristics of the 160 trees used to analyses the
silvicultural effect on stem straightness in older stands.
SC DBH DB HT H/D A BAL/BA
Mean 3.68 23.09 28.57 9.67 34.43 50.5 0.76
Minimum 1.00 7.90 9.50 3.80 19.53 13.0 0.09
Maximum 6.00 45.50 52.30 20.50 55.04 90.0 0.99
Std. deviation 0.97 8.49 9.23 3.34 6.85 18.7 0.22
SC: stem straightness class according to Galera et al. (1997), DBH: dia-
meter at breast height in cm, DB: diameter at base in cm, HT: total height
in m, A: age, BAL: basal area in larger trees in squared meters per ha,
BA: basal area in squared meters per ha.
Figure 2. Scheme of the curvature deflection in a stem.
Table III. Mean and standard deviation of individual trees characteristics in mature stands per stem straightness classes.
SC DBH DB HT H/D A BAL/BA
1 28.80 (1.84) 34.35 (2.90) 9.40 (0.14) 27.48 (2.73) 60.5 (26.2) 0.63 (0.04)
2 28.77 (4.43) 33.86 (5.32) 10.66 (1.74) 31.19 (2.00) 55.8 (11.9) 0.72 (0.16)
3 22.95 (9.66) 28.44 (10.50) 9.91 (3.98) 35.21 (7.00) 48.7 (20.1) 0.76 (0.23)
4 22.17 (8.07) 27.75 (8.99) 9.56 (3.36) 34.99 (7.10) 50.6 (18.4) 0.75 (0.23)
5 24.03 (6.77) 29.38 (7.32) 9.13 (1.91) 31.88 (6.10) 50.8 (18.1) 0.79 (0.19)
6 21.37 (8.40) 26.65 (8.10) 9.02 (1.91) 35.28 (7.71) 55.0 (18.9) 0.82 (0.17)
SC: stem straightness class according to Galera et al. (1997), DBH: diameter at breast height in cm, DB: diameter at base in cm, HT: total height in m,
H/D: height-diameter ratio (adimensional), A: age, BAL: basal area in larger trees in squared meters per ha, BA: basal area in squared meters per ha.
144 M. del Río et al.
2.2.2. Young growth stand
Natural regeneration occurred in a young growth stand established
after a forest fire in summer 1991. In 2000 trees of the stand were
5–9 years old showing the followed temporal establishment pattern
after the fire: 3.5% of the trees the first year, 41.5% the second, 45%
the third and 10% the fourth year. Stand characteristic vary between
groups with densities of 9000–65000 stems per hectare, mean height
of 0.65–1.05 m and mean basal diameter of 13–21 mm.
In this stand 9 circular plots were chosen to represent different stand
density levels: low density (N < 15 000 trees/ha), middle density
(15 000 < N < 40 000 trees/ha) and high density (N > 40 000 trees/ha).
Plots have a radius of 2.5 m (19.6 m
2
) in order to include at least
20 trees in the low density plots. The resultant data set was analysed
according to a completely randomised design with 3 treatments. Total
height in cm (HT), basal diameter in mm (DB), age (A) and stem
straightness class (SSC) of all trees were recorded in each plot. Data
description is presented in Tables IV and V. The straightness classi-
fication proposed by Galera et al. [15] can not be applied in young
stands with heights lower than 1.3 m. According to Sierra de Grado
et al. [39], stem straightness in young stands was assessed using the
following subjective scale with three stem straightness classes (SSC):
SSC1: Straight. Curvature deflection lower than DB.
SSC2: Light sinuosity. Simple curvature and curvature deflection
larger than DB or leaning angle smaller than 45º.
SSC3: High sinuosity. Multiple curvature and curvature deflec-
tion larger than DB or leaning angle greater than 45º.
Measurements were taken twice: after the growth period in Novem-
ber 1999 and in November 2000. In April 2000 the straightness class
of all trees in each plot was recorded because of changes in stem form
due to snowfalls, which only affected to young stands.
2.3. Statistical methods
2.3.1. Mature stands
Multinomial logistic regression [1] was used to explore the influ-
ence of environmental attributes (altitude, slope and exposure), stand
attributes (N, BA, Dg, H
0
and SI), individual tree attributes (DBH, DB,
HT, A and BAL/BA) and upon the stem straightness. Multinomial
logistic regression has been used because the dependent variable is
polytomic. Its expression has the following structure:
where i varies between 1 and 5; p
i
and p
6
represent the probabilities
of being included in the stem straightness classes (SC) 1, 2 , 3, 4, 5
and 6 respectively (p
6
=1 – p
1
– p
2
– p
3
– p
4
– p
5
); and Z
i
are linear
functions combining the explanation variables. The analysis has also
been done grouping 1 and 2 classes and 5 and 6 classes in order to facil-
itate the detection of tendencies.
where i varies between 1 and 3; p
i
and p
4
represent the probabilities
of being included in the stem straightness classes (SC) 1–2, 3, 4 and
5–6 respectively (p
4
=1– p
1
– p
2
– p
3
). Three different explanation
functions were explored representing the environmental, stand and
individual tree attributes. The following functions were explored:
Environmental attributes as explanatory variables,
Stand attributes as explanatory variables,
Individual tree attributes as explanatory variables,
2.3.2. Young stand
In young growth stands the influence of height, basal diameter, age and
height-diameter ratio (H/D) on stem straightness was also analysed
Table IV. Main characteristics of individual trees in young growth stand.
HT1 DB1 A1 H/D1 HT2 DB2 A2 H/D2
Mean 84.24 17.44 6.4 55.46 95.73 21.60 7.4 50.48
Minimum 29.00 4.00 5.0 18.91 34.00 7.00 6.0 16.98
Maximum 148.00 54.00 8.0 146.67 189.00 96.00 9.0 112.50
Std. deviation 22.46 8.48 0.7 20.52 27.46 11.07 0.7 18.45
CV% 26.66 48.62 11.2 36.94 28.68 51.25 9.8 36.44
HT: total height in cm, DB: basal diameter in mm, A: age in years, H/D: height/diameter ratio (adimensional), 1: inventory of November 1999,
2: inventory of November 2000.
Table V. Mean and standard deviation of individual trees characteristics in young growth stand per stem straightness classes (SSC).
SSC HT1 DB1 A1 H/D1 HT2 DB2 A2 H/D2
1 85.55
(22.99)
17.49
(8.76)
6.4
(0.7)
56.93
(21.69)
87.81
(24.56)
20.52
(12.22)
7.3
(0.7)
50.39
(19.00)
2 80.57
(21.14)
17.02
(7.68)
6.4
(0.7)
52.61
(17.10)
97.53
(28.18)
21.84
(10.86)
7.4
(0.7)
50.40
(18.11)
3 84.33
(21.17)
18.18
(8.46)
6.5
(0.8)
52.28
(19.11)
96.85
(26.12)
21.80
(10.70)
7.40
(0.7)
50.89
(19.40)
HT: total height in cm, DB: basal diameter in mm, A: age in years, H/D: height/diameter ratio (adimensional), 1: inventory of November 1999,
2: inventory of November 2000.
p
i
p
6
Z
i
=ln
p
i
p
4
Z
i
=ln
Z
i
β
0i
β
1i
Altitude β
2i
Slope β
3i
Exposure.×+×+×+=
Z
i
β
0i
β
1i
N β
2i
BA β
3i
Dg β
4i
H
0
β
5i
SI×+×+ .×+×+×+=
Z
i
β
0i
β
1i
DBH β
2i
DB β
3i
HT β
4i
H/D×+×+×+×+=
β
5i
A β
6i
BAL/BA.×+×+
Influence factors in stem straightness 145
using multinomial logistic regressions. The expression of the model is:
where i varies between 1 and 3; p
i
and p
3
represent the probabilities
of being included in the stem straightness classes (SSC) 1, 2 and 3
respectively (p
3
= 1– p
1
– p
2
); In this case the factor density is included
in the model and the explanation function is:
where:
In order to determine the goodness of logistic models and the sig-
nificance of variables the –2log of likelihood and the Chi-square tests
were used in mature and young stands. The parameter estimates were
tested by the Wald’s test. The Chi-square test has been used in young
stand to study the independence of the stem straightness classes and
stand density after the snowfall in the spring measurement. All statis-
tical analyses have been done with SPSS Inc [42].
3. RESULTS
3.1. Environmental attributes
There was not evidence that stem straightness might be
influenced by environmental attributes. The value of –2 log of
likelihood was equal to 233 265 for the full model and equal
to 255 870 just for intercept. No significative relationship was
found between stem straightness classes and the different envi-
ronmental attributes explored (altitude, slope and exposure).
The significance of probability was always over 0.082.
3.2. Stand attributes
None of the studied stand attributes had a significative influ-
ence upon the stem straightness in maritime pine in Oña. The
value of –2 log of likelihood is equal to 222 547 for the full
model and equal to 255 870 just for intercept. No significative
relationship was found between stem straightness classes and
the different stand attributes explored (basal area, site index,
age, quadratic mean diameter and dominant height). The sig-
nificance of probability was always over 0.093.
3.3. Individual tree attributes
Similarly, none of the tree attributes had significative influ-
ence on stem straightness of the Pinus pinaster in the studied
area. The value of –2 log of likelihood is equal to 391 730 for
the full model and equal to 431 117 just for intercept. No sig-
nificant relationship was found between stem straightness
classes and the different individual tree attributes explored
(basal diameter, diameter at breast height, total height and com-
petition position). The significance of probability was always
over 0.167.
After grouping data in four straightness classes results are
similar for the three explanations functions, no finding any sig-
nificant variable.
3.4. Young growth stand
Multinomial logistic regression showed that only the varia-
ble H/D ratio of the tree was significant in the first inventory
(Tab. VI). However, Wald’s χ
2
test showed that β
41
and β
42
are
not significatively different from zero. It means that H/D var-
iations did not produce significant changes in the ratios
p
1
/p
3
and p
2
/p
3
. In Table V can be seen that there are not a clear rela-
tionships between H/D and SSC in the first inventory.
In the second inventory (November 2000) there were statis-
tical differences in stem straightness between stand densities.
The covariables HT and H/D ratio were also significatives
(Tab. VII). Wald’s χ
2
test indicated that β
11
and β
41
are statis-
tically different from zero, with a χ
2
of Wald value of 5.043
(P = 0.025) and 4.679 (P = 0.031) respectively. The odds ratio
p
1
/p
3
decreases 2.4% when height increases one unit
(exp(β
1
) = 0.976) and increases 3.5% when H/D ratio of trees
grows one unit (exp(β
4
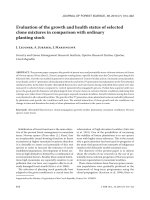
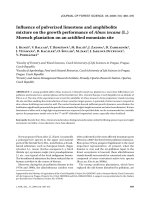
) = 1.035). In Figure 3 the relationships
between height, H/D ratio and diameter are presented, showing
that the highest H/D ratios correspond with trees of low total
heights and basal diameter.
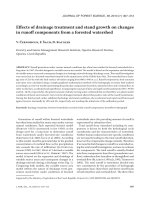
The first measurement yielded no statistical differences
between densities on the frequencies of straightness classes.
The greatest percentage corresponded to the best straightness
class (SSC1) with a mean value of 65.3%, followed by SSC2
Table VI. Multinomial logistic regression in the first inventory of
young growth stand (November 1999).
Source of variation –2log likelihood Chi-square DF P
Intersección 924 633 . . .
HT 924 936 0.303 2 0.860
DB 929 010 4.377 2 0.112
A 925 046 0.413 2 0.813
H/D 933 736 9.103 2 0.011
DENSITY 926 374 1.741 4 0.783
HT: total height in cm, DB: basal diameter in mm, A: age in years, H/D:
height/diameter ratio (adimensional).
p
i
p
3
Z
i
=ln
Z
i
β
0i
β
1i
HT β
2i
DB β
3i
A β
4i
H/D +×+×+×+×+=
β
5i
Density1 β
6i
Density2×+×
Density1, Density2()
1,0() if High Density
0,1() if Midle Density
0,0() if Low Density.
=
Table VII. Multinomial logistic regression in the second inventory
of young growth stand (November 2000).
Source of variation –2log likelihood Chi-square DF P
Intersección 921 869 . . .
HT 932 194 10.325 2 0.006
DB 924 094 2.224 2 0.329
A 924 648 2.779 2 0.249
H/D 930 236 8.367 2 0.015
DENSITY 968 533 46.664 4 0.000
HT: total height in cm, DB: basal diameter in mm, A: age in years, H/D:
height/diameter ratio (adimensional).
146 M. del Río et al.
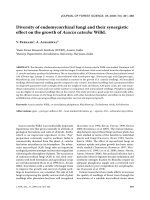
(24.1%) and SSC3 (10.6%) (Fig. 3). The proportions vary in
spring after the heavy winter snowfalls. At this point in time,
there were statistical differences between densities, with a Chi
square of 63.18607. The variation was light in the low density,
with the same percentage of trees in SSC3. The percentage in
the SSC1 decreased when the stand density increased, with a
values of 48.2% in the low density, 26.6% in middle density
and 9.1% in the highest. In the same way, the percentage of trees
of the worst straightness class rose with the stand density.
Finally, after the growth period (November of 2000) the pro-
portions varied again keeping up the statistical differences
(Chi-square of 41.303). The low density showed a worse situ-
ation than in spring, with more trees in SSC2 and fewer in
SSC1, but still maintaining the highest percentage of trees in
SSC1. This density showed the same percentage in SSC3 in the
three measurements (Fig. 3a). For the middle and high densities
the situation was somewhat improved in the last inventory,
since some trees passed from SSC3 to SSC2 while SSC1
remained unchanged (Figs. 3b and 3c).
4. DISCUSSION
Pinus pinaster stands exhibit high rates of stem deformation
that vary depending on the populations. Sierra de Oña prove-
nance in Spain presents some of the worst instances of stem
deformation with mean straightness values ranging between
SC3 and SC5 (Tab. I). All environmental factors traditionally
reported in the literature as causal agents of stem curvatures
(wind, snow, and soil creeping) [33–45] could be related to the
three site attributes analysed in the present study. However, a
problem of spatial scale can obstruct the analysis of this result
and no relationship between stem straightness and altitude,
slope or exposure of the sites could be found. It may very well
have been the case that the site variability in the study area was
not broad enough for this type of relationship to become appar-
ent. In the case of slopes the maximum value was only 11.5%
(Tab. I) and that seems too low to illustrate the relationship
between the steep slopes and basal stem crook corroborated by
many authors [44].
In the mature maritime pine stands under study there is no
statistically significant relationship between stem straightness
and tree and stand attributes. This absence of relation can be
due to the low variability of stands characteristics (Tab. I) as a
consequence of the similar management in this area. Neverthe-
less, the treatments applied do not seem to have modified the
stem straightness of trees and there are still a lot of trees with
high SC. If the impact of silvicultural and environmental factors
on stem development may be discounted, it seems that the main
factor influencing in stem straightness should be sought in the
genetic effect.
However, results from regeneration plots suggest that the
first stages in stand development can subsequently condition
stem form. The importance of the young stages in maritime pine
has been reported by Sierra de Grado et al. [39], who found the
worst straightness values in the bottom third of the stems,
reflecting important deformations in youth. Crisan [10] obtained
similar results comparing verticality above and under the height
of 2.5 m in the same species.
Stem straightness in the studied young plots is influenced by
H/D ratio, height and stand density. An increase in H/D ratio
of a tree determines that the probability it will belong to the best
straightness class is fairly strong. A positive relationship between
H/D ratio and stem straightness in young trees has also been
found in a provenances trial of P. pinaster in Spain [17]. On
the other hand, the results of the last measurement after the
snowfall show that taller trees are unlikely to belong to the best
straightness class (SSC1). These results can be explained by the
distribution of H/D ratio and total height by diameter, which
indicates that the largest H/D correspond to the smallest trees
(Fig. 4). The influence of H/D ratio and height on stem straight-
ness ca be due to the higher flexibility of young trees which
facilitates active straightening up [5, 13, 14]. Leaphart et al. [22]
Figure 3. Evolution of percentages of trees, per stem
straightness class, in different densities in young
growth stands. (N-99, November 1999; Ap-00, April
2000; N-00, November 2000; SC, Stem straightness
class).
Figure 4. Height-diameter and H/D ratio-diameter relationships in
young growth stand in November 2000. HT = total height in cm, DB =
basal diameter in mm, H/D = height/diameter ratio (adimensional).
Influence factors in stem straightness 147
reported a similar result in a mixed stand with six conifer spe-
cies located on a steep slope exposed to heavy snowfalls, find-
ing a larger percentage of stem deformities with increasing
height classes (from 0.3 to 3.2 m). Carlsson (1948, in [44])
reported in Picea abies L. that the recovery of bent trees was
faster in vigorous than in dominated trees, that usually have
higher heights. However our young stand is still very young and
the social differentiation has not clearly started. In this way it
could be interesting to study the relationship between stem
straightness and tree and stand attributes when the competition
begins to be important.
Straightness of maritime pine seedlings and saplings was
influenced by stand density only after the heavy snowfalls of
the winter 1999–2000, when many trees were bent down by
snow. The rate of bent trees was greater in the high-density plots
(Fig. 4). In a study with saplings of Pinus virginiana Fenton
(1959, in [44]) found also more damage in dense stand and in
larger saplings (6–15 years old) than in smaller (3–6 years old).
Trees bent down by snow began to recover the vertical position
during the growth period, some trees being upgraded from
SSC3 to SSC2 (Fig. 4). The reaction of trees is similar to that
observed by Schmidt [41] in bent Larix occidentalis trees
whose recovery starts in stem apex. As the leader grow verti-
cally during the recovery of the leaned stem, permanent crooks
and curvatures can be formed in stems. The response to the
stimulus of inclination to recover the vertical position is differ-
ent among species [48]. In experiments with P. pinaster with
artificially bent stems very rapid reorientation of the apical por-
tion of the stem have been found to reduce the leaning [14, 25].
On the other hand, a preliminary work of the straightening abil-
ities in P. pinaster in different populations demonstrates that
Sierra de Oña provenance reacts more slowly than a mountain
provenance [40], which presents straighter stems in natural
stands indicating an adaptation to snowfalls [3, 39].
According to these results high densities should be avoided
in young stands in order to improve the stem form of trees in
provenances with frequent crooked stems. Actually, in Sierra
de Oña where the species shows signs of adaptation to regular
fires (serotinous cones), high densities of seedlings are very fre-
quent in P. pinaster stands after forest fires [43]. Although
heavy snowfalls are no very usual in this provenance, cleanings
or pre-commercial thinning are needed to reduce the risk of
snow damages in high density stands and to eliminate as soon
as possible trees with unacceptable stem forms.
In order to confirm this possible effect of the regeneration
density and snowfalls in young ages on the straightness of trees
in mature stands of maritime pine, it would be necessary to con-
tinue the experiment to monitor the development of the bending
trees in the future.
Acknowledgements: The Comisión Interministerial de Ciencia y
Tecnología (CICYT) funded this work through the project AGF97-
0809. The authors are grateful to Alfonso Centeno for his corrects on
the manuscript and to Borja González and Servicio territorial de
Burgos for his help in data collection.
REFERENCES
[1] Agresti A., Categorical Data Analysis, Wiley Interscience, 1990.
[2] Aldohus J.R., Quality of softwood timber-market prices and reve-
nue expectation, Q. J. For. 80 (1986) 233–240.
[3] Alía R., Gil L., Pardos J.A., Performance of 43 Pinus pinaster pro-
venances on 5 locations in Central Spain, Silvae Genet. 44 (1995)
75–81.
[4] Alía R., Martín R., De Miguel J., Galera R.M., Agúndez D., Gordo
J., Salvador L., Catalán G., Gil L.A., Regiones de procedencia,
Pinus pinaster Ait., DGCONA, Madrid, 1996.
[5] Ancelin P., Modélisation du comportement biomécanique de
l’arbre dans son environnement forestier. Application au pin mari-
time, Ph.D. thesis, Université de Bordeaux, Bordeaux, 2001.
[6] Bailleres H., Conséquences du bois juvénile et du bois de compres-
sion sur la stabilité dimensionnelle des contreplaques de pin mari-
time, in: Thibaut B. (Ed.), Proceedings of the Third Seminar
“Architecture, Structure, Mécanique de l’arbre”, LMGC, Univer-
sity of Montpellier II, Montpellier, 1991.
[7] Bravo F., Guerra B., Forest structure and diameter growth in Mari-
time pine in a Mediterranean area, in: von Gadow K., Saborowski
J. (Eds.), IUFRO Conference on continuous cover forestry, Göttin-
gen, 2001, pp. 101–110.
[8] Conche I., Déterminisme génétique de l’anisotropie et de certains
caractères de forme chez le pin maritime, Mémoire de stage de fin
d’études, INRA-FOREST, IUT de Tours, 1978.
[9] Cotterill P.P., Dean C.A., Van Wye G., Additive and dominance
genetic effects in Pinus pinaster, P. radiata and P. elliottii and
some implications for breeding strategy, Silvae Genet. 36 (1987)
221–232.
[10] Crisan P.A., Déterminisme génétique de la forme de pin maritime,
Corrélations avec la vigueur et le rythme de croissance, Mémoire de
stage de fin d’études, INRA-Cestas, 1977.
[11] Davies E.J.M., Unseless? The case against contorta, Scot. For. 34
(1980) 110–113.
[12] Danjon F., Bert D., Godin C., Trichet P., Structural root architec-
ture of 5-year-old Pinus pinaster measured by 3D digitising and
analysed with AMAPmod, Plant Soil 217 (1999) 49–62.
[13] Fourcaud T., Blaise F., Lac P., Castéra P., de Reffye P., Numerical
modelling of shape regulation adn growth stresses in trees. II.
Implementation in the AMAPpara software and simulation of tree
growth, Trees 17 (2003) 31–39.
[14] Fournier M., Bailleres H., Chanson B., Tree biomechanics: growth,
cumulative prestresses and reorientations, Biomimetics 2 (1994)
229–252.
[15] Galera R.M., Martín S., Alía R., Gordo J., Aguado A., Notivol E.,
Manual de selección de masas productoras de semillas, Evaluación
de caracteres, Monografías INIA 97, Madrid, 1997.
[16] Gong Y.L., Swaine M.D., Miller H.G., Effects of Fencing and
Ground Preparation on Natural Regeneration of Native Pinewood
over 12 years in Glen Tanar, Aberdeenshire, Forestry 64 (1991)
157–168.
[17] González A., Evaluación de una parcela de ensayo de procedencias
de Pinus pinaster Ait., T.M. La Pedraja de Portillo (Valladolid),
Proyecto Fin de Carrera de Ingeniería de Montes, Universidad de
Valladolid, Palencia, 1999.
[18] González-Martínez S.C., Gerber S., Cervera M.T., Martínez Zapater
J.M., Gil L., Alía R., Detecting reliable parent-offspring matches in
parentage analysis: a case study, in: Degen B. (Ed.), Modelling and
experimental research on genetic processes in tropical and tempe-
rate forests, Belén, 2002, pp. 159–164.
[19] González-Martínez S.C., Salvador L., Agúndez D., Alía R., Gil L.,
Geographical variation of gene diversity of Pinus pinaster Ait. in
the Iberian Peninsula, in: Müller-Starck G., Schubert R. (Eds.),
Genetic response of forest systems to changing environmental con-
ditions, Kluwer Academic Press, Dordrecht, 2001, pp. 161–171.
[20]Gonzalo J., Sánchez P., Análisis de calidad de estación en dos
regiones de procedencias de Pinus pinaster Ait.: Oña (Burgos) y
Sierra del Teleno (León), in: Puertas F., Rivas M. (Eds.), Procee-
dings of I Congreso Hispano-Luso (mesa IV), Pamplona, 1997,
pp. 315–320.
[21] Laguardia A., The behaviour of Pinus caribaea var. hondurensis in
Misiones, Suppl. For. 4 (1967) 53–58.
148 M. del Río et al.
[22] Leaphart C.D., Hungerford R.D., Johnson H.E., Stem deformities
in young trees caused by snowpack and its movement, U.S. For.
Serv. Res. Notes INT 158, 1972, pp. 10.
[23] Lindstrom A., Rune G., Root deformation in plantations of contai-
ner-grown Scots pine trees: effects on root growth, tree stability and
stem straightness, Plant Soil 217 (1999) 29–37.
[24] Loup C., Le développement architectural du pin maritime, in:
Thibaut B. (Ed.), Proceedings of the Second Seminar “Architec-
ture, Structure, Mécanique de l’arbre”, LMGC, University of Mont-
pellier II, Montpellier, 1990.
[25] Loup C., Fournier M., Chanson B., Moulia B., Redressements, con-
traintes de croissance et bois de réaction dans le bois d’un jeune
Pinus pinaster artificiellement incline, in: Thibaut B. (Ed.), Procee-
dings of the Third Seminar “Architecture, Structure, Mécanique de
l’arbre”, LMGC, University of Montpellier II, Montpellier, 1991.
[26] Magini E., The heritability of the stem form in Pinus pinaster,
FAO-FTB 3/8, 1969.
[27] Malinuaskas A., The influence of the initial density and site condi-
tions on Scots pines growth and wood quality, Baltic For. 5 (1999)
8–19.
[28] Montero G., Ortega C., Cañellas I., Bachiller A., Productividad
aérea y dinámica de nutrientes en una población de Pinus pinaster
Ait. sometida a distintos regímenes de claras, Investigación Agra-
ria: Sistemas y Recursos Forestales FS 1 (1999) 175–206.
[29] Nanos N., Montero G., Spatial prediction of diameter distribution
models, For. Ecol. Manage. 161 (2002) 147–158.
[30] Nanos N., Tadesse W., Montero G., Gil L., Alía R., Modelling resin
productions for Pinus pinaster Ait. using two probability functions,
Ann. For. Sci. 57 (2000) 369–377.
[31] Nanos N., Tadesse W., Montero G., Gil L., Alía R., Spatial stochas-
tic modeling of resin yield from pine stands, Can. J. For. Res. 31
(2001) 1140–1147.
[32] Petty J.A., Worrell R., Stability of coniferous tree stems in relation
to damage by snow, Forestry 54 (1981) 115–127.
[33] Polge H., Illy G., Observations sur l’anisotropie du pin maritime
des Landes, Ann. Sci. For. 24 (1967) 205–231.
[34] Radi M., Catera P., Qualification de la forme de deux pins mariti-
mes en liason avec la structure de leur bois, Ann. Sci. For. 49 (1992)
185–200.
[35] Rottmann M., Waldbauliche Konsequenzen aus Schneebruchkatas-
trophen, Schweiz Z. Forstwes. 136 (1985) 167–184.
[36] Roussel L., Le phototropisme juvénile des résineux, Rev. For. Fr.
11 (1966) 708–717.
[37] Sierra de Grado R., Mejora genética de Pinus pinaster Ait. de la
procedencia Sierra de Gredos. Caracteres de crecimiento y forma,
Ph.D. thesis, Universidad Politécnica de Madrid, Madrid, 1994.
[38] Sierra de Grado R., Moulina B., Fournier M., Alía R., Díez-Barra
R., Genetic control of stem form in Pinus pinaster Ait. seedlings
exposed to lateral light, Tress 11 (1997) 455–461.
[39] Sierra de Grado R., Díez-Barra R., Alía R., Evaluación de la recti-
tud del fuste en seis procedencias de Pinus pinaster Ait., Investig.
Agrar., Sist. Recur. For. 8 (1999) 263–278.
[40] Sierra de Grado R., Martínez-Zurimendi P., Pando V., Straighte-
ning abilities in Pinus pinaster Ait.: variability between popula-
tions, in: Spatz H.C., Speck T. (Eds.), Proceedings of the third Plant
Biomechanics Conference “Plant Biomechanics 2000”, Thieme,
Freiburg-Badenweiler, 2000, pp. 463–467.
[41] Schmidt W.C., Stand density in relation to biological functions in
young Western larch forests, in: Bamsey C., Lake C. (Eds.), Stand
density management: planting and implementation, Edmonton
(Alberta), 1997, pp. 101–111.
[42] SSPS Inc., SPSS for Windows, Version 9.01 (1989–1999).
[43] Tapia R., Gil L., Pardos J.A., Los pinares (Pinus pinaster Ait.) de
las estribaciones de la Sierra del Teleno (León), La influencia del
incendio en su ordenación, Montes 52 (1998) 115–121.
[44] Timell T.E., Compression Wood in Gymnosperms, Springer-Ver-
lag, Berlin, 1986.
[45] Valinger E., Lundquist L., Sunberg B., Mechanical bending stress
applied during dormancy and growth stimulates stem diameter
growth of Scots pine seedlings, Can. J. For. Res., 25 (1995) 886–
890.
[46] Williams C.G., Lambeth C.C., Bole straightness measurement for
advanced-generation loblolly pine genetic test, Silvae Genet. 38
(1989) 212–217.
[47] Wykoff W.R., Crookston N.L., Stage A.R., User’s guide to the
stand prognosis model, USDA Forest Service, Intermountain
Forest and Range Experiment Station, Ogden, Utah., General Tech-
nical Report INT 133, 1982, p. 122.
[48] Yoshizawa N., Okamoto Y., Idei T., Righting movement and xylem
development in tilted young conifers trees, Wood Fiber Sci. 18
(1986) 579–589.
To access this journal online:
www.edpsciences.org