Assessing the Impact of Transport and Energy Infrastructure on Poverty Reduction - Chapter 5 pdf
Bạn đang xem bản rút gọn của tài liệu. Xem và tải ngay bản đầy đủ của tài liệu tại đây (1.24 MB, 46 trang )
Peoples Republic of China Country Study 45
National Context
T
he PRC is the most populous nation in the world,
with about 1.25 billion people, representing al-
most half of all people served by ADB and more
than one fifth of all people in the world. The PRC has
exhibited remarkable economic growth and success in
poverty reduction since the 1980s. Its gross national in-
come per capita was estimated at $890 in 2001, equivalent
to $4,260 in 1993 purchasing power parity terms.
9
On the
average, the PRC is densely populated, with 136 persons
per square kilometer (km
2
). However, population density
varies considerably from the urbanized and industrially
developed coastal areas to the remote provinces of the
west. PRC social indicators are generally good, with an
average life expectancy of 70 and an adult illiteracy rate of
16%.
The PRC has experienced explosive economic growth,
with an average annual growth rate of 10% between 1990
and 2001. The benefits of this growth have been fairly
widespread, although there is a distinct gradient of devel-
opment from the eastern coastal areas through the central
provinces to the relatively underdeveloped western part of
the country. In the past, inadequate infrastructure has been
a major barrier to growth and to the diffusion of its ben-
efits to all parts of the country. Since the PRC undertook
market-oriented reforms and opened its economy to
international trade, the Government has invested heavily
in infrastructure development, with strong support from
the development finance community. As incomes
increased, so did social inequity; the country had a Gini
index of 40 in 2001. The Governments poverty reduction
programs seek to combat this problem.
Poverty Reduction
When the PRC was established in 1949, poverty was
endemic in the country. Equitable distribution of wealth was
central to its ideology and command economy. Economic
reforms begun in 1978 aimed to transform the PRC into a
socialist market economy with Chinese characteristics.
These reforms altered the profile of poverty by
enabling the majority of the rural poor to advance, while
leaving some behind. Poverty was largely (officially) con-
fined to rural areas by the policy of household registration,
which did not permit rural-urban migration. Unofficial mi-
grants to the cities were thus not eligible to benefit from
urban services. However, the rapid expansion of employ-
ment opportunities in the coastal provinces and in cities
encouraged a steady stream of rural-urban migrants.
While this process has undoubtedly contributed to economic
growth and efficient resource allocation, it has also resulted
in the beginnings of urban poverty.
Official reports estimate that rural poverty declined
from about 10% of the rural population in 1990 to 3.4%
in 2000, or about 30 million people. In 2000, the official
poverty line in the PRC was 625 yuan annual per capita
income, equivalent to about $75.
10
This line is determined
by first targeting the Governments resources for poverty
reduction to the poorest, and then setting the poverty line
at the limit of population that can be served with avail-
able resources. It is notably lower than the international
extreme poverty line of $1 per day ($365 per year).
Using the international standard, the World Bank also
noted a sharp decline between 1990 and 1998 in extreme
poverty, from 31.3% to 11.5% of the rural population
(World Bank 2001b). According to this standard, more
than 100 million people in the PRC were still living in
extreme poverty in 1998. The remaining rural poverty is
Chapter 5
PEOPLES REPUBLIC OF CHINA
COUNTRY STUDY
9
All figures in this paragraph are taken from the World Development
Indicators annexed to the 2003 World Development Report (World Bank
2003a).
10
This line was originally set at about two thirds of the international $1-a-
day poverty line expressed in 1993 purchasing power parity terms. Its
domestic purchasing power may not be adequately represented by its dollar
equivalent today.
46 Assessing the Impact of Transport and Energy Infrastructure on Poverty Reduction
increasingly concentrated in the countrys western prov-
inces, mostly within remote and mountainous townships.
Because of access problems, these areas are also relatively
deprived in food security and health care and education
services. This suggests an approach to poverty reduction
based on geographical targeting. In addition, minority
peoples and the disabled are disproportionately represented
among the rural poor.
Until recently, the PRCs poverty reduction strategy
targeted poor counties, although half of the poor reside in
counties other than those designated as poor. Poor counties
are mainly located in the western part of the country, in
hilly or mountainous terrain with relatively poor soils and
rainfall, where the task of increasing agricultural produc-
tivity has proved most difficult. Deforestation and soil ero-
sion due to population pressure on the natural resource base
often complicate the task. Within these counties, assistance
intended for the poor showed substantial leakage to
nonpoor residents. Today, the PRCs poverty reduction
strategy targets poor townships and aims to improve the
financial monitoring and supervision of poverty programs.
Participatory programs focusing on improving upland
agriculture and better targeting it to market opportunities
will enhance the productivity of the poor. The strategy
also stresses the need to provide improved road access and
other basic infrastructure, so as to deliver needed services
to the remaining rural poor at a reasonable cost.
A study conducted for ADB in 2002 by the National
Rural Social and Economic Survey Team, to help deter-
mine the definition of poverty to be used in ADBs Pov-
erty Partnership Agreement with the PRC, found that the
annual income level corresponding to a minimum con-
sumption of 2,100 calories per day, plus an allowance of
60% for nonfood consumption, would be approximately
1,300 yuan ($160). Using the corresponding consump-
tion expenditure of 860 yuan (excluding productive
investments and debt service), and based on data from the
2000 Rural Household Survey sample, the study estimated
a current national poverty rate of 23.2% of the rural popu-
lation, or about 215 million people. Clearly, by any stan-
dard, a great deal of poverty still exists in the PRC. In
addition, many of those who are not officially poor have
only recently emerged from poverty and are vulnerable to
various risks.
The PRCs approach to poverty started with income
transfer programs. However, it soon became apparent that
redistribution of national resources would not be adequate
to meet the needs of the poor. It would be necessary for the
poor to engage in self-help, initially through the construc-
tion of public works, mainly roads and water supply sys-
tems (Zhu and Jiang 1996). To that end, 331 poor coun-
ties were identified and targeted for national support.
Another 368 poor counties were identified in each prov-
ince to receive assistance through the provincial govern-
ments. Local and county governments were expected to
assist poor communities located outside the designated
poor counties. In addition to grants to communities for
public works, funds were made available through loans
for communities to undertake productive projects on their
own initiative. The goal was to stimulate the creation of
sustainable employment opportunities in rural areas for
the poor. Lessons learned from the implementation of this
approach pointed to the need to make complementary
investments in health care and education in the poorest areas,
focus on food security for the poor as the primary goal of
poverty reduction, and involve the poor themselves more fully
in program planning and implementation.
An empirical investigation of the determinants of con-
sumption growth for farm households in the PRC used
panel data on the southern PRC from the Rural House-
hold Survey over 19851990 to show that geographical
location makes a difference (Jalan and Ravallion 2002).
The study found that living in a poor area lowers the pro-
ductivity of a farm households own investments, in turn
reducing the growth of household consumption. The
aspects of geographic capital that affect consumption
growth include both privately and publicly provided goods
and services, such as rural infrastructure and associated
services. This research strengthens the case for expanding
public investment in poor areas, on grounds of equity and
efficiency.
A study to evaluate the effects of public expenditures
in different sectors on rural productivity and poverty
reduction was carried out for the PRC by researchers based
at IFPRI (Fan, Zhang, and Zhang 2000). This study used
an econometric model similar to one that had been used
in India (see Chapter 7) and was subsequently used in
Thailand (see Chapter 6). However, the specifications of
the model were slightly different in the PRC. Community
development, health care, and soil conservation expendi-
tures were not included in the PRC model, but telecom-
munications expenditures were included. The study
showed that education expenditures had the greatest
impact on poverty reduction in the PRC, followed by
rural telephones, agricultural R&D, and then roads and
electricity, having approximately equal effects. For agri-
cultural productivity, R&D was most important, followed
by education and rural telephones, with roads and elec-
tricity again in fourth and fifth places. Irrigation invest-
ments had a positive impact on agricultural growth, but
Peoples Republic of China Country Study 47
little effect on poverty. The main conclusion drawn from
this study was that all the types of investments considered
have positive consequences, both for growth and for pov-
erty reduction; thus, all are win-win strategies. The pov-
erty reduction effects of infrastructure investments (tele-
communications, roads, and power) came about mainly
through increased nonfarm employment and improved
wages in the agriculture sector.
ADB has undertaken numerous technical assistance
(TA) activities to assist the PRC Government in formu-
lating poverty-focused policies and programs, especially
in the infrastructure sectors. It has supported participa-
tory rural and urban poverty assessments through TA 5894-
REG, Facilitating Capacity Building and Participatory
Activities II (ADB 2000d), together with an urban pov-
erty study (TA 3377-PRC, Urban Poverty Study [ADB
2002b]). It has also provided support to help develop a
methodology for county-level poverty reduction planning
(TA 3610-PRC, Preparing a Methodology for Develop-
ment Planning in Poverty Blocks under the New Poverty
Strategy of the PRC [ADB 2001e]). Other TA projects
carried out for transport and energy are discussed below
under the sectors concerned.
Transport Sector Policy
The PRC Government has been investing heavily in
infrastructure development to promote and support the
high rates of growth already achieved. Annual investment
in the transport sector more than doubled between 1990
and 2000, from 12.38 billion yuan ($1.5 billion) to 27.12
billion yuan ($3.5 billion). During this period, the length
of highways increased from 1.0 to 1.4 million km, while
the length of railways increased from 53,400 km to 58,650
km. The volume of passenger and freight traffic grew dra-
matically as well. Passenger traffic increased from 563
billion passenger-km per year in 1990 to 1,226 billion
passenger-km in 2000, while freight traffic grew from
26,200 billion ton-km in 1990 to 44,450 billion ton-km
in 2000. An increasing share of both passenger and freight
traffic takes place on the nations highways. Roads ac-
counted for 91% of all passengers and 76% of freight ton-
nage transported in 2000.
Major policies in the transport sector concern the fi-
nancing of infrastructure construction and
operation and sector and enterprise manage-
ment, as well as promoting regional devel-
opment. Planning for transport development
is the responsibility of different levels of gov-
ernment. In some cases, financial support for
investment is provided by the international
development community and the private sec-
tor. Among the targets established in the
Tenth Five-Year Plan (20012005) are to
improve the main railway network, espe-
cially in the western regions;
construct the Tibet railway and Beijing-
Shanghai high-speed railway;
extend the length of the rail network to
75,000 km by 2005;
accelerate the construction of the national
trunk highway network;
support construction of eight highways in the western
regions; and
extend the length of the highway network to 1.6 mil-
lion km by 2005, including 25,000 km of expressways.
Transport investment is an important component of
the PRCs overall development policy, focused on the west-
ern region. Existing roads and highways in the region are
to be upgraded under the Tenth Plan.
Since 1984, the PRC has implemented food for work
programs to assist poor areas in improving their transport
infrastructure. In the Ninth Five-Year Plan period (1995
2000), funds invested in road construction through the
food for work program amounted to 9 billion yuan ($1.1
billion), supporting the construction of over 100,000 km
of roads in poor areas. This represented about 80% of all
rural roads constructed during this period. With increas-
ing investment, the accessibility of poor farmers has
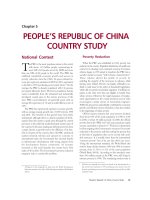
This PRC family proudly shows off its transport: part motorcycle and
part two-wheeled trailer.
48 Assessing the Impact of Transport and Energy Infrastructure on Poverty Reduction
improved significantly. Official statistics show that nearly
92% of villages in poor counties had gained access to
motorable roads by 2000. This may overstate the actual
access provided to poor farmers. Administrative villages
may include several settlements, and a village is
defined as accessible to motorized transport if any one
settlement in the village has been connected to a motorable
road. However, about 700 townships and 44,000 adminis-
trative villages were still not connected by motorable roads
in 2000, mostly in the western provinces. The Govern-
ment has placed a priority on completing motorable road
access to all these townships and villages by 2010.
The Ministry of Communications and Ministry of
Railways are responsible for planning and managing the
national road and rail networks, respectively, in associa-
tion with other relevant central government agencies. They
consult with the provincial governments on the location
of national road and rail links. The provincial road and
rail agencies plan and manage the networks at the provin-
cial level, in association with other relevant provincial
agencies. These plans must be approved at the central level
by the relevant ministry and the State Development Plan-
ning Commission.
Local railways are constructed and operated by local
authorities or private investors. Roads are also managed
by different levels of government. County and township
roads are normally planned and constructed by county
authorities. Village roads may be planned and constructed
by the county roads department, by various poverty reduc-
tion programs, or by villagers themselves. Local road con-
struction is mainly funded by local governments, with
some support from the central Government for road con-
struction in minority, remote, and poor areas. County road
agencies can collect special road construction taxes and
vehicle sales taxes to finance road improvements. They
can also issue local bonds and shares to mobilize resources
from the private sector.
Recent developments in transport sector policy reflect
the Governments increasing emphasis on decentraliza-
tion and institutional reform. Although more responsi-
bilities have been shifted to the provincial, county, and
municipal governments, the numbers of staff at all levels
have been sharply decreased. Some functional units may
be transformed into private enterprises, such as road con-
struction and maintenance teams. Remaining bureaus and
institutes may be corporatized. Road maintenance funds,
previously collected from vehicle owners as a property
tax, will now be derived from fuel taxes to more closely
reflect real use of the highway system.
ADB, together with the World Bank and the JBIC, has
been a strong supporter of the PRCs transport invest-
ment program. ADB has provided a great deal of TA in
transport policy and planning, traffic management, road
safety, project preparation, and environmental assessment.
International development partner support initially con-
centrated on increasing economic efficiency by removing
bottlenecks and expanding capacity through highways, rail-
way, and port construction. However, development part-
ners have gradually integrated poverty reduction concerns
into the design of their projects, often by adding feeder
road components. ADB recently assisted the Government
in developing an analytic framework for the socioeco-
nomic assessment of road projects, including ex ante as-
sessment of the flow of benefits from expressway projects
to the poor (TA 3900-PRC, Socioeconomic Assessment
of Roads Projects [ADB 2004b]). The PRCs Institute
of Comprehensive Transport implemented the study in
collaboration with IFPRI. The study proposed a modi-
fied form of the IFPRI model, using more disaggregated
measures of road and other infrastructure inputs, and with
urban growth and urban poverty reduction, as well as
rural growth and rural poverty reduction, as outcome vari-
ables.
At present, rural road improvements are being carried
out in five provinces of the PRC with World Bank support
through the RIPA program, which is linked to ongoing
poverty reduction programs in the five provinces. It aims
at providing basic access to communities that are not con-
nected to the road network. Roads are selected through a
ranking procedure involving both economic criteria
(including direct measures of poverty) and social criteria
(Hajj and Pendakur 2000). Basic access is defined as the
least-cost improvement required to allow year-round
access by motor vehicles, suitable for use by the prevailing
vehicles in the area (motorized and nonmotorized), and
allowing for occasional (but not seasonal) interruptions
of service. The options include (i) partial access, for
trips that do not require all-weather accessibility (e.g.,
farm and forest roads); (ii) basic access, the minimum
required for all-weather passability, with exceptions
under extreme but infrequent weather conditions; and
(iii) full access, a fully engineered road providing all-
weather accessibility. Interestingly, this program allows
variations from officially approved design standards to
serve more poor communities.
Peoples Republic of China Country Study 49
Energy Sector Policy
Government expenditures in the energy sector have
remained relatively stable at about 20 billion yuan ($2.4
billion) annually from 1990 to 2000. Correspondingly,
energy production and consumption have not changed very
much over this period. However, the share of coal in total
energy production has been declining, while other sources
of energy are increasing. In 1990, coal accounted for 74%
of total energy production and 76% of total energy con-
sumption. These rates declined to about 67% by 2000.
After the United Nations Environment and Develop-
ment Conference in 1992, the PRC Government drew up
a sustainable energy development strategy, whose principles
have been reflected in numerous new laws and planning
provisions. While gradually reducing its dependence on
coal as a source of energy, the Government intends to
explore for petroleum and natural gas, develop new and
renewable energy sources, and improve energy manage-
ment. With reference to rural energy, the Government will
promote the rapid commercialization of rural energy prod-
ucts, promote energy-saving stoves, and develop small
hydro, wind power, solar photovoltaic (PV), geothermal,
and biomass technologies to support communities that
cannot be reached by grid power.
The Government sees energy as an integral part of its
poverty reduction and rural development strategy, which
is directed at the western part of the country. Two programs
focus specifically on poverty: the rural electricity network
innovation program and the renewable energy program for
remote areas. In 1999, the PRC Government launched a
series of rural power supply system reforms, including
infrastructure investment and management system
reforms, aimed at reducing the cost of power supply and
the sale price of electricity in rural areas. The total invest-
ment for the rural network is more than 100 billion yuan
($12 billion). The major targets of this program have been
achieved: the sale price of power has been reduced by 30%,
more rural households are connected to the system, and
rural people are provided with a more stable supply of
power.
Since 1998, the government has also spent more than
100 million yuan on renewable energy projects to supply
electricity to remote county townships unconnected to
the grid. The target for this program is to supply 12
county seats and 800 other towns with electricity from
renewable sources, especially wind and solar PV cells. The
total installed capacity will be about 20 megawatts from
solar and other energy sources. The State Power Corpora-
tion (the former Ministry of Electric Power) and other
related ministries have set out regulations for rural elec-
trification and rural energy development. Central and
local government subsidies are also provided for some
energy projects.
Official statistics show that about 92% of all villages
in the poor counties had gained access to electricity by
the year 2000. As with roads, this figure probably over-
estimates the proportion of poor households that are actu-
ally served by the system.
Case Study Context:
Shaanxi Province
haanxi Province is located in the middle of the coun-
try, in the heartland of ancient China (Map 5.1). It is
potentially a major crossroads for national and interna-
tional traffic. For planning purposes, Shaanxi Province is
considered to be part of the western region. The capital
city, Xian, is a major urban center, although the province
is predominantly (over 75%) rural. However, many
smaller towns are rapidly becoming urban centers. In the
past 10 years, the Government has made significant
investments in road, rail, and energy projects in Shaanxi
Province, some with ADB and World Bank financing.
Over the same period, the province has experienced sig-
nificant poverty reduction, with variations across the dif-
ferent regions within the province.
Shaanxi Province has an area of approximately 200,000
km
2
and a population of more than 36 million, divided
into 107 counties and county-level districts. About three
fourths of the population live in rural areas. The average
population density in 2001 was 189 persons per km
2
, but
this varies considerably from one area to another. The
province has three natural regions: the mountainous south-
ern region, the central Weihe Valley, and the northern
upland plateau. Population density is highest in the cen-
tral region, which also contains the city of Xian. From
221 BC to the Tang dynasty, Shaanxi was the center of
political activity in China.
The northern upland part of the province is on the
loess plateau, where the climate and soils are unfavorable
for agriculture.
11
In the south, steep slopes and soil ero-
sion due to rapidly diminishing forest cover also pose prob-
lems for agricultural production. Shaanxi has a continen-
11
The loess plateau covers some 640,000 km
2
in the upper and middle
parts of the Yellow River floodplain. Loess is a light, loamy soil that is
highly prone to wind and water erosion.
50 Assessing the Impact of Transport and Energy Infrastructure on Poverty Reduction
tal monsoon climate, but rainfall and temperature vary
sharply from the north to the south. Average annual tem-
peratures range from 9 to 16 degrees Centigrade, and
annual rainfall from 265 to 975 millimeters. Per capita
cultivated land is 0.11 hectares (ha) on the average, rang-
ing from 0.2 ha in the loess plateau to 0.1 ha in the central
region and 0.08 ha in southern Shaanxi Province. The
variation between south Shaanxi and north Shaanxi in veg-
Map of
Shaanxi
to go
here
etation, rainfall, temperature, and population pressure is
very similar to the variation between the southern and
northern PRC. In this respect, Shaanxi Province may be
considered as representative of the entire country.
Shaanxi Province sustained high economic growth
from 1990 to 2000. The annual average growth in real per
capita income over this period was 7.5%. However, this
was not as high as the national growth rate. Consequently,
Peoples Republic of China Country Study 51
GDP per capita in Shaanxi was 76% of the national aver-
age in 1990, while it declined to 64% by 2000. The per
capita income of urban and rural residents in Shaanxi Prov-
ince grew by 4.6% and 2.8% per year, respectively, from
1990 to 2000.
The majority of workers (56%) in Shaanxi are self-
employed in the subsistence agriculture sector. Women
make up nearly half the labor force. The rate of unem-
ployment and underemployment in rural areas is high.
Consequently, many people migrate to towns and cities
to seek work. In 2001, 1.2 million or 9% of rural work-
ers did so. Employment in the urban areas of Shaanxi was
once concentrated in textiles, manufacturing, and services.
With the restructuring of economic activities, new industries
such as electronics manufacture and tourism have been grow-
ing rapidly. The registered unemployment rate in urban areas
in 2000 was 2.7%. However, this is likely to be underesti-
mated, as it takes account only of the unemployed who
have been laid off from state-owned or collective enter-
prises. True urban unemployment rates may be closer to
10%, with higher rates in the country towns.
Poverty
Shaanxi also has relatively high rates of rural poverty.
In 2000, according to the locally defined poverty line of
700 yuan ($84) per capita, 17% of the rural residents, or
about 1 million people, were living in poverty. The
income composition of poor households in Shaanxi is dif-
ferent from the national poor and provincial averages.
Although poor farm households in Shaanxi have more
arable land than nonfarm households (1.8 mu [about 0.12
ha] per capita in 2000), they gained a lower share of their
income from household production and a larger income
share from wages. Poor farmers in Shaanxi have much
lower land productivity than the national poor household
or the provincial average. They also gain less income from
township and village enterprises (TVEs) than in other
regions. Consequently, they are more dependent than oth-
ers are on finding employment elsewhere.
12
Poor households in Shaanxi Province spent 6% of their
incomes on transport and communication in 2000. They
paid a higher share of their income for travel and trans-
port than nonpoor households. Transport is not the high-
est expenditure priority for the poor, but increasing
expenditures on transport seem to be part of the pattern
for households that have moved up and out of the poverty
class.
13
In terms of assets, about 10% of poor households
owned motorcycles and almost all households owned at
least one bicycle. About half of poor households owned an
electric fan, about 40% owned a color television, and most
of the rest owned a black-and-white television.
Although their income levels were substantially lower,
poor households were not very different from others in
terms of consumption. This suggests that the main differ-
ence between poor households and others lies in their lim-
ited ability to save and invest in productive activities.
Transport
Between 1990 and 2000, the length of roads in Shaanxi
increased from about 38,000 km to about 44,000 km. The
proportion of paved roads also increased, from 70% to
80%. Length of railways increased by 30%, from 2,458
km to 3,228 km. Passenger transport increased from 2.02
million persons to 2.87 million persons, while freight
transport increased from 2.16 million tons to 2.92 million
tons. Highway transport increased its share in both pas-
senger and freight transport over this period. Though the
share of rail transport has been declining, it is still the
most important transport mode in terms of person-km
and ton-km. Transportation investment in the province
increased from 364 million yuan in 1990 to 10.6 billion yuan
in 2000, or about 28 times. The role of the private sector in
providing transportation services has also grown over this
period. By 2000, the private sector owned 46% of passen-
ger vehicles and 38% of freight vehicles in the province.
Both ADB and the World Bank have supported trans-
port investments in Shaanxi Province. The World Bank-
financed First Shaanxi Highway Project in 1988 supported
upgrading and expansion of the provincial highway net-
work in Shaanxi and institutional strengthening for the
provincial Transport Department; it showed that the pro-
vision of basic access through all-weather roads can be an
effective means of reducing poverty in rural areas, espe-
cially when combined with programs for socioeconomic
development. The Second Shaanxi Provincial Highway
Project in 1996, also World Bank-financed, included con-
12
The TVE policy was established in response to official restrictions on
rural-urban migration. Nonfarm income from TVEs has been a major
factor in poverty reduction in rural areas of the eastern region.
13
The direction of causality is not clear. It may be that increasing expenditures
on transport represents an investment with high returns (e.g., in looking
for work over a wider area), thus helping people to move out of poverty.
Alternatively, it may be that people who move out of poverty (for other
reasons) increase their expenditures on transport as a consumption good.
Most likely, both types of factors may be at work.
52 Assessing the Impact of Transport and Energy Infrastructure on Poverty Reduction
struction of five high-grade highways totaling about 240
km, as well as link roads at interchanges and about 4,100
km of rural roads under the RIPA program; it also
financed construction supervision and environmental
monitoring, maintenance of the national highways and
the provincial highway network, a provincial road safety
program, and studies and training. An ex post evaluation
of this project concluded that the RIPA program signifi-
cantly contributed to improving access in remote areas
and expanding growth opportunities in poor areas of the
province (World Bank 2003b, p. 20).
The Shaanxi Roads Development Project, approved
by ADB in 2001, is constructing a 176-km expressway
between Yumenkou on the Shaanxi Province border and
Yanliang, near the city of Xian. This road is an important
missing section in the National Trunk Highway System
that will help link the western and coastal regions as part
of PRCs poverty-oriented Western Development Strat-
egy. The project will also improve 627 km of county and
local roads connecting to expressway interchanges and
connecting local communities in eight poor counties tra-
versed by the expressway. The ADB-supported Hefei-
Xian Railway Project, which traverses the southeast part
of Shaanxi Province, will provide a direct rail link from
four interior provinces to the coastal region, providing
efficient transport for large quantities of high-grade, low-
sulfur coal from Shaanxi; it will also construct 52 new
railway stations. The project is expected to generate sig-
nificant direct and indirect employment benefits. At
present, ADB is preparing an Urban Transport Project
for Xian that will include construction of a ring road and
connector roads to the urban network, as well as urban
transport planning, traffic management, safety, and main-
tenance components.
Energy
Energy production increased by 50% between 1990
and 2000 in Shaanxi Province. In the same period, energy
consumption increased by 17%. Investments in the en-
ergy sector grew from 1.42 billion yuan to 10.3 billion
yuan over this period. The four main energy sources of the
province are crude coal, petroleum, natural gas, and hy-
droelectric power. Petroleum production grew at the fast-
est rate. Shaanxi Province is clearly a
net energy exporter, but the electric-
ity consumption of urban and rural
residents increased three-fold be-
tween 1990 and 2000; that of rural
residents increased 4.4 times during
this period, largely due to rural vil-
lage electrification programs.
ADB has been active in the PRCs
energy sector policy dialogue, with
the aim of promoting more efficient
management and more equitable
price policies and recognizing the
role that energy can play in poverty
reduction in rural areas. However,
neither ADB nor the World Bank has
yet financed an energy project in
Shaanxi Province. A Global Environ-
ment Facility project implemented by
the World Bank in western PRC,
including Shaanxi Province, is pro-
moting the installation of small solar PV systems to meet
household energy needs.
Yulin Prefecture
The PRC study team selected two prefectures to be
study sites in Shaanxi Province, one in the north and one
in the south. Yulin Prefecture, in the north, has been the
major energy base of the province. It contains one of the
seven largest coalfields in the world, with reserves esti-
mated at 271.4 billion tons. It also contains important
petroleum and natural gas resources. In recent years, as a
result of transport improvements, Yulins resources, espe-
cially coal, are being developed. Since the late 1980s, three
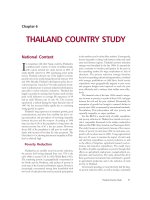
Throughout the country, railway construction generates substantial direct and
indirect employment.
Peoples Republic of China Country Study 53
railways have been built or are under construction in the
prefecture; most of the main highways have been paved.
The major constraint on rural poverty reduction in Yulin
Prefecture is water scarcity.
Shangluo Prefecture
Shangluo, in the south, has also experienced major
changes in its rail and highway infrastructure in the past
5 years. Shangluo Prefecture underwent about $2 billion
in highway construction between 1996 and 2000, to build
466 km of new highways and rebuild 1,802 km of existing
highways. The railway from Xian to Ankang passes
through the counties of Zhashui and Zhenan, which were
selected as study sites. The opportunities for poverty
reduction in Shangluo are mainly constrained by the very
limited amount of arable land owned by farmers.
Methodology
Definition of Poverty
The PRC study team used four different definitions of
poverty in its analysis. The first is a measure of income-
based poverty based on the official poverty line, which was
equivalent to about 66% of the international $1-a-day
standard established in 1998 (in 1993 purchasing power
parity terms). The second definition is poverty based on
incomes of less than $1 a day. The third is based on con-
sumption expenditures of less than $1 a day. The fourth
measures poverty in the value of household assets, defined
as less than 50% of the sample average value of assets per
capita. The calculation of asset-based poverty includes
the values of housing, productive assets, furniture, and elec-
trical equipment. Based on data from the field survey, the
team found relationships between
income-based poverty (using the offi-
cial poverty line) and asset-based pov-
erty
that are expressed in Table 5.1.
Thus, although only 20% of the field
sample households were poor accord-
ing to the official income-based mea-
sure, nearly half the sample households
were relatively deprived in terms of their
asset base. This suggests that many
income-based nonpoor households
have only recently emerged from pov-
erty, possibly in response to recent trans-
port and energy investments.
Transport and Energy
Interventions
The study examined the use of transport and energy
services by poor and nonpoor households in selected poor
counties in the two prefectures of Yulin and Shangluo. An
econometric analysis of household survey data was con-
ducted, using household access to transport and energy
infrastructure, the quality and intensity of services, house-
hold expenditures on services, and the value of transport-
and energy-related household assets as input variables.
Case studies then looked more closely at the impacts of
road and railway construction, the impacts of bus and rail-
way stations, and synergies created by adding complemen-
tary investments.
Research Methods
The study used household data from two sources. The
first is the Shaanxi provincial database for poverty moni-
toring. This database contains data from surveys conducted
annually from 1997 in the 50 officially designated poor
counties of Shaanxi Province. In each poor county, 5 to 10
villages are randomly selected, and within each village, 10
sample households are randomly selected. These house-
holds maintain daily records that provide information on
income, expenditure, assets, and demographic change. This
study used data for 1,180 sample households in the 19
poor counties located in Yulin and Shangluo prefectures.
Of these households, 1,143 were the same in 1998 and
2001. Thus, this can be considered panel data, i.e., data
collected regularly from the same subjects.
The study team also undertook field surveys in four
counties, two in Yulin and two in Shangluo. The selection
of sample counties was based on the incidence of poverty
Asset-Based Poverty
Poor Nonpoor Total
Poor 83 47 130
13.3% 7.5% 20.8%
Nonpoor 214 280 494
34.3% 44.9% 79.2%
Total 297 327 624
47.6% 52.4% 100.0%
Income-
Based
Poverty
(Type 1)
Source: Shaanxi provincial database.
Table 5.1. Income-Based Poverty and Asset-Based Poverty
54 Assessing the Impact of Transport and Energy Infrastructure on Poverty Reduction
in 1993 (the date of the earliest available poverty data).
All poor counties in the province were ranked by the inci-
dence of poverty in 1993. Four counties were selected
from this list using systematic random sampling. Three
of the four counties were located in Yulin and Shangluo
prefectures. For convenience, the list was adjusted by
selecting another county within those prefectures with
characteristics that most closely matched those of the
fourth county selected through random sampling. The
finally chosen counties are Shenmu and Jingbian in the
north and Zhashui and Zhenan in the south
(Table 5.2).
In 1993, on average, the sample counties had a higher
GDP per capita than the prefecture and provincial aver-
ages, but a lower per capita income and a markedly higher
incidence of poverty. This particularly reflects the situa-
tion in Shenmu county, where a high GDP was generated
by state-owned enterprises (coal mines), but the benefits
were not widely shared with local farmers. With the
development of local coal production, this situation has
now changed.
In consultation with county and local officials, the study
team selected three sample villages within each sample
county, based on recent changes in transport and energy
infrastructure. The county poverty alleviation office main-
tains a list of poor households in each village, a classifica-
tion dating from 1996. The team used this list in combi-
nation with a list of households classified by economic
activity, prepared by village officials, to establish a sample
frame for each village. Based on the proportion of house-
holds engaged in each economic activity and the propor-
tion of poor households, the team determined the number
of households to be selected from each category (Table
5.3). Ultimately, the field survey sample covered 624
households, of which 130 were officially listed as poor.
This sample represented 30% of all households in the
sample villages.
The characteristics of the field survey sample matched
well with the characteristics of the sample drawn from the
provincial survey database. The lower value of assets and
greater incidence of poverty in the field survey sample
may be explained by the fact that these data for the field
survey sample are for 1996, while the provincial data (in
the second part of the table) are for 1998.
The field study included village key informant inter-
views, household interviews, participatory assessments,
and focus group discussions. Key informant interviews
were used to obtain data on village-level changes in trans-
port and energy infrastructure and services and on socio-
economic changes in the village in general. The house-
hold interviews focused on assessing the household-level
impacts of transport and energy changes. Participatory
discussions were carried out in all the sample villages to
assess the impacts of transport and energy changes and the
constraints preventing villagers from taking greater
advantage of these interventions. In each village, at least
30 participants of varied occupations and gender contrib-
uted to the assessment.
To ensure that vulnerable groups, such as the poor and
women, had the same opportunities as others to voice their
opinions, special arrangements were made during the par-
ticipatory group dis-
cussions. First, the
community leaders
were separated from
the ordinary farmers
to avoid the leaders
dominating or inter-
fering with the discus-
sion. For this pur-
pose, a group inter-
view with community
leaders was arranged
while the farmers
group discussion was
going on. Second, all
participants were
asked to write down
basic information
such as their name,
community, and
Population Income per GDP per Poverty
(000) Capita (yuan) Capita (yuan) Incidence (%)
Zhenan 280 463 1,571 26.81
Zhashui 160 443 1,065 30.77
Shangluo 2,340 497 1,299 33.21
Jingbian 250 457 2,187 87.55
Shenmu 320 463 3,998 43.86
Yulin 3,000 432 2,419 44.07
Shaanxi (all 13,540 482 1,910 33.10
poor counties)
Table 5.2. Comparison of Sample Counties, Sample Prefectures, and
All Poor Counties in Shaanxi Province
(Based on 1993 Census)
Source: Shaanxi provincial database, PRC study team field survey database.
Peoples Republic of China Country Study 55
cessing, construction,
commerce, and ser-
vices, as well as in larger-
scale commercial agri-
culture. Finally, institu-
tional interviews were
carried out with repre-
sentatives of transport
and energy agencies to
complement statistical
data with current infor-
mation on development
status and change, sup-
ply of services, and
institutional gover-
nance, as well as to iden-
tify policy and institu-
tional barriers to the
participation of the poor
in infrastructure project
benefits.
Data from the pro-
vincial survey for 1,018
households, as well as
data from the field sur-
vey for 620 house-
holds, were used to
estimate probit mod-
els (a type of probabil-
ity estimate) relating
transport and energy
variables, as well as
other socioeconomic
variables, to the prob-
ability of a households
being poor in 2001.
Selected data, both quantitative and qualitative, were used
to analyze the impacts of specific interventions. The
results were then used to formulate recommendations for
improving the impact of national policies and programs
on poverty reduction.
Sample Communities
Three sample villages were selected in each of the four
sample counties.
Jingbian County (Yulin Prefecture). The vil-
lage of Wanquze is a township center located 30 km from
experiences with transport and energy, and then to read
the card aloud as an introduction when speaking to the
group for the first time. This placed all participants on an
equal footing. Finally, other participatory tools were used
to give equal opportunity to all participants, such as
impact matrixes, and household mobility mapping.
Smaller group discussions were held on some issues to
increase the interaction among participants, especially
those from vulnerable groups.
Focus group discussions were also organized with spe-
cific groups of transport or electricity users of various
business backgrounds and gender. The participants in these
discussions were those who made the greatest use of transport
and energy services. They were engaged in transport, pro-
Total Households Poor Households
County Village Households in Sample in Sample
a
Dacha 188 49 10
Jingbian Chelukao 265 50 14
Wanquze 323 56 19
Gaorenlimao 142 54 4
Shenmu Taihezhai 98 56 23
Mengjiagou 100 45 6
Yaowanggou 71 40 8
Zhashui Yingzhen 196 58 8
Mingxing 220 59 17
Baishu 130 50 3
Zhenan Shantai 106 47 3
Dianshi 218 60 15
TOTAL 2,057 624 130
Mu = 0.067 ha.
a
According to the 1996 listing.
Source: PRC study team field survey database; Shaanxi provincial database.
Table 5.3. Distribution of Sample Households
Field Survey Provincial Survey
Characteristic Sample (1) Sample (2) Ratio (2)/(1)
Family Size 4.58 4.67 1.02
Labor Ratio 0.58 0.55 0.95
Average Years of Education 6.10 5.83 0.96
Per Capita Arable Land (mu) 2.83 2.85 1.01
Percent Mountain Households 91 82 .90
Per Capita Value of Assets 1,954 2,414 1.24
Incidence of Poverty (%) 21 17 0.81
56 Assessing the Impact of Transport and Energy Infrastructure on Poverty Reduction
the county headquarters at Dagou and 5 km from the near-
est highway. At 323 households, it is the largest village in
the sample. An earth road to Dagou was constructed in
1970 and improved to all-weather standards in 2000. The
town was electrified in 1995 and every household in the
town has a connection. Thirty-two households in the vil-
lage have motorcycles and 5 have agricultural tractors;
none owns a truck. Eleven households have refrigerators,
and more than 300 have television sets. Twenty-nine house-
holds have telephones, installed since 1997. Three house-
holds are engaged in agricultural processing and the vil-
lage has about 15 shops. Some farmers raise livestock and
vegetables as well as less perishable crops; one household
has a greenhouse. Young people have been leaving the
village to look for work since 1988.
Chelukao is also a relatively large village with 265
households. It is 15 km from the township center at Dong-
keng and 37 km from the county seat. An earth road was
constructed from the village to the township center in 1972,
and in 1976 the road from the township to the county seat
was improved to all-weather standards. In 1998, the whole
village was electrified. Twelve households have motor-
cycles and 15 have tractors; 86 have television in their
homes and 6 have telephones. The village has three shops
and four processing industries: two rice and flour mills
and two producers of cooking oil. One village household
has a truck and provides transportation services to the
entire community. About 15% of the households raise live-
stock, mainly sheep. People have been leaving the com-
munity to seek work since 1985; the first group of long-
term migrants moved away in 1987.
The village of Dacha is smaller, at 188 house-
holds, but still large in comparison with some of
the other villages in the sample. It lies 10 km from
the township center at Zhenqing and 20 km from
the county seat. It is connected to the township cen-
ter by an earth road constructed in 1997. Electric-
ity became available in the village in 1987. Forty
households have television sets. The village has 15
motorcyclesbut no other motorized vehicles
eight shops, and three processing enterprises. This
village has a TVE, a chicken farm owned by four
households. Fifteen households raise sheep. About
60 people have left the village to look for work, and
30 have moved away for long-term employment.
Shenmu County (Yulin Prefecture).
The village of Mengjiagou is a relatively small
village of 100 households. Part of the township of
Hejiachuanit is located 10 km from the nearest
highway and 49 km from the county seat. Until recently, it
took 8 hours for residents of Mengjiagou to reach the
county seat. Since the construction of the Shen Peng Road
in 2000 and the Sha He Road in 2001 to all-weather stan-
dards, it takes only 1 to 2 hours to get there. The village
was electrified in 1978. Since the roads were improved,
the number of motorized vehicles has increased dramati-
cally: now there are 3040 motorcycles, 80% of which
were bought in the last few years, and 10 trucks, 7 of which
were bought in the last few years. Eighty households have
refrigerators, 45 have washing machines, 35 have refrig-
erators, and 31 have telephones. The village has 15 stores,
10 of which were established since the road was improved.
Eight households have established processing industries,
five of them since the road was improved. While few house-
holds raise livestock, four households have built green-
houses for vegetable production. Few people have left the
village looking for jobs, but 7080 persons participated
in the road construction activity, earning 2035 yuan per
day.
The village of Taihezhai is a township center
located
68 km from the highway at Shenmu. An earth road to the
county seat was built in 1978 and paved in 1999. Electric-
ity came to Taihezhai in 1982, and the supply of electricity
was strengthened in 2001. Although the townspeople did
not start to invest in motorized vehicles until recently, 83
households have purchased television sets since 1983. Ten
households have telephones. The village includes 6 shops,
2 restaurants, and 1 hotel. Five families are engaged in
processing activities. However, relatively little investment
has taken place in agriculture and livestock. Since the road
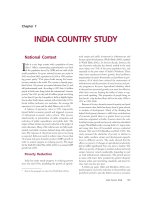
Community representatives in Zhenan County, Shaanxi Province,
exchange views with members of the study team.
Peoples Republic of China Country Study 57
was first built, about 35 households have migrated out of
the community to find work.
Gaorenlimao, a village in Qiaochatan township, is
located 108 km from the county seat at Shenmu, and 10
km from the township center. Here also, an earth road was
built in 1978 and paved in 1999. Electricity became avail-
able in Gaorenlimao in 1982, and the village also ben-
efited from network strengthening in 2001. The pattern
of investment in this remote community is similar to that
for Taihezhai. The community has 5 tractors (including 2
bulldozers), 6 trucks, and 2 minibuses purchased since
the road was paved. Sixty families purchased television
sets shortly after electricity came to the village; 10 now
have telephones and 5 have refrigerators. The village
includes 3 shops and 3 processing enterprises. Investment
in agriculture is limited, except for about 30 families that
raise sheep. Since the earth road was first built, more than
100 inhabitants have left the village to look for employ-
ment elsewhere.
Zhashui County (Shangluo Prefecture).The
village of Yingzhen is located 1 km away from the town-
ship center at Yingpan and 18 km from the county seat. It
is served by an all-weather road that was constructed in
1976. A railway passes near Yingzhen and the village is
only 1 km from the railway station at Yingpan. The town
has 196 households, and many residents have found
employment in road (350 persons) and railway (270 per-
sons) construction. Electricity has been available since
1982 to three settlements within the village, but one settle-
ment still has no electricity. Ten households provide trans-
portation services, with 6 minibuses and 2 trucks in the
village, as well as 4 tractors, 20 motorcycles, and 43 tri-
cycles. Almost all households have television sets, and 20
have refrigerators. The village includes 20 shops and 7
households engaged in agricultural processing. There is
also a village brick-making enterprise. Agricultural
activity is rather limited in Yingzhen. Some 200 people
have left the village to look for work elsewhere.
Mingxing is a relatively large village (220 households)
located 3 km from the highway at the township center of
Xialiang and 13 km from the county seat. The railway
passes by Mingxing and a railway station is located at
Xialiang. An earth road was constructed from the village
to the town in 1971. In 1976, this road was upgraded to
all-weather standards connecting to the town and the county
seat. About 200 persons from Mingxing have been
employed in road construction and 100 in railway con-
struction. The village has 4 trucks and 4 minibuses, as
well as 15 motorcycles and 51 tricycles. Fifty households
have refrigerators, 150 have television sets, and 75 have
telephones. Four shops are located in the village, and 20
households are engaged in agricultural processing. Sixty
people are employed part-time in transportation services,
20 are involved in long-distance trading, and about 10
have other specialized businesses. Four village enterprises
date from 1992. About 40 households raise livestock,
mostly sheep. Only a few people have left to look for work,
many years ago before the improved road was built.
The village of Yaowanggou has 70 households, the
smallest in the sample. It is located 6 km from the high-
way at the township center of Yingpan and 36 km from
the county seat. An earth road was constructed from the
village to the town in 1999. The railway passes within 5
km of Yaowanggou, but the nearest railway station is 10
km away. About 80 persons from the village have been
employed in highway construction and 30 in railway
construction. The village was electrified in 1989, and
the system was upgraded in 2002. The village has
8 motorcycles, 1 tractor, and 1 tricycle, all purchased since
1997. Sixty-one households have television sets, 3 have
refrigerators, and 12 have telephones. No shops or other
family or village enterprises are located in the village,
although two households provide transportation services.
About 30 households have left the village to seek work
elsewhere
Zhenan County (Shangluo Prefecture). The
village of Shantai is relatively small (100 households). It
is located 8 km from the township center of Zhangjia and
58 km from the county seat. The earth road from the vil-
lage to the town was constructed in 1978 and upgraded to
all-weather standards in 1997; the road from the town to
the county seat has been all-weather since 1975. The vil-
lage is 20 km from the railway and 35 km from a railway
station. More than 200 persons have been employed in
highway construction and 27 in railway construction. The
village has been electrified since 1987. The village has
6 motorcycles, 9 tricycles, and 1 minibus. Practically all
households have television sets, while 2 have refrigerators
and 5 have (mobile) telephones. The village includes
1 shop and 3 households engaged in agricultural process-
ing. About 60 households have undertaken specialized
agriculture, planting tobacco, watermelons, and fruit trees.
About 35 households have substantial numbers of live-
stock, mainly sheep and pigs. Only 17 persons have left
the village to look for work, starting in 1985.
Dianshi is a relatively large village of 218 households,
located 3 km from the township center of Jiezi and 11 km
from the county seat. An all-weather road connecting the
58 Assessing the Impact of Transport and Energy Infrastructure on Poverty Reduction
township center to the county seat was constructed in 1987.
A road paved with stones was constructed in 1990 from
the village to the township center. Some 450 persons from
Dianshi Village have been employed in highway construc-
tion and 210 in railway construction. One village group
(four households) was connected to electricity in 1981,
but electricity became available to the whole village only
in 1990. The system serving one settlement was upgraded
in 2001. The village has 48 motorcycles, 6 trucks, 4 trac-
tors, and 5 tricycles; 15 households provide transporta-
tion services. Twelve households have refrigerators, 68
have telephones, and 182 have television sets. The village
has 20 shops and 8 processing enterprises, and 1 TVE in
mining. Two households are engaged in long-distance trad-
ing, and five have other specialized businesses. Quite a
number of households raise sheep and pigs, and others
produce vegetables. Since 1986, 86 persons have left the
community to find jobs.
The village of Baishu (130 households) is located
25 km from the township center of Qingtongguan and 61
km from the county seat. An earth road from the village to
the township center was constructed in 1972 and upgraded
to all-weather standards in 1999. A national highway built
in 1970 connects the village to the county seat. Electricity
became generally available in Baishu in 1992, although
four households have had it since 1984. The village has
10 motorcycles, 7 tricycles, 1 tractor, and 1 truck. Ninety-
one households have television sets, including 60 that have
color, while only 4 have refrigerators and 5 have telephones.
The village has about 20 shops and six households are
engaged in agricultural processing. More than 50 farm
(tobacco) and livestock raising. No migration out of the
village was reported by village authorities.
Household Characteristics
Household data from the provincial survey and from
the field survey were analyzed to compare the poor with
the nonpoor, using the official income-based definition of
poverty; and the poor with the nonpoor, using the con-
structed measure of asset-based poverty. In the provincial
survey data used for the probit analysis, income-based poor
households accounted for 28% of the sample and the
asset-based poor represented 30% of the sample. How-
ever, these were not always the same households. About
30% of the nonpoor by an income standard were poor by
the asset-based standard, and about 30% of the nonpoor
by an asset-based standard were poor by an income stan-
dard. In the field survey, the income-based poor consti-
tuted 40% of the sample used for the probit analysis and
the asset-based poor constituted 55%. In this case, about
44% of the nonpoor by an income standard were relatively
poor in terms of assets, while 24% of the nonpoor in terms
of assets were poor as defined by the national poverty line.
The distribution of household characteristics between
poor and nonpoor households according to these two pov-
erty criteria are shown in Table 5.4 for the provincial data-
base and Table 5.5 for the field survey database.
Poor households, by both criteria, tend to be slightly
larger than nonpoor households, and to have slightly lower
rates of labor force participation. Not a great deal of varia-
tion exists between the poor and the nonpoor in educa-
tional levels, although the nonpoor are slightly more likely
to have completed 6 years of schooling. However, a sharp
difference exists in the percentage of households with
skilled labor, especially in terms of income-based poverty.
Seventy-four percent of the provincial sample households
are located in mountainous areas, with a slightly higher
proportion of nonpoor households in these areas. Sixty-
five percent of the provincial sample households are
located in the north, but 91% of the income-poor house-
holds are in this region. Poor households are likely to
have a bit more arable land, but they are much less likely
than the nonpoor to have income from off-farm employ-
ment. They also have less opportunity to access technical
training, although they appear to have approximately equal
access to credit.
In terms of access to infrastructure, the income-poor
are somewhat less likely than the nonpoor to live in a vil-
lage with direct access to an improved road. However, the
poor and nonpoor in terms of assets are little different in
this respect. The income-based poor are slightly less likely
to live within 5 km of a bus station, but the asset-based
poor are slightly more likely to do so, while the situation
is reversed for access to railway stations. Nearly all sample
households have access to electricity. Though the poor
have relatively good access to transport and energy infra-
structure, they are markedly less likely to use these ser-
vices, as measured by per capita expenditure on transport
and energy.
The provincial data also show that from 1998 to 2001,
the prevalence of income-based poverty increased from
16% to 28%. This is probably due to prolonged drought in
Shaanxi Province over those years. However, asset-based
poverty declined slightly, from 33% in 1998 to 30% in 2001.
Data from the field survey sample differ from the pro-
vincial averages in only a few respects. The field survey
did register a higher incidence of poverty in the selected
sample counties and villages, particularly with respect to
asset-based poverty. This is partly an artifact of the analy-
Peoples Republic of China Country Study 59
Sample
Table 5.4. Characteristics of Poor and Nonpoor Households (Provincial Database)
Mu = 0.067 ha.
Income poverty = percent of households with per capita incomes below the national poverty line in the year concerned;
asset poverty = percent of households with a per capita value of assets below the average for the sample in the year
concerned; household size = number of household members; labor force participation = average percent of household
members of working age who are employed (including self-employed); average education = average years of
education of all adult household members; maximum education = index from 1 (illiterate) to 7 (university level),
measuring the highest educational attainment of any household member; percent skilled labor = average percent of
household members of working age who have acquired a productive skill; mountain location = percent of households
living in mountainous areas; North Shaanxi location = percent of households in the North Shaanxi part of the
sample; per capita arable land = average amount of arable land per household member; off-farm employment =
percent of household members of working age employed in other than household or farm work; technical training =
percent of households who have received some form of technical training during the previous year; access to credit
= percent of households who have received commercial or policy loans during the previous year; road access =
percent of households living in villages with motorable village road access; access to electricity = percent of
households connected to the electricity grid.
Source: Shaanxi provincial database.
Income-Based Poverty Asset-Based Poverty
Household Average Poor Nonpoor Poor Nonpoor
Characteristics (n=1,018) (n=284) (n=734) (n=308) (n=710)
Income Poverty (2001) 27.90 100.00 0.00 24.05 29.57
Asset Poverty (2001) 30.30 26.12 31.91 100.00 0.00
Household Size 4.32 4.41 4.28 4.56 4.21
Labor Force Participation 0.61 0.59 0.62 0.61 0.61
Average Education (years) 6.03 5.84 6.10 5.85 6.10
Maximum Education 3.89 3.84 3.91 3.88 3.89
Percent Skilled Labor 7.98 2.04 10.24 6.01 8.83
Mountain Location 74.30 60.14 79.79 69.62 76.34
North Shaanxi Location 65.00 90.72 55.05 65.51 64.79
Per Capita Arable Land (mu) 2.79 2.97 2.72 2.86 2.77
Off-farm Employment 0.14 0.08 0.16 0.12 0.15
Income Per Capita 1,041.99 948.64 1,078.12 960.93 1,077.23
(1998) (in yuan)
Value of Assets Per 2,475.95 2,581.24 2,435.19 1,509.13 2,896.18
Capita (1998) (in yuan)
Technical Training (%) 13.52 3.78 17.29 12.34 14.03
Access to Credit (%) 23.59 22.34 24.07 28.16 21.60
Road Access (1998) 31.93 24.05 34.97 31.96 31.91
<5 km from Bus Station 59.25 52.23 61.97 60.44 58.73
<5 km from Rail Station 6.23 3.44 7.31 4.75 6.88
Per Capita Transport 41.66 15.12 51.94 36.57 43.88
Expenditure (yuan)
Access to Electricity 97.03 98.97 96.28 94.62 98.07
(1998)
Per Capita Energy 15.93 16.06 15.88 15.55 16.10
Expenditure (yuan)
Income Poverty (1998) (%) 16.30 24.40 13.16 18.67 15.27
Asset Poverty (1998) (%) 32.98 28.87 34.57 65.82 18.71
60 Assessing the Impact of Transport and Energy Infrastructure on Poverty Reduction
Income-Based Poverty Asset-Based Poverty
Household Average Poor Nonpoor Poor Nonpoor
Characteristics (n=620) (n=245) (n=375) (n=343) (n=277)
Income Poverty (2001) (%) 39.6 100.0 0.0 52.5 23.7
Asset Poverty (2001) (%) 55.3 73.3 43.5 100.0 0.0
Household Size 4.6 4.7 4.5 4.6 4.5
Labor Force Participation 0.6 0.6 0.6 0.6 0.6
Average Education (years) 4.8 4.0 5.4 4.2 5.7
Maximum Education 2.9 2.7 3.1 2.8 3.1
Percent with Good Health 87.0 81.6 90.5 83.1 91.8
Percent Off-farm Employment 26.2 17.6 31.8 20.5 33.2
Mountain Location 91.4 87.5 93.9 89.6 93.6
Per Capita Arable Land (mu) 3.1 3.6 2.8 3.4 2.7
Income per Capita 1,430.3 228.3 2,253.2 791.9 2,049.1
Value of Assets per 5,671.2 2,881.7 7,604.3 2,021.1 9,209.6
Capita (1998) (in yuan)
Technical Training (%) 16.0 15.8 16.2 13.6 19.0
Access to Credit (%) 65.4 66.8 64.5 61.4 70.2
Road Access (1998) 38.3 27.8 45.6 31.2 45.2
Paved Village Road 53.5 50.2 55.4 49.9 57.7
Distance from Main Road 41.8 48.9 37.2 45.4 37.3
<5 km from Rail Station 18.7 9.31 24.9 11.3 28.0
Village Road Density 0.77 0.78 0.77 0.74 0.81
Per Capita Transport 66.4 40.7 83.2 44.9 93.0
Expenditure (yuan)
Access to Electricity 97.8 97.9 97.7 97.2 98.3
(1998)
Electricity Improvement 28.4 19.0 34.5 22.0 36.2
Per Capita Energy 115.3 57.9 153.0 65.4 177.1
Expenditure (yuan)
Asset Poverty (1998) (%) 47.8 62.4 38.2 70.4 19.7
Sample
Mu = 0.067 ha.
Income poverty = percent of households with per capita incomes below the national poverty line in the year concerned;
asset poverty = percent of households with a per capita value of assets below the average for the sample in the year
concerned; household size = number of household members; labor force participation = average percent of household
members of working age who are employed (including self-employed); average education = average years of education of
all adult household members; maximum education = index from 1 to 7, measuring the highest educational attainment of
any household member; percent with good health = percent of households where household member is disabled or
suffers from chronic disease; percent off-farm employment = percent of household members of working age employed in
other than household or farm work; mountain location = percent of households living in mountainous areas; per capita
arable land = average amount of arable land per household member; technical training = percent of households who have
received some form of technical training during the previous year; technical training = percent of households that received
some form of technical training during the previous year; access to credit = percent of households that received commercial
or policy loans during the previous year; road access = percent of households living in villages with motorable village road
access; distance from main road = average km from the households village to the main road linking it to a county town;
village road density = length of motorable village roads per km
2
of village area; access to electricity = percent of households
connected to the electricity grid; electricity improvement = percent of households living in villages with a reformed
electricity grid connection (larger loads and more reliable service).
Source: PRC study team field survey database.
Table 5.5. Characteristics of Poor and Nonpoor Households (Field Study Database)
Peoples Republic of China Country Study 61
sis, since a higher average value of assets was constructed
for the field survey sample, reflecting in part the effects of
the transport and energy interventions studied. However,
greater disparities between the poor and the nonpoor were
found in the field sample than in the provincial sample. In
the field survey, the asset-based poor had a slightly higher
rate of labor force participation than the asset-based
nonpoor, but the differences are small and may not be
statistically significant. The average years of education figure
recorded by the field survey is lower than the provincial aver-
age for poor counties, between 4 and 5 years rather than 6
years, with nonpoor household members being more likely
to have completed 5 years of schooling. In the field survey,
a question was also asked about family health. About 87%
of all households reported good health, but poor house-
holds were less likely to do so than nonpoor households.
Over 90% of the field survey sample households, com-
pared with 74% of the provincial sample, are located in
mountainous areas. However, in both cases a higher pro-
portion of the nonpoor lives in the mountains. As in the
provincial sample, poor households cultivate more land
than nonpoor households, but are markedly less likely to
have income from off-farm employment. Among the field
survey sample households, much less difference is notable
between the poor and the nonpoor in access to technical
training than in the provincial sample. In both cases, rela-
tively little difference was found in access to credit. Asset-
based poverty appears to be more important than income-
based poverty in determining household access to techni-
cal training and credit.
The field survey added some further measures of the
quality of transport and energy infrastructure available to
the sample households. Just over half of all sample house-
holds had village access to a paved road. The income-
poor were slightly less likely than the income-based non-
poor to live in a village with a paved road; the difference
was larger between the asset-based poor and nonpoor. The
average distance from a main road was 42 km, with poor
households, on the average, living farther from the road
than nonpoor households. Village road density varied little
as far as the income-poor were concerned, but slightly
more for the asset-based poor. Per capita expenditures on
transport were notably higher for the field survey sample
than for the provincial sample, although large differences
between the expenditures of the poor and nonpoor were
recorded in both cases. Some 28% of field sample house-
holds had benefited from improvements in the quality of
service provided by the rural electricity grid. Here, too,
the percentages of poor and nonpoor households benefit-
ing from these improvements showed marked differences.
The field survey did not attempt to reconstruct house-
hold incomes at a previous point in time. However, it did
record the value of household assets in 1996. Asset-based
poverty increased from 48% to 55% between 1996 and
2001 among the surveyed households. This was most
likely due to the prolonged drought, which forced many
households to liquidate assets. However, about 20% of
the households that were asset-poor in 1996 were not
asset-poor in 2001, indicating some progress in asset
poverty reduction.
Findings
Use of Transport and Energy
Services
The PRC study team based its analysis on the premise
that a fundamental prerequisite for transport and energy
infrastructure to have an impact on poverty reduction
would be that the poor used transport and energy services
effectively. For this reason, they examined household
expenditures on transport and energy and the value of
household assets that could be used in both cases (Table
5.6). Not surprisingly, the poor spend less than the nonpoor
on both transport and energy. However, the expenditures
of the poor on transport and energy are significantly higher
as a percentage of their income than those of the nonpoor:
the poor spend, on average, 18% of their (cash) income on
transport and 25% on energy, while the nonpoor spend
less than 8% on either service. This proportion declines
sharply, especially for transport, with rising income levels.
Relatively little variation in expenditures on electricity
can be seen. In fact, the poor, as defined by the national
62 Assessing the Impact of Transport and Energy Infrastructure on Poverty Reduction
poverty line, actually spend, on average, a little more than
the nonpoor on electricity. The major difference, as far as
energy is concerned, is in the value of expenditures on
other fuels. This may reflect the greater propensity of non-
poor households to own motor vehicles and also, perhaps,
to use LPG appliances such as stoves. It may also be
related to the greater propensity of nonpoor households
to own processing assets, which may be powered by grid
electricity or other fuels (e.g., diesel).
Detailed information about the transport and energy
assets owned by poor and nonpoor households is presented
in Tables 5.7 and 5.8. Bicycles are the most popular means
of transport for both poor and nonpoor households. About
one third of all households are still using animal traction,
mainly donkeys and oxen, for goods transport.
In north Shaanxi, where over half the provinces poor
counties and poor population are located, donkeys have
played an important role in farming. They have been used
for threshing grain as well as for transporting crops to
market and inputs from market to farm. With the con-
struction of motorable roads, agricultural three-wheel trac-
tors are starting to take the place of donkeys for farm trans-
port and threshing grain. For example, Dacha village of
Jingbian county had about 900 donkeys before 1996, when
the motorable road was built. By 2002, the number of
donkeys in the village had dropped to less than 400. In the
meantime, the number of agricultural three-wheel trac-
tors increased to 50.
On average, 14.4% of sample households owned three-
wheel tractors by 2002. Nonpoor households owned more
than poor households by a factor of about 30%. These
vehicles can also be used for commercial transport. Agricul-
tural three-wheel tractors also used to be important for pas-
senger transport to markets and bus stations. Recently, how-
ever, the transport administrative authority forbade their use
to carry passengers because they are thought to be unsafe.
This has created a problem for passenger transport in villages
not served by buses.
Motorcycles have started to become an important
means of transport, especially for young people. Over 10%
of sample households had motorcycles. Mainly, these are
nonpoor households. About 11% of the sample owned
other large commercial vehicles, including trucks, pick-
ups, tractors, and cars. More than two thirds of these
vehicles were owned by nonpoor households.
Unlike nonpoor households, the poor spend more on
electricity than they do on other types of fuel. This implies
that the poor mainly use energy as final consumers (e.g.,
for lighting and television) rather than as an input to pro-
duction. This argument is supported by the significant
differences between the poor and nonpoor in the types of
electrical appliances and processing assets the poor and
nonpoor own (Table 5.8).
The distribution of irrigation and processing assets
strongly favors the nonpoor. The number of pumps owned
per 100 asset-poor households is less than 10% of the num-
Asset-Based Poverty Income-Based Poverty
Average Nonpoor Poor Nonpoor Poor
(n=624) (n=327) (n=297) (n=494) (n=130)
Per Capita Transport 66.36 87.35 43.40 73.78 41.00
Expenditure
Per Capita Value of 227.30 265.02 186.05 257.87 177.24
Transport-Related Assets
Per Capita Energy 115.22 164.44 61.38 122.54 82.11
Electricity (47.24) (60.53) (32.70) (46.15) (51.22)
Other Fuels (67.98) (103.91) (28.68) (76.39) (30.89)
Per Capita Value of 400.27 581.02 202.53 413.29 230.39
Electrical Appliances
Per Capita Value of 269.27 477.15 41.85 250.66 61.11
Processing Assets
Table 5.6. Use of Transport and Energy Services by Poor and Nonpoor Households
(Yuan)
Source: PRC study team field survey database.
Expenditures
Peoples Republic of China Country Study 63
ber owned by the asset-based nonpoor. The number of
food processing machines owned by asset-based poor house-
holds is less than two thirds the number of those owned by
the nonpoor; this discrepancy is even greater with respect
to income poverty. In contrast, television is very popular
with most households. More than three fourths of the poor
households had television sets, as did almost all nonpoor
households. This situation presents an opportunity for the
Government and other organizations to introduce new
policies, programs, and technologies to both the poor and
the nonpoor through television programs.
Changes in Transport Mode
Five years ago, 65% of the interviewed farmers went to
market on foot. This proportion has now declined to 42%.
Asset-Based Poverty Income-Based Poverty
Average Nonpoor Poor Nonpoor Poor
(n=624) (n=327) (n=297) (n=494) (n=130)
Bicycles 61.06 73.01 47.99 58.55 56.10
Motorcycles 10.42 16.01 5.03 12.72 3.25
Tricycles 0.80 0.98 0.63 0.88 0.00
Draft Animals 48.72 41.41 56.71 52.63 49.59
Percent of Households 33.51 29.20 37.38 31.58 40.65
Owning Draft Animals
Three-wheel Tractor 14.42 16.99 11.95 15.35 13.01
Tractor 4.01 5.23 2.83 4.17 4.07
Farm Truck 2.56 4.90 0.31 3.07 1.63
Truck 2.40 4.25 0.63 1.97 1.63
Car 2.24 2.94 1.57 2.41 1.63
Table 5.7. Transport Assets Per 100 Households
(Percent)
Source: PRC study team field survey database.
Transport Mode
Asset-Based Poverty Income-Based Poverty
Average Nonpoor Poor Nonpoor Poor
(n=624) (n=327) (n=297) (n=494) (n=130)
Diesel Engine 5.45 6.75 4.03 4.82 7.32
Electric Pump 9.78 17.18 1.68 9.43 4.88
Food Processors 21.96 26.38 17.11 25.00 7.32
Fodder Grinders 4.33 4.91 3.69 5.48 0.81
Threshers 1.12 1.23 1.01 1.54 0.00
Television Sets 92.31 105.83 77.52 93.42 80.49
Cable Television 0.16 0.31 0.00 0.22 0.00
Gas Stove 0.64 0.92 0.34 0.44 0.81
Table 5.8. Energy Assets Per 100 Households
(Percent)
Source: PRC study team field survey database.
Appliance
64 Assessing the Impact of Transport and Energy Infrastructure on Poverty Reduction
The proportion of farmers who take a bus to market has
increased from 11% to 33%, and the number of farmers
using three-wheel tractors has doubled from 3% to 6%. It
is noteworthy that buses took over not only one third of
the walking trips but also almost the same share of trips
previously made by bicycle or motorcycle (mainly bicycle).
This is understandable because most of the sample farm-
ers live in the mountain areas, where bikes are not suitable
for goods transport. Five years ago, the share of (asset-
based) poor farmers walking to market (61%) was less
than the share of nonpoor farmers walking to market (69%).
With transport changes, the share of poor farmers has
dropped only to 45%, while the share of nonpoor
farmers has dropped to 39%. Thus, nonpoor
farmers have been more likely to take advantage
of market transport improvements (Table 5.9).
County towns are usually the small cities clos-
est to farmers. Five years ago, about 30% of farm-
ers went to county towns on foot or by bicycle.
Now less than 10% do so. In that period, the
proportion of farmers who took the bus to county
towns (including those who walk and then take
the bus) increased from 66% to 86%. The bus
has become the most important means of trans-
port for farmers to county towns (Table 5.10).
A striking change has occurred in the modes of
transport used by rural residents to travel to Xian,
the provincial capital and the largest city in north-
western PRC (Table 5.11). Five years ago, train
travel was not available, but today 69% of survey
respondents take the train. Significant variation between the
north and the south exists on this point. Today, 75% of the
respondents in the south take the train to Xian, while only
17% of those in the north do so. Five years ago, nearly 80% of
the interviewed farmers took the bus to Xian. The change in
mode of transport for travel to Xian is mainly due to the
comparative advantages of rail transport over road. These
advantages were identified in household interviews and par-
ticipatory group discussions as (i) saving timeon the aver-
age, round-trip rail travel to Xian was about 9 hours shorter
than the road trip; (ii) greater reliabilitytrain travel is less
likely to be affected by storms and flooding; and (iii)
The bus is the most important means of transport for farmers traveling
to county towns.
5 Years Ago Present
Transport Mode Average Nonpoor Poor Average Nonpoor Poor
Walking 65.07 69.03 61.21 42.11 38.87 45.34
Bicycle or Motorcycle 13.32 12.83 13.31 8.91 8.91 8.91
Three-Wheel Tractor 3.06 2.21 3.88 6.28 6.07 6.48
Bus 10.92 7.52 14.22 33.20 35.63 30.77
Train 0.00 0.00 0.00 0.40 0.40 0.40
Walk and Bus 6.11 7.52 4.74 5.26 6.48 4.05
Bicycle and Bus 0.22 0.00 0.43 0.20 1.21 1.62
Bus and Train 0.00 0.00 0.00 0.20 0.40 0.00
Donkey Car or Oxcart 1.31 0.88 1.31 1.62 2.02 1.62
Others 0.000.000.000.610.001.21
Table 5.9. Change in Transport Mode to Market
(Percent)
Source: PRC study team field survey database.
Peoples Republic of China Country Study 65
greater safetytrains are less likely to be involved in
accidents.
However, the bus remains the most important means
of transport for farmers traveling to other regions within
or outside the province. About 70% of the trips made to
other regions within the province are by bus, or a bus com-
bined with the train. For transport to other provinces, the
bus is also the most important means of transport, but
trains have increased their share of this market. These
findings show that the rail network does not serve as wide
an area as the highway network. The interviewed farmers
also traveled mainly to nearby provinces.
Changes in Frequency of Travel
The use of transport infrastructure is reflected not only
in the choice of transport mode but also in the frequency
of travel to different destinations. Five years ago, 59% of
5 Years Ago Present
Transport Mode Average Nonpoor Poor Average Nonpoor Poor
Walking 15.77 19.03 12.82 1.69 1.71 1.68
Bicycle or Motorcycle 13.46 13.77 13.19 6.10 6.83 5.39
Three-Wheel Tractor 2.88 2.02 3.66 4.07 4.44 3.70
Bus 52.31 44.53 59.34 75.76 71.33 80.13
Train 0.00 0.00 0.00 0.17 0.00 0.34
Walk and Bus 13.46 19.03 8.42 9.49 14.33 4.71
Bicycle and Bus 0.58 0.40 0.73 1.02 1.02 1.01
Bus and Train 0.00 0.00 0.00 0.00 0.00 0.00
Donkey Car or Oxcart 0.38 0.40 0.37 0.17 0.34 0.00
Others 1.15 0.81 1.47 1.53 0.00 3.03
Table 5.10. Change in Transport Mode to County Town
(Percent)
Source: PRC study team field survey database.
5 Years Ago Present
Transport Mode Average Nonpoor Poor Average Nonpoor Poor
Walking 0.00 0.00 0.00 0.00 0.00 0.00
Bicycle or Motorcycle 0.00 0.00 0.00 0.00 0.00 0.00
Three-Wheel Tractor 0.57 0.00 0.89 0.00 0.00 0.00
Bus 79.89 80.65 79.46 25.70 26.87 25.00
Train 2.30 0.00 3.57 52.51 47.76 55.36
Walking and Bus 12.07 17.74 8.93 2.79 5.97 0.89
Bicycle and Bus 0.57 0.00 0.89 0.00 0.00 0.00
Bus and Train 2.87 1.61 3.57 16.76 19.40 15.18
Donkey Car or Oxcart 0.00 0.00 0.00 0.00 0.00 0.00
Others 1.720.002.682.230.003.57
Table 5.11. Change in Transport Mode to Provincial Capital
(Percent)
Source: PRC study team field survey database.
66 Assessing the Impact of Transport and Energy Infrastructure on Poverty Reduction
all farmers in the field survey sample visited markets once
a month or more often. The share of farmers visiting mar-
kets this often has increased by 10 percentage points over
the past 10 years (Table 5.12). Although the proportion of
nonpoor households visiting markets once a month or
more is still greater than the proportion of poor house-
holds, the poor have increased their access to markets more
than the nonpoor over the last 5 years.
A significant change has occurred in the frequency of
travel to county towns. Five years ago, less than 30% of
interviewed farmers visited county towns once or more
per month. Now this proportion has increased to 46%
(Table 5.13). The frequency of visits by poor farmers to
county towns has increased at a higher rate than the
sample average. However, the proportion of the poor
visiting county towns once or more a month is still only
63% of that of the nonpoor.
The change in frequency of visits to Xian is very in-
teresting (Table 5.14). On the one hand, the proportion
of farmers visiting Xian more often than once a month
5 Years Ago Present
Frequency of Travel Average Nonpoor Poor Average Nonpoor Poor
> Once a Week 22.25 30.34 13.97 23.74 32.13 15.32
Once a Week 11.45 13.68 9.17 16.50 18.07 14.92
Twice a Month 10.58 9.83 11.35 14.08 12.05 16.13
Once a Month 15.12 13.68 16.59 15.29 12.45 18.15
Once Every 3 Months 13.17 10.68 15.72 11.67 10.04 13.31
Once Every 6 Months 10.15 9.83 10.48 7.85 8.03 7.66
Once a Year 6.91 6.84 6.99 5.03 2.81 7.26
< Once a Year 6.91 2.99 10.92 3.42 3.21 3.63
Once Only 3.02 2.14 3.93 2.21 1.20 3.23
Never 0.43 0.00 0.87 0.20 0.00 0.40
Table 5.12. Change in Frequency of Travel to Market
(Percent)
Source: PRC study team field survey database.
5 Years Ago Present
Frequency of Travel Average Nonpoor Poor Average Nonpoor Poor
> Once a Week 6.19 9.16 2.87 10.02 14.81 5.14
Once a Week 3.87 5.86 1.64 5.09 6.06 4.11
Twice a Month 6.77 8.06 5.33 11.38 13.13 9.59
Once a Month 12.19 13.55 10.66 19.19 21.89 16.44
Once Every 3 Months 18.38 16.85 20.08 20.20 18.52 21.92
Once Every 6 Months 14.70 14.65 14.75 11.38 9.43 13.36
Once a Year 13.51 13.92 12.30 9.00 6.40 11.64
< Once a Year 14.51 9.89 19.67 10.02 7.07 13.01
Once Only 8.32 6.59 10.25 2.72 2.02 3.42
Never 1.93 1.47 2.46 1.02 0.67 1.37
Table 5.13. Change in Frequency of Travel to County Towns
(Percent)
Source: PRC study team field survey database.
Peoples Republic of China Country Study 67
has declined from 4.6% to 2.8%. On the other hand, the
proportion of farmers visiting Xian more than once a
year has increased from 25% to 37%. About 10% of the
interviewed households had never been to Xian 5 years
ago but are going now. Interviews show that the reduction
in the proportion of farmers visiting Xian frequently was
due to nine farmers who traveled to Xian to purchase
goods to sell to railway workers during the railway con-
struction. Now that the railway is completed, they no longer
need to make this trip. However, the increase in the pro-
portion of farmers visiting Xian at least once a year is
mainly owing to the improvement of highways and the
opening of the new railway. In particular, with the
improvement in transport infrastructure, more rural work-
ers travel to Xian to seek employment. Generally, the
nonpoor visit Xian more frequently than the poor.
In general, with the improvement in transport infra-
structure, rural residents are visiting other provinces and
other regions within the province more frequently. The
shares of surveyed households visiting other regions within
the province and other provinces at least once a year have
increased by 6.2 and 5.0 percentage points respectively
(CASS 2004, Appendix 3, Table 2). For travel within the
province, the increase was almost entirely due to increased
travel by poor households. However, nonpoor households
accounted for most of the increased travel outside the prov-
ince. Most of them traveled to these places to seek
employment (Box 5.1).
Transport Time and Cost Savings
Changes in transport mode and in the frequency of
travel are associated with an increase in transport effi-
ciency and time saving. Transport times and costs used in
this study were defined as the essential time and costs spent
to make a round trip from home to destination, including
the time and money spent in vehicles, and on accommoda-
tions needed while waiting for or changing buses or trains.
As shown in Table 5.15, travel time to market over the
past 5 years was reduced by 1.2 hours on average, although
transport cost increased almost 50%. The average time to
travel to county towns declined by 50%, while the cost
declined by 10%. Focus group discussions and analysis of
the change in transport services show that the decline of
transport costs to county towns is mainly due to increased
competition in the local transport market. The number of
vehicles providing passenger transport services in the four
sample counties had nearly quadrupled since 1995.
Average transport times to Xian, other regions within
the province, and other provinces were reduced by 33%,
42%, and 15%, respectively. Average transport costs to
those destinations increased by 23%, 4%, and 10%,
respectively. The reasons why costs increased while travel
times decreased have to do with the lack of competition in
long-distance transport and, hence, higher prices for ser-
vices. In the PRC, rail transport is monopolized by the
state. Competition in long-distance road transport is con-
strained by high initial investment costs and other barri-
5 Years Ago Present
Frequency of Travel Average Nonpoor Poor Average Nonpoor Poor
> Once a Week 1.73 2.70 0.00 1.13 0.90 1.52
Once a Week 1.73 1.80 1.61 0.56 0.90 0.00
Twice a Month 1.16 1.80 0.00 1.13 1.80 0.00
Once a Month 4.056.310.007.349.913.03
Once Every 3 Months 8.09 9.91 4.84 12.43 15.32 7.58
Once Every 6 Months 6.94 8.11 4.84 10.17 12.61 6.06
Once a Year 5.78 6.31 4.84 7.34 7.21 7.58
< Once a Year 19.08 20.72 16.13 20.90 18.02 25.76
Once Only 24.86 19.82 33.87 22.03 20.72 24.24
Never 26.59 22.52 33.87 16.95 12.61 24.24
Table 5.14. Change in Frequency of Travel to Provincial Capital
(Percent)
Source: PRC study team field survey database.
68 Assessing the Impact of Transport and Energy Infrastructure on Poverty Reduction
ers to entry established by the administrative agency for
road transport. Most important, the price of fuel is rising
and tolls are being added to user charges. However, these
costs are directly linked to ensuring the adequate mainte-
nance of the network and enabling private investors to
make profits.
Changes in Energy Use
Energy use by the sample households includes both
electricity and other fuels. Rural electrification in the
sample villages started in the mid-1970s. In 1980, about
10% of sample households were connected to electricity,
principally generated by hydropower. By 1990, 42% of the
households were connected to the grid. In the 1990s, the
rate of rural electrification accelerated, especially after
1997, when the national Government implemented a pro-
gram to make every village accessible to power. By 2000,
99% of the sample households had access to electricity,
and all sample households had been connected to elec-
tricity by 2001.
However, electricity is being used mainly for consump-
tion purposes: 89% of the sample households used elec-
tricity only or mainly for lighting and powering electrical
appliances, though a few have used lighting to improve
their incomes (Box 5.2).
Before connecting to electricity, 99% of households
had been using kerosene for lighting. Due to cost and
other constraints such as market availability, the sample
households spent, on average, 43.6 nights a year without
lighting. As a result of replacing kerosene with electricity,
women and children had more time for study in the eve-
nings and for engaging in income-generating activities.
On the average, women spent about 1.8 hours after dinner
on these activities, half an hour more than they spent
before having electricity. Similarly, students spent three
quarters of an hour longer studying than they did before
their households were electrified.
The field survey showed that after electricity service
became available, 63% of the sample households were able
to use an electric pump for irrigation
(Table 5.16). This
proportion does not vary significantly between poor and
nonpoor households. However, electric pumps have not
helped very much during the recent drought because of
the lowering of water tables. Especially in north Shaanxi,
where rainfall is low and irregular, the main source of
water for irrigation is the Yellow River. Farmers in the
north, poor and nonpoor, depend on pumps for irrigation.
More nonpoor farmers have their own pumps, while most
poor farmers had to rent pumps. Eighty percent of the
interviewed households in the north used pumps for irri-
gation, but only 46% of the sample households in the south
did so.
In addition to lighting, most sample households use
electricity to power electrical appliances, mainly televi-
sion sets. On the average, households watch 2.4 hours of
television daily in normal months and 0.8 hours in the
peak agricultural season. Respondents mostly watched news
and soap operas. The news that concerns them focuses on
politics, the economy, and new technologies. For farmers
living in remote areas, television is the main way for them
to learn about the outside world. Television is also a very
important source for farmers to learn about new technolo-
gies and to access market information. Over 50% of the
survey respondents said they had learned about new tech-
Box 5.1. Road Construction and Migration for
Employment
Dianshi, a village in Jiezi township, Zhenan County, saw a
significant change in work-related travel after the construction
of a road from the village to the county town. Although the
distance between the two is only 8 km, the trip each way took
about 3 hours on foot because of its steep slopes. Before the
road was built, only 19 farmers traveled to the town to seek
jobs.
Now farmers can reach the county town by riding bicycles or
motorbikes, or by taking the minibus, a 1-hour trip; 41 of them
now regularly travel from Dianshi to look for work.
Among the six village groups covered by the case study, none
of the residents in group five, villages which are still not acces-
sible by road, traveled to the county town to seek employment.
Source: PRC study team.
As a result of replacing kerosene with electricity, children
now have more time for study in the evenings.
Peoples Republic of China Country Study 69
5 Years Ago Present
Average Nonpoor Poor Average Nonpoor Poor
Travel Time (hours)
Market 3.262.603.922.081.722.43
County Town 6.03 5.63 6.47 3.18 2.85 3.51
Xian 21.41 22.36 19.73 14.25 14.00 14.67
Other Shaanxi 27.50 25.50 30.41 47.03 26.95 80.22
Other Provinces 37.68 37.70 37.66 32.10 31.19 33.72
Travel Cost (yuan)
Market 4.594.474.746.865.617.97
County Town 12.85 13.55 12.06 11.43 11.13 11.74
Xian 80.11 87.08 67.64 104.01 123.45 70.51
Other Shaanxi 109.70 114.27 100.44 113.86 127.16 85.78
Other Provinces 183.67 199.88 160.88 204.30 211.75 191.23
Table 5.15. Change in Travel Times and Travel Costs
Source: PRC study team field survey database.
nologies from television, and over 20% said they had
adopted such technologies.
Other types of fuel used by sample households included
firewood, coal, charcoal, LPG, biogas, and agricultural
residues (grass or straw). Firewood is the principal fuel
used for cooking and heating in most households (Table
5.17). The surveyed households used about 40% of their
crop residues as fuel. In addition, each farmer spent, on
the average, 12.6 days a year collecting firewood. The poor
were more likely than the nonpoor to use firewood; con-
sequently they spent 2 more days per year on firewood
collection. The adults in the family, both men and women,
usually carried out this task.
Probit Analysis
A probit model was used to estimate the impacts of
transport and energy infrastructure, in conjunction with
other factors, on poverty reduction. This type of model
correlates the various factors with the probability of a
households being poor; it was tested on both the provin-
cial database and the field survey database. The catego-
ries of intervention variables include access to transport
and energy infrastructure, quality and intensity of infra-
structure, transport and energy expenditures, and value of
transport and energy assets. Other categories include
household size and employment patterns, locational
Before Electricity After Electricity
Average Nonpoor Poor Average Nonpoor Poor
Human Powered 24.53 21.74 26.67 7.22 5.83 9.09
Gravity Fed 62.26 65.22 60.00 25.56 26.21 24.68
Electric Pump 1.89 0.00 3.33 63.33 64.08 62.34
Diesel Pump 9.43 8.70 10.00 3.33 2.91 3.90
Hand Irrigation 1.89 4.35 0.00 0.56 0.97 0.00
Table 5.16. Change in Irrigation Methods
(Percent of households)
Source: PRC study team field survey database.
Irrigation Method
Item