Assessing the Impact of Transport and Energy Infrastructure on Poverty Reduction - Chapter 6 ppt
Bạn đang xem bản rút gọn của tài liệu. Xem và tải ngay bản đầy đủ của tài liệu tại đây (1.38 MB, 44 trang )
Thailand Country Study 91
Chapter 6
THAILAND COUNTRY STUDY
National Context
I
n comparison with other Asian countries, Thailand is
a medium-sized country of about 62 million people,
with a gross national per capita income in 2001 of
nearly $2,000 ($6,550 in 1993 purchasing power parity
terms). Thailand achieved one of the highest economic
growth rates in the world during the period between 1975
and 1995. Broadly, Thailands development policy has re-
volved around an open door for trade and heavy invest-
ment in infrastructure to promote industrial development,
especially in labor-intensive industries. Thailand has
largely succeeded in meeting basic human needs and has
good social indicators: an average life expectancy of 69
and an adult illiteracy rate of only 5%. The economy
experienced a setback during the Asian financial crisis of
199798, but recovered fairly rapidly due to continuing
strong growth in exports.
Thailands long experience of sustained growth, good
communications, and labor force mobility has led to ris-
ing expectations and perceptions of increasing inequality
between the poor and the nonpoor. According to 1998
data, less than 0.5% of the population is living below the
extreme poverty line of $1 a day per person. However,
about 28% of the population is still poor by world stan-
dards, with incomes of less than $2 a day per person. The
Gini index is 41.4, showing that income inequality in Thai-
land is relatively high.
Poverty Reduction
Thailand has an enviable record in poverty reduction,
the poverty level having dropped from over 57% in the
early 1960s to around 13% in 1992 (World Bank 1997).
The remaining poverty is geographically concentrated in
the North and the Northeast, with pockets of poverty in
rural areas of the Central and Southern regions. Poverty is
increasingly concentrated among farm households with
low levels of education that tend to preclude participation
in the nonfarm rural or urban labor markets. Consequently,
income inequality is rising, both between urban and rural
areas and between regions. Thailands poverty reduction
strategy was formulated in the late 1990s. It assessed the
main constraint to broader participation by the poor in
the expanding market for wage employment as lack of
education. The poverty reduction strategy therefore
focused on expanding educational opportunities, combined
with stronger prohibitions on child labor. Social service
expenditures were geographically targeted to poor areas,
and program designs were improved to reach the poor
more efficiently and to enhance their welfare more effec-
tively.
The financial crisis of the later 1990s caused a tempo-
rary increase in poverty, to a peak of about 16%, and gaps
between the rich and the poor widened. Presumably, the
resumption of growth has brought a renewed decline in
poverty since 2000, as measured by international standards.
Nevertheless, Thai policymakers still view poverty, and
especially inequality, as major problems.
For this RETA, a special study of public expenditure
and poverty reduction in Thailand was carried out to pro-
vide a comparable framework to the studies conducted in
India and the PRC (Fan, Somchai, and Nuntaporn 2003).
The study focuses on rural poverty because of the concen-
tration of poverty in rural areas (20% in rural areas com-
pared to 6% in urban areas in 2000). Using regional-level
data over 20 years, it examines the impact of rural roads
and electricity expenditures on poverty reduction, as well
as the effects of irrigation, agricultural research and ex-
tension, and education expenditures. The model traces
the effects of public expenditures on poverty through their
effects on agricultural employment, nonagricultural em-
ployment, and food prices. The study showed that all of
these government investments had contributed to growth
in agricultural production and to the reduction of rural
poverty in Thailand.
Government spending on rural electricity had the larg-
est poverty reduction effect, as well as having a substantial
92 Assessing the Impact of Transport and Energy Infrastructure on Poverty Reduction
impact on growth in agricultural productivity. Among the
channels linking rural electricity to poverty reduction,
increase in nonfarm employment accounted for 75% of
the effect, and growth in agricultural productivity for only
20%.
17
Expenditures on agricultural research and exten-
sion had the second highest poverty reduction impact, fol-
lowed by expenditures on rural roads. Roads had little
effect on agricultural productivity, however; their poverty
reduction impacts came mainly from effects on nonfarm
employment. The study results also suggest that rural non-
farm employment is driven much more by urban growth
than by growth in the agriculture sector.
Government spending on education had the fourth larg-
est impact on poverty, while irrigation had little effect on
poverty, although it had the second largest effect on agri-
cultural production. Since the importance of education to
reducing poverty has been demonstrated where this model
has been applied in other countries, the authors suggest
that basic education needs have now been largely met in
Thailand, even in rural areas, so that additional spending
on primary education has a low marginal impact on pov-
erty. The study also compared the regions and found that
government spending had the largest poverty reduction
effect in the Northeast Region, where poverty is now con-
centrated. In this area, the highest returns in poverty
reduction were associated with electricity and road
investments.
Transport Sector Policy
In Thailand, policymaking, planning, and program
implementation have traditionally been centralized in
Bangkok. Although road construction falls under various
government agencies, all of them are based in the capital.
At present, the Government is moving in the direction of
decentralizing responsibility for public investment plan-
ning and management, but these changes are not yet fully
operational. The national policy on infrastructure, as set
out in the current Ninth Economic and Social Develop-
ment Plan, proposed to shift away from the
past emphasis on construction toward
improved infrastructure management, bet-
ter transport services, and greater involve-
ment of the private sector. In addition, it
encourages local participation in both
infrastructure construction and service pro-
vision. Lastly, it takes into account poten-
tial linkages with the infrastructure systems
of neighboring countries.
Roads. Several government agencies
are responsible for developing the national
road network, which covered more than
200,000 km in 1996. The Department of
Highways (DOH) is responsible for
interurban roads and highways, accounting
for almost half of the total network.
Rural roads are the responsibility of the
Accelerated Rural Development Depart-
ment, the Public Works Department, or the Royal Irriga-
tion Department, while urban streets and expressways are
managed by the Bangkok Metropolitan Administration
or the Expressway and Rapid Transit Authority, respec-
tively. Most of the DOH network is paved and regularly
maintained. These roads link the national capital to the
main centers of each province, and these centers in turn to
the (district) centers. Traffic on these roads is heavy, vary-
ing from less than 1,000 vehicles per day (vpd) on the
tertiary roads to more than 25,000 vpd on the most heavily
trafficked roads in the Central Region.
Few barriers constrain entry into the transport services
sector, and a wide variety of vehicles can be seen on the
roads, especially on rural roads. In addition to cars, pick-
ups, minivans, buses, and trucks, three-wheelers adapted
for passenger and freight transport, e-tains (truck bodies
built over tractor engines), and motorcycles are commonly
used for public (taxi) as well as private passenger trans-
17
The remainder is accounted for by rural-urban migration, which may
be considered another measure of nonfarm employment.
Get Thai Superhighway
2 Photo
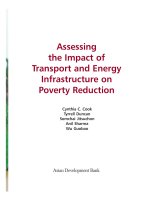
The Department of Highways manages the interurban road network, most
of which is paved and regularly maintained.
Thailand Country Study 93
port. Most households, even poor ones, own at least a
bicycle. Motorcycles and bicycles are often adapted to
carry small amounts of goods. Animal transport (bullock
and buffalo carts) and pedestrians also use the roads, espe-
cially in rural areas.
Rail. The development and operation of railroads in
Thailand comes under the responsibility of the State Rail-
way of Thailand (SRT). The SRT network comprises four
main lines and seven branch lines serving 47 provinces,
with a combined route length of more than 4,000 km. In
2001, SRT operated 286 passenger trains per day, 79 of
them express trains, carrying 56 million passengers over
the year. In the same year, the SRT operated 75 freight
trains per day, transporting 9.8 million tons of freight over
the year. Over 40% of this was container traffic, with
petroleum products and cement accounting for most of
the rest of the freight. Agricultural and industrial prod-
ucts represented only a small fraction (1.7% and 1.2%,
respectively) of rail freight traffic.
The SRT operates at a net loss, mainly because it sub-
sidizes rates for third-class passenger service, which
accounts for 92% of all passengers. These rates have not
been increased since 1985, and they are about 50% lower
than the rates for intercity bus service. Nevertheless, the
railroad has been steadily losing passenger traffic, while
freight traffic is increasing. For this reason, the merits of
continuing to subsidize third-class passenger traffic as a
poverty reduction measure have been under discussion for
some time.
Energy Sector Policy
Electricity generation was originally the responsibil-
ity of the Electricity Generating Authority of Thailand
(EGAT). In the early 1990s, however, the Government
decided to allow private companies to invest in power gen-
eration plants. These are classified as small power pro-
ducers (SPPs) and independent power producers (IPPs).
Companies in both groups sell electricity to EGAT and
can also sell directly to the public. SPPs may produce up
to 150 megawatts but can sell only up to 90 megawatts to
EGAT. The total contribution of private producers to the
electricity supply system is still small, but is expected to
increase under the Governments privatization policy. If
this happens, lower costs and increased availability of elec-
tricity throughout the country are likely. Some SPPs use
renewable fuels such as bagasse (agricultural residues),
paddy husks, wood chips, sawdust, municipal waste, and
biogas. Although the present contribution of these projects
to energy supply is minimal (less than 1% of the total),
this share could increase in the future. Such renewable
energy projects may benefit the poor, who are often
involved in the supply of renewable fuels.
In rural areas, electrification is provided by the Pro-
vincial Electricity Authority, which has carried out an
aggressive campaign of rural electrification over the past
10 years, aiming to reach as many remote areas as pos-
sible. Services to remote locations are partly subsidized
by profit sharing from EGAT. Consequently, community
coverage is now almost universal, except in a few very
remote locations. Most rural households have access to
electricity, either through direct connections or through
their neighbors.
Providing public services, including electricity, to
urban poor households that do not have a legal household
identification has been a problem. In the past, such house-
holds have had to make illegal connections to the lines
serving their legally resident neighbors, often paying these
neighbors more than the electricity would cost if they had
service of their own. Recently, the Government began to
issue quasi-household IDs, which enables these house-
holds to acquire electricity services legally.
Case Study Context
The Thai research team chose to study the poverty
reduction effects of (i) rural transport improvements, (ii)
rural electrification, (iii) urban electrification, and (iv)
long-distance transport by road and rail. With these top-
ics in mind, the team decided to conduct its field surveys
in three rural sites and two urban sites. The three rural
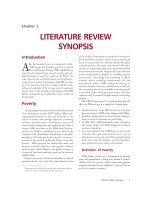
Providing electricity to households with no legal identifica-
tion has been a problem; people have connected illegally
to the lines serving their legally resident neighbors.
94 Assessing the Impact of Transport and Energy Infrastructure on Poverty Reduction
sites included two sites in the Northeast Region and one
in the Southern Region. In addition to being centers of
rural production, both regions are major destinations for
interregional transportation and are well served by both
road and rail systems. The Northeast Region (Map 6.1),
being the poorest, is also the one from which long-distance
migration for employment most frequently occurs. Migra-
tion is less important as a survival strategy in the Southern
Region , but the region relies heavily on transport to send its
primary products (e.g., rubber) to markets. The two urban
sites are slum settlements located in Nakhon Ratchasima
(provincial capital and major city of the Northeast Region),
and in Bangkok. These sites were chosen for reasons of con-
venience, as the Thai Development Research Institute
had
already conducted some research there and had built up good
relations with the communities concerned.
Northeast Region
Sample rural districts were selected on the basis of an
analysis of secondary data from a rural village database
maintained by the Thai Ministry of Interior. Village data
for 1990 and 1999 were analyzed to classify villages that
had experienced significant improvements in road trans-
port and electrification over that period. Significant
improvements were operationally defined as (i) a reduc-
tion of at least 50% in traveling time from the village to
the nearest district office using the most convenient trans-
port mode, and (ii) the connection to electricity of more
than 35% of village households over the 10-year period.
With this information, it was possible to classify villages
in a four-cell sample frame (Table 6.1).
The goal was to select districts that had villages of all
four types, to facilitate field work and to control, to some
extent, for situational factors that might affect with-and-
without comparisons. However, relatively few villages fell
into Types A and B, even based on the secondary data,
since even in 1990, more than 70% of households in
most villages were connected to electricity. A field
check on the secondary data showed that even those
communities having lower (less than 70%) electricity
penetration in 1999 were almost fully electrified by
the time of the field research in 2001. Thus, it became
impossible to compare electrified villages with
nonelectrified ones. Instead, the team opted to com-
pare households with and without electricity within
the same village. As a result, differences in road access
became the main criterion for selection of the sample
villages.
Based on the above analysis, the team selected two dis-
tricts, Wung Kata and Klong Muang, in Pak Chong County
of Nakhon Ratchasima Province, to form one of the North-
east Region sites. The other Northeast Region site was Pung
Gu District in Prakomchai County, Buri Ram Province.
Nakhon Ratchasima Province is the gateway to the
Northeast Region. The city of Nakhon Ratchasima is the
regions main urban center and transportation hub. Per
capita incomes in this province are about twice those of
Buri Ram Province, which is a more typical area for the
Northeast Region. The 1999 per capita income in Nakhon
Ratchasima was about $940. Nakhon Ratchasima is home
to many prominent national politicians, which means that
the province is relatively better provided with publicly
supplied infrastructure than the national average. Overall
population density in Nakhon Ratchasima is rather low
(124 persons per km
2
in 1999), due to the presence of a
large national park in the province. The sample districts
selected in Nakhon Ratchasima are located on the far side
of this park, which means they are relatively distant from
the regions major road network.
Wung Kata and Klong Muang districts are relatively
poorer areas in Pak Chong County and Nakhon
Ratchasima Province. Wung Kata, in particular, is iso-
lated by its hilly terrain and its location on the far side of
Khao Yai National Park. Both districts suffer from prob-
lems of water availability and water quality. Agricultural
yields are higher in Klong Muang than in Wung Kata;
Klong Muang is slightly better connected to the road net-
work and has better road conditions in general. From the
county seat at Pak Chong, it takes about 1 hour on a tertiary
road to reach Wung Kata District. Most of the road is still
laterite, although some portions are paved with asphalt.
Because of its beautiful scenery, Wung Kata was the site of
much speculative land purchase during Thailands economic
bubble of the late 1980s and early 1990s.
Within Wung Kata and Klong Muang districts, seven
villages were chosen for the study, divided into three
Transport Improvement
No Yes
No Type A Type B
Yes Type C Type D
Table 6.1. Distribution of Northeast Region
Sample Villages by Transport and
Electricity Improvements
Source: Ministry of Interior rural village database.
Electricity Improvement
Thailand Country Study 95
groups: villages with relatively poor road access, villages
with average road access, and villages with relatively good
road access. (The sample design, which called for select-
ing 100 households from each unit in the sample frame,
required clustering more than one village in order to
obtain an adequate sample). The three villages with rela-
tively poor road conditions and the two villages with aver-
age conditions were in Wung Kata District, while rela-
tively good conditions prevailed in Klong Muang Dis-
trict. The first group is farthest from the main road system
and has been reached with minor road improvements only
recently. Some of the earthen and laterite roads become
impassable during the rainy season. Only small stretches
of the roads are paved, in front of schools or temples. These
villages are served by one privately operated passenger
vehicle that leaves each village and returns once a day.
Children going to school ride on motorcycles or bicycles
to reach the point where they are picked up by passenger
cars. It takes 2 hours for people in these villages to reach
the county seat, and often much longer in the rainy season.
The villages in the second group are located closer to
the main road system. Most village roads that are not paved
are laterite rather than earthen. These villages benefit from
being located along the public transport routes that serve
the more remote communities, like the first group. Thus,
they have several options for daily travel outside the vil-
lages. These communities also have several stores selling
consumer products. Having good links to the national
road network makes it easy to obtain goods from major
markets, even by traveling to Bangkok.
The third village cluster, in Klong Muang District,
has been served by paved access roads for more than 10
years. However, one village (Nong Sai) has mainly earth
roads inside the village, while the other (Nong Sai Nea)
has concrete roads, as it is the site of an important temple.
Agricultural production patterns in all three groups are
similar, based on maize and cattle (including dairy pro-
duction) and some tapioca production.
Buri Ram Province is located farther toward the north-
east. It is more densely populated (147 persons/km
2
), more
96 Assessing the Impact of Transport and Energy Infrastructure on Poverty Reduction
agricultural, and less urbanized. Covering an area
approximately half that of Nakhon Ratchasima (includ-
ing the park), the value of Buri Rams provincial produc-
tion in 1999 was less than a third of that of its sister prov-
ince. Per capita income in Buri Ram Province in 1999 was
about $520. Though average household incomes were
lower than those in Nakhon
Ratchasima Province, expendi-
tures were about the same, indicat-
ing that households in Nakhon
Ratchasima have greater opportu-
nities to save and invest. Generally,
Buri Ram Province is less well
endowed with commercial services
than Nakhon Ratchasima. How-
ever, it is comparable in terms of
providing physical infrastructure
and social services (Table 6.2).
Pung Gu District in Buri Ram
Province is a typical northeastern
district, located south of the provin-
cial capital in Prakomchai County.
People in this district speak the
northeastern Thai dialect. Some
also speak Cambodian, because it
is located near (though not on) the
Cambodian border. The primary
crop in this area is rice, although
some farmers also grow vegetables or raise pigs.
Employment outside the village is also an im-
portant source of income in this area. Six vil-
lages were selected for the study, grouped ac-
cording to road conditions. In the villages with
poor road conditions, most working age adults
have migrated to nearby cities or to Bangkok to
look for work; only children and elderly people
are left in the village. Most villagers have little
land (averaging 2 rais [0.16 ha] per family),
and droughts occur frequently. The villages are
located on laterite roads about 2 km away from
the nearest paved road.
The second pair of villages offers a con-
trast in road conditions, showing that roads
alone cannot always explain differences in
welfare. The road to one village, Pung Gu,
was recently paved. The other village, Sri
Takrong, is still 3 km from a paved road, but
the villagers in Sri Takrong appear economi-
cally better off because they carry on com-
mercial transactions with businesses in the
Prakomchai county seat. The last group of two villages
has good road access. One of them appears more affluent,
as it is located on a major intersection well served by pub-
lic transportation. However, the other village has not ben-
efited much from having good roads, possibly due to the
fact that, as in Pung Gu, most villagers do not own land.
Nakhon Ratchasima Buri Ram
Population Density 124.00 147.00
Km of Roads/Area (km
2
) 2.31 2.85
Km of Roads/Population 0.02 0.02
% Electrified Villages 98.30 99.10
% Electrified Households 96.60 97.10
Schools per 1,000 Population 0.60 0.60
Teachers per 1,000 Population 8.90 9.00
Students per 1,000 Population 184.00 193.80
Hospitals per 1,000 Population 0.01 0.02
Health Centers per 1,000 Population 0.14 0.15
Clinics per 1,000 Population 0.12 0.03
Bank Branches per 1,000 Population 0.04 0.02
Hotel Rooms per 1,000 Population 1.40 0.35
Telephone lines per 1,000 Population 17.60 8.09
Source: Department of Local Administration, Ministry of Interior. Data for 1999.
Table 6.2. Characteristics of Northeast Sample Provinces
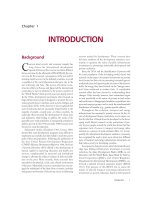
Rural roads carry a great variety of vehicles: three-wheelers and tractors
adapted for freight and passengers, motorcycle taxis, bicycles and
animal-drawn carts, in addition to cars, pickups, minivans, and buses.
Characteristic
Thailand Country Study 97
Southern Region
Within this region, the study team selected villages
from Wung Hin and Ban Nikom districts in the county of
Bang Chan, Nakhon Si Thammarat Province. Nakhon Si
Thammarat, like Nakhon Ratchasima, is a major rail hub
and destination for road travelers. The province enjoys
relatively good economic conditions, including good soils
and climate for agriculture. It also benefits from the accu-
mulated wealth of a once prosperous fishing industry. In
1999, per capita gross domestic product in Nakhon Si
Thammarat was $937, approximately the same as in
Nakhon Ratchasima. However, in physical area and popu-
lation density, Nakhon Si Thammarat is more like Buri
Ram Province. Commercial agriculture in the province is
based on the production of rubber, coffee, and paddy rice.
The capital city of Nakhon Si Thammarat is located on
the coast. It is large and historically important, but is not
directly served by a trunk highway. Rather, the main high-
way passes through Thung Song County, another major
business center in the province. The sample districts in
Bang Chan County, which is not located on the coast, have
better access to the road network via Thung Song.
Villages in these two districts are primarily engaged in
rubber production. Rubber trees are the symbol of South-
ern Region agriculture, and have long been the major
source of economic prosperity in the South. Rubber price
supports also contribute to the economic welfare of the
regions people. Educational levels are high; the region is
known for its active participation in the political life of the
country. On average, household landholdings are signifi-
cantly larger than those in the Northeast Region. Although
the sample districts in the Southern Region are less well
served than the sample districts in the Northeast in terms
of physical infrastructure, they are still considerably bet-
ter off than those in the Northeast in terms of economic
productivity.
The two sample districts are about 90 km from Nakhon
Si Thammarat city center, and about 20 km from Toong
Song county seat, the provinces second most important
business center. The districts are reached by a tertiary high-
way from Thung Song. Compared to other districts in
Bang Chan County, they are relatively isolated. Many
98 Assessing the Impact of Transport and Energy Infrastructure on Poverty Reduction
households in these districts have no direct access to pub-
lic passenger transport. Consequently, almost all of them
own motorized vehicles, at least a motorcycle. Most of
the seven sample villages were selected from Wung Hin
District. One adjacent village from Ban Nikom District
was added to the sample to provide an adequate sample
frame. The villages with poor access are located far from
paved roads and, because houses are spread out on rela-
tively large landholdings, some households do not even
have access to a laterite road. The medium-access group
is well served with laterite roads, while the good-access
villages are located near a recently improved asphalt road
linking them to a nearby business center in Trang Prov-
ince. Two of the three villages in this group also received
major electricity improvements in the last 5 years.
Urban Settlements
The study also covered selected slum communities in
Nakhon Ratchasima City and Bangkok. In Nakhon
Ratchasima, the community is located along the railway
and is called the Bailey community. In Bangkok, the
selected site was the Thepleela community, which is made
up of several neighborhoods scattered around the
Thepleela Road near Ramkhamheang University. Three
subcommunities were selected for the study. The residents
of these areas are generally poor and vulnerable, experi-
encing problems of job security as well as low status and
low social capital within the community. The Bangkok
community was selected because of the recent improve-
ment in a nearby major road (it was widened), as well as
the continual improvement of within-community roads
over the past 10 years. The Nakhon Ratchasima site was
selected because of its location along a rail line and also
its unusually low electrification rate.
In the urban sites, the transport intervention studied
was not so much road improvements as the availability and
quality of transport services, measured by access (walking)
times to pickup points for different transportation modes.
Slum dwellers in Bangkok could generally access motor-
cycles, minibuses, and buses by walking for less than 10
minutes, while for the Bailey community in the Northeast
the average was 12 minutes. Bangkok slum residents also
had access to boat service (10 minutes) and minivans (15
minutes). In contrast, for all slum residents, train service
was half an hour or more distant by walking. In Nakhon
Ratchasima, 77% of the slum residents interviewed had
no electricity connection. The reason for this low level of
connectivity is that the community is located along a rail-
way, and it is difficult and dangerous to lay electricity lines
across the rail line. In Bangkok, all slum dwellers had
access to electricity, although 30% used community meters
and 10% were connected through their neighbors.
Methodology
Definition of Poverty
The Thai country case study used three different defi-
nitions of poverty. The first definition is income-based or
objective poverty. The poverty classification used in the
study was calculated separately for the rural and urban
samples, based on the household data obtained in field
interviews. The median annual per capita income for the
rural household sample was close to 12,000 baht (B, about
$285), which is the same as the national official poverty
line for rural households in 2002. Households with per
capita incomes above this level were defined as nonpoor;
those below this level were defined as poor. Households
with per capita incomes below two standard deviations
from the mean (B8,500 or about $200) were defined as
ultra-poor. Based on this approach, about half of the rural
In Nakhon Ratchasima City, a slum called the Bailey
community is located along the railway.
Thailand Country Study 99
sample was poor (of which 35% were ultra-poor), and
about half was nonpoor.
Thailand has separate poverty lines for different urban
centers. In 2002, the poverty line was B12,650 (about
$300) for Nakhon Ratchasima and B13,447 (about $320)
for Bangkok. According to the official poverty lines, only
34 urban households (16% of the sample) were poor, and
most of these were in Nakhon Ratchasima. However, it is
believed that these poverty lines underestimate the real
extent of urban poverty, because they may not adequately
account for differences in urban consumption patterns.
Consequently, the study team classified urban households
with incomes below the urban poverty line as poor, and
households whose incomes were above the poverty line but
below the median income of the urban sample households
(B17,845, or $425) as near-poor. Conceptually, in terms
of consumption and quality of life, the category of poor
plus near-poor in urban areas corresponds to the category
of officially poor in rural areas, whereas the officially poor
in urban areas correspond more closely, though not
exactly, to the ultra-poor in rural areas.
The remaining urban households were classified as
nonpoor. It is interesting to observe that although many
more urban sample households (77) were in the near-poor
category than in the poor category (34), the great majority
of the nonpoor households (83 out of 98) had per capita
incomes more than two standard deviations above the
median (i.e., more than B20,380 or $485). This distribu-
tion illustrates the skewedness of income distribution in
Thailand, especially in urban areas.
The Thai study team was also interested in how
peoples perceptions of poverty affect their perceptions
about infrastructure improvements. For this reason, they
introduced the notion of subjective poverty, or poverty status
as reported by key informants (village and community
leaders). Using this method, relatively few of the rural
sample households were identified as poor (20%, as com-
pared to the 50% objectively poor). In urban areas, the
proportion subjectively classified as poor corresponded
more closely to the proportion of poor and near-poor. Strik-
ingly, about 40% of the sample households living in slum
settlements could be classified on the basis of income as
well-to-do,
18
but less than 10% were perceived by com-
munity leaders as being so. The team also measured rela-
tive poverty through self-reports, finding that the results
closely corresponded to the results using subjective
poverty. It shows that people perceive their own status and
are seen by their neighbors in relation to local rather than
national norms. Hence, in rural areas, especially poor
areas, objectively poor people may not be seen as poor,
whereas in urban areas, even the nonpoor, especially those
living in poor neighborhoods, may see themselves and be
seen by others as poor.
Finally, the Thai team used the subjective poverty
information to classify the sample households in terms of
change in poverty status over the last 10 years. A high per-
centage of rural households (about 44%) were said to have
moved out of poverty during this period, while 10% had
slipped into poverty. For the rest, 23% remained poor, and
23% remained well-off. Among the urban sample house-
holds, 47% have not been poor for more than 10 years, and
25% more moved out of poverty during this period, while
only 2% slipped back into poverty and 25% remained poor.
Transport and Energy
Interventions
As noted above, the basis for defining change in trans-
port accessibility was the recorded change in travel time,
by the most convenient means, from each village to the dis-
trict center. Changes in travel time could reflect road
improvements, transport service improvements, and/or
changing modes of transport, including increased private
vehicle ownership.
Out of the 20 rural communities selected for the study,
15 experienced a reduction in travel time to the district
center between 1990 and 1999. However, only 7 of these
experienced a reduction of over 50% in travel times.
19
In
Nakhon Ratchasima, out of six sample communities,
travel times improved in three villages but were reduced
by more than half in only one village (Pa Pai Dang). The
cause of the difference here seems to be not a change in the
length or type of road, but a striking increase in vehicle
ownership. In Buri Ram, three of six communities experi-
enced significant changes in travel times, and this seems
to be at least partly due to improvements in road quality,
including paving. Three of seven communities in Nakhon
Si Thammarat saw significant changes in travel times, and
this also appears to be attributable to partial paving of
access roads. Vehicle ownership increased dramatically in
all communities over the past 10 years.
With respect to rural electricity, the measure of change
was the percentage of households within each village con-
19
This analysis is based on information from the Nrd2c database for 1990
and 1999. The study team also evaluated this information for changes
between 1992 and 2001.
18
Households were classified as well-to-do if they had incomes more
than two standard deviations above the sample median.
100 Assessing the Impact of Transport and Energy Infrastructure on Poverty Reduction
nected to electricity in 1990 and 1999. According to the
village level data, two villages in Nakhon Ratchasima had
no electricity at either time, and one that had no electricity
in 1990 was 100% electrified by 1999. The other three
sample villages from this province were approximately
50% electrified in 1990 and somewhat more so (ranging
from 67% to 80%) in 1999. In Buri Ram, two of six sample
communities had no electricity in 1990, but were 100%
electrified in 1999. The other four communities had elec-
tricity in 1990, serving a little more than half the house-
holds, but were fully electrified by 1999. Only one sample
village in Nakhon Si Thammarat reported no electricity
in 1990, but the other six had electricity available in less
than half of all households. In 1999, connection rates
among the sample villages ranged from 70% to 90% of
households. Based on this information, the sample of
approximately 900 rural households can be distributed
according to the sample frame in Table 6.3.
No attempt was made to establish an objective mea-
surement of how the transport services available to the
urban slum residents changed over time. The soi (alley)
serving the Bangkok communities was recently widened
and has become a major thoroughfare, making a variety of
transport services more readily available. With respect to
electricity, the picture was radically different between the
two cities. In Bangkok, 100% of the surveyed households
had access to electricity, although 64% were unable to say
how long they had had it; 27% reported having had elec-
tricity for more than 10 years, 2% had had it for more than
5 years, and 7% had been connected for less than 5 years.
It is possible that the length of time served by electricity
has more to do with the length of time the household has
resided in the community than it does with the time since
service was provided, as it appears that electricity has been
available in this community for more than 10 years. In
contrast, in Nakhon Ratchasima, 73% of the interviewed
households had no electricity connection. Only one house-
hold had had electricity for more than 10 years, while the
remaining 25% were connected during the past 10 years.
Research Methods
The study aimed to adopt a double-difference approach
(before-and-after, with-and-without) at both the village
and the household level. Thus, it sought to compare wel-
fare changes over time between villages and households
with and without transport interventions, with and with-
out electricity, and with both types of changes, with the
objective of determining if impacts were significantly dif-
ferent between the poor and the nonpoor. The Thai study
team was particularly interested in letting respondents them-
selves explain how they perceived such effects. Conse-
quently, they built the main part of the study around house-
hold interviews, complemented by village-level informa-
tion and key informant interviews, limited participatory
focus groups, and supplemental secondary data analysis.
The household survey covered 913 rural households
and 209 urban households. The rural sample was
designed to include approximately 300 households
each from the selected sites in Nakhon Ratchasima,
Buri Ram, and Nakhon Si Thammarat. The urban
sample was designed to include approximately 100
households each from two urban settlements. As
described above, villages in rural areas were strati-
fied into three groups based on the quality of their
road access. A list of households in each community
was established in consultation with local authori-
ties. This list was further stratified according to sub-
jective socioeconomic status as reported by the
authorities, and households were then randomly selected
from the lists until the desired sample size was reached.
For the urban sample, about 100 households at the
Bangkok site were randomly chosen, out of around 3,000
households, while almost all households in the Nakhon
Ratchasima site were interviewed.
The household questionnaire included three modules:
(i) basic socioeconomic information; (ii) information on
access to and use of transport and energy services; and
(iii) perceived impacts of improvements in roads, rail
transport, and electricity. The first module included
information on occupation and income; assets (including
vehicles and electrical appliances, expenditure on energy,
electricity transport, and vehicle purchase); and additional
information on health, education, and debts, the role of
women, and family participation in social activities. In
each of these areas, the questionnaire explored changes
over the last 10 years. The second module explored access
Transport Improvement
Minor Major
Major 168 (19.9%) 152 (17.3%)
Minor 300 (34.1%) 260 (29.5%)
Table 6.3. Distribution of Rural Households by
Degree of Transport and Electricity
Improvements
Source: Nrd2c database, 1990 and 1999.
Electricity Improvement
Thailand Country Study 101
to and use of transport and energy services in greater
detail. The third module asked about perceptions of the
impacts of transport and energy improvements in a num-
ber of areas (suggested by the study research hypotheses)
and also solicited views on the distribution of those
impacts within the community. At the end, the question-
naire asked for the respondents opinion about develop-
ment in general and about the need for more investment
in transport and energy infrastructure. Questions about
positive and negative impacts were asked separately, and
respondents were then asked to evaluate net impacts.
The questionnaire was administered in an open-ended
fashion, by inviting respondents to identify impacts and
the mechanisms through which these impacts took place,
rather than by providing them with a checklist. In addi-
tion to the household surveys, the team conducted inter-
views with local officials to obtain village-level informa-
tion. It also conducted two focus group discussions to vali-
date information provided in the interviews. The focus
group in Nakhon Ratchasima involved six women, drawn
from the womens group and the first aid volunteer group
in two adjacent sample communities. In Nakhon Si
Thammarat, it involved six employees of one district
office, five men and one woman.
Sample Community and
Household Characteristics
The rural sample communities in Nakhon Ratchasima
ranged in size from 50 to 500 households, or 2001,650
people. Most were farm households, although many house-
holds have multiple sources of income. About three fourths
of all households owned their own land, and about 10%
were renters. Some both rent and own land. Almost all
grew maize and/or sweet corn, while about 15% on aver-
age also grew commercial crops like cassava and sugar
cane. A relatively small percentage of households raised
livestock. In Nakhon Ratchasima, 65% of survey respon-
dents reported their occupation as farmer, and 30% as
laborer. Other occupations included stock raising,
retail trade, and public employees. Within the survey
sample, 26% of households in Nakhon Ratchasima were poor
(including 16% ultra-poor), and 74% were nonpoor.
A similar pattern prevailed in Buri Ram. The sample
villages ranged from 80 to 250 households, or 2801,450
residents. The smallest, most remote communities grew
only rice and depended on earnings from wage labor. The
better-off farmers in more connected communities added
livestock and vegetables; however, wage labor was still an
important source of income. Seventy-six percent of respon-
dents from Buri Ram reported their occupation as farmer,
and 15% as laborer. Livestock raising was more impor-
tant as a primary occupation in Buri Ram, engaged in by
8% of respondents. However, poverty was much more wide-
spread in Buri Ram, affecting 71% of the sample (57%
ultra-poor).
The seven sample villages in Nakhon Si Thammarat
ranged in size from 65 to 135 households, or 350700
residents. More than half of all households relied exclu-
sively on agriculture, gaining their cash income from rub-
ber cultivation. They also had more diversified farm hold-
ings, with fruit orchards and livestock. These communi-
ties seemed more fully integrated into the cash economy,
since they reportedly did not cultivate seasonal crops. Only
one community (Ban Si Fai) had a high percentage (40%)
of households depending on rented land. Slightly over half
(53%) of the sample households in Nakhon Si Thammarat
were poor (33% ultra-poor), while 47% were classified as
nonpoor. Thus, among the three rural sites, Buri Ram was
the poorest, Nakhon Si Thammarat occupied a middle
position, and Nakhon Ratchasima had the lowest inci-
dence of poverty in the study sample.
The rural survey sample was selected in such a way
that approximately equal numbers of households lived in
villages with poor road conditions, moderate road condi-
tions, and good road conditions. This stratification was
applied in each province, so there was little variation in
this distribution across provinces in the study sample.
However, the household questionnaire also looked at the
quality of immediate road access enjoyed by each sample
household; 63% of the households were served by laterite
roads, 20% by paved roads, 8% by concrete roads, and
10% by earth roads or tracks. Thus, most of the rural
sample had immediate access to motorable roads.
Residents help the Thailand study team to map some
of the features of their village.
102 Assessing the Impact of Transport and Energy Infrastructure on Poverty Reduction
For electricity, the household survey examined the
method of connection and the length of time that a house-
hold had been connected. Only 33 of the rural sample
households (4%) had no electricity; 84% of the sample had
a direct connection, and 12% were connected through their
neighbors. These proportions did not vary significantly
across the three provinces. About 23% of the sample had
had electricity for more than 10 years, 33% were con-
nected 510 years ago, and 20% became connected within
the last 5 years. Twenty percent did not report the date
when they were connected, and as reported above, 4% of
the sample did not yet have an electrical connection.
For the urban sample, the measures of exposure to trans-
port and electricity were as reported above. The study also
classified the urban sample households by occupation.
About 39% of the sample were wage laborers; 17% were
salaried employees, 26% were engaged in petty trade and
commerce, and 17% were garbage collectors. Only 1%
of the survey respondents (two individuals) reported them-
selves as unemployed.
The analysis conducted by the Thai study team focused
on evaluating the impacts of rural transport and energy
improvements on rural poverty in two ways: first, by con-
ducting an econometric analysis of survey data to deter-
mine the relationship between such changes and changes
in household income, expenditure, and educational levels;
and second, by examining the differences between poor and
nonpoor households in their perceptions of a variety of
impacts. The urban household survey data were examined
separately for perceived impacts.
Findings
Econometric Analysis
he team ran regressions of various transport and
energy variables available from the village and household
surveys against measures of (current) household income
and expenditure and aggregate household educational
assets (average school years of all household members) as
a measure of wealth, for all households and for poor
households. The independent variables tested included
the following:
Number of roads to district offices in 1992 and 2001,
and change in this number between 1992 and 2001;
Length of paved roads to district offices in 1992 and
2001, and change;
Length of laterite roads to district offices in 1992 and
2001, and change;
Average travel time to district offices in 1984, 1992,
and 2001, and changes in 19841992, 19922001, and
19842001;
Percentage of households in the village with electricity
in 1992 and 2001, and change;
Years since a household gained immediate road access;
Years that a household has had electricity; and
Annual amount paid by a household for electricity.
The first five variables were taken from the Nrd2c
database for villages and attributed to the sample house-
holds, while the last three were taken directly from the house-
hold surveys. Village dummy variables were also introduced
into the analysis to account for other situational factors that
might have influenced changes in income, expenditure, or
education. Ordinary least square regressions with stepwise
selection were run for the entire rural sample and for poor
households separately. The regressions do not have a very
good fit (values of R
2
on the order of 0.1-0.3), as is com-
mon in cross-sectional regressions using household data.
Only one of the regressions yielded significant results
(p<0.05) with respect to household income, both for the
entire sample (Table 6.4) and for poor households (Table
6.5). This was the length of paved roads to the district
office in 2001. In addition, the household electricity bill
in 2001 was linked to household income for all house-
holds, but not for poor households. Village dummies also
yielded significant results in both cases, indicating that
factors other than transport and electricity were probably
more important in determining income variations. As with
all cross-sectional comparisons, it was impossible to
determine the direction of causality.
The fact that the length of paved roads to district of-
fices was significantly positively related to household
income in both regressions has three implications:
More paved roads are associated with higher incomes,
for both poor and nonpoor households. This could be
because paving roads helps increase incomes, but it
could also be that better-off households (for other rea-
sons) are more likely to attract road paving projects.
Unfortunately, the variables that could have introduced
a time dimension into this analysis turned out not to be
significant.
If improving roads generates income benefits, these
accrue to the village as a whole rather than to individual
households, since the length of time that a household
has had immediate road access is not significant in
Thailand Country Study 103
explaining income differences once the paved road
length to the village is included in the regressions.
Apparently, improving from laterite roads to paved
roads helped raise incomes more than improving from
earth to laterite roads, since none of the intervention
variables concerning laterite roads is significantly
related to incomes, either for all households or for poor
households.
For all households, the positive relationship between
electricity bills and household income could mean either
that higher electricity use enhanced incomes, or that higher
income permitted more electricity use. However, the
degree of electricity penetration in 2001 was negatively
correlated with the income of poor households. This was
not the expected outcome, since it was hypothesized that
the availability of electricity should open up more income-
earning opportunities for the poor. This result may reflect
an incipient inequality problem within the more
electrified rural communities. In fact, poor households in
these more modern villages were even poorer than the
Coefficients Standard Probability
Errors
Constant 8.422 0.073 0.000
Transport Variables
Number of Roads to District (1992) NS
Number of Roads to District (2001) NS
Increase in Number of Roads NS
Length of Paved Roads to District (1992) NS
Length of Paved Roads to District (2001) 0.035 0.003 0.000
Increase in Length of Paved Roads NS
Length of Laterite Roads to District (1992) NS
Length of Laterite Roads to District (2001) NS
Difference in Length of Laterite Roads NS
Average Travel Time to District (1984) NS
Average Travel Time to District (19922001) NS
Average Travel Time to District (19842001) NS
Change in Travel Time (19841992) NS
Change in Travel Time (19922001) NS
Change in Travel Time (19842001) NS
Years of Household Immediate Road Access NS
Energy Variables
Percent Village Households Electrified (1992) NS
Percent Village Households Electrified (2001) NS
Change in % of Village Households Electrified NS
Years Since Household was Electrified NS
Annual Electricity Bill 0.002 0.000 0.00
Village Dummy Variables (various) (various) <0.05
Table 6.4. Road and Electricity Impacts on Income for All Rural Households
(R
2
= 0.328; n= 683)
n = number of households participating; NS = not significant (p>0.05).
Note: The econometric analysis used data only from those households and villages that provided
information on all the parameters used in this analysis.
a
Dependent variable R
2
is a logarithm of total household income.
Source: Nrd2c database for villages; Thailand study team field survey.
Independent Variable
104 Assessing the Impact of Transport and Energy Infrastructure on Poverty Reduction
poor households in less modern ones; otherwise the
regression coefficient for electricity penetration would not
have been negative for poor sample households. Further
work needs to be done to determine whether this phenom-
enon was unique to the study sample.
When household expenditures were used as the depen-
dent variable, more intervention variables became sig-
nificant (Tables 6.6 and 6.7). The length of paved roads to
the district remained the most significant determinant of
household expenditures for all households. The change in
length of paved roads was significant for all households
and also for poor households. Interestingly, the length of
laterite roads to the district office in 1992 also had a sig-
nificant effect on household expenditures for all house-
holds (but not for poor households) in 2001. This may
reflect the effects of prior improvements from earth to
laterite roads, which stimulated growth in commerce and
farmer involvement in the cash economy. Recent
reductions in average travel time to the district center were
Coefficients Standard Probability
Errors
Constant 8.422 0.073 0.000
Transport Variables
Number of Roads to District (1992) NS
Number of Roads to District (2001) NS
Increase in Number of Roads NS
Length of Paved Roads to District (1992) NS
Length of Paved Roads to District (2001) 0.035 0.003 0.000
Increase in Length of Paved Roads NS
Length of Laterite Roads to District (1992) NS
Length of Laterite Roads to District (2001) NS
Difference in Length of Laterite Roads NS
Average Travel Time to District (1984) NS
Average Travel Time to District (19922001) NS
Average Travel Time to District (19842001) NS
Change in Travel Time (19841992) NS
Change in Travel Time (19922001) NS
Change in Travel Time (19842001) NS
Years of Immediate Road Access NS
Energy Variables
Percent Village Households Electrified (1992) NS
Percent Village Households Electrified (2001) NS
Change in % of Village Households Electrified NS
Years Since Household was Electrified NS
Annual Electricity Bill 0.002 0.000 0.00
Village Dummy Variables (various) (various) <0.05
Table 6.5. Road and Electricity Impacts on Income for Poor Rural Households
(R
2
= 0.183; n = 337)
a
n = number of households participating; NS = not significant (p>0.05).
Note: the econometric analysis used data only from those households and villages that provided infor-
mation on all the parameters used in this analysis.
a
Dependent variable R
2
is a logarithm of total household income.
Source: Nrd2c database for villages; Thailand study team field survey.
Independent Variable
Thailand Country Study 105
associated with higher expenditures, both for all house-
holds and for poor households.
Increasing the percentage of households with access to
electricity had the effect of inducing higher spending by
both poor and nonpoor households. Since it did not have a
similar effect on incomes for either group, this finding sug-
gests that such spending was related to consumption rather
than productive investment. In fact, the household inter-
views and focus group discussions showed that households
tended to imitate others consumption patterns when it
came to electric goods. For example, it was common for
families to want to own a television set when their neigh-
bors owned one. Higher expenditures for all households
were also correlated with the length of time that a house-
hold had been electrified. Again, village dummies pro-
duced significant results.
With respect to education, both the number and
increasing length of paved roads linking the village to the
Coefficients Standard Probability
Errors
Constant 8.732 0.128 0.000
Transport Variables
Number of Roads to District (1992) NS
Number of Roads to District (2001) NS
Increase in Number of Roads NS
Length of Paved Roads to District (1992) NS
Length of Paved Roads to District (2001) 0.035 0.003 0.000
Increase in Length of Paved Roads NS
Length of Laterite Roads to District (1992) 0.009 0.005 NS
Length of Laterite Roads to District (2001) NS
Difference in Length of Laterite Roads NS
Average Travel Time to District (1984) NS
Average Travel Time to District (1992) NS
Average Travel Time to District 2001) NS
Change in Travel Time (19841992) NS
Change in Travel Time (19922001) 0.013 0.002 0.000
Change in Travel Time (19842001) NS
Years of Household Immediate Road Access NS
Energy Variables
Percent Village Households Electrified (1992) NS
Percent Village Households Electrified (2001) NS
Change in % of Village Households Electrified 0.003 0.001 0.018
Years Since Household was Electrified 0.012 0.005 0.013
Annual Electricity Bill NS
Village Dummy Variables (various) (various) <0.05
Table 6.6. Road and Electricity Impacts on Expenditure for Poor Rural Households
(R
2
= 0.241; n = 623)
a
n = number of households participating; NS = not significant (p>0.05).
Note: The econometric analysis used data only from those households and villages that provided infor-
mation on all the parameters used in this analysis.
a
Dependent variable R
2
is a logarithm of total household expenditure.
Source: Nrd2c database for villages; Thailand study team field survey.
Independent Variable
106 Assessing the Impact of Transport and Energy Infrastructure on Poverty Reduction
district center predicted higher average years of educa-
tion per household in 2001 (Tables 6.8 and 6.9). For poor
households, the number of roads was significant, even
though the length of paved roads was not. This result may
be explained by the fact that poor households were not
usually located near village centers, and thus may have
benefited from having more alternative routes to places
outside the village. A lower average travel time to the dis-
trict center in 1992 also predicted higher average years of
education per household in 2001, for all households but
not for poor households. This parameter may reflect the
opportunity to access higher education, which may only
be available in the district centers.
Statistically significant relationships with educational
levels existed for the increase in the share of households
electrified, the number of years that a household had been
Coefficients Standard Probability
Errors
Constant 8.814 0.087 0.000
Transport Variables
Number of Roads to District (1992) NS
Number of Roads to District (2001) NS
Increase in Number of Roads NS
Length of Paved Roads to District (1992) NS
Length of Paved Roads to District (2001) NS
Increase in Length of Paved Roads 0.044 0.006 0.000
Length of Laterite Roads to District (1992) NS
Length of Laterite Roads to District (2001) NS
Difference in Length of Laterite Roads NS
Average Travel Time to District (1984) NS
Average Travel Time to District (1992) 0.010 0.001 0.000
Average Travel Time to District (2001) NS
Change in Travel Time (19841992) NS
Change in Travel Time (19922001) 0.006 0.002 0.0
Change in Travel Time (19842001) NS
Years of Household Immediate Road Access NS
Energy Variables
Percent Village Households Electrified (1992) NS
Percent Village Households Electrified (2001) NS
Change in % of Village Households Electrified 0.006 0.001 NS
Years Since Household was Electrified NS
Annual Electricity Bill 0.002 0.000 0.00
Village Dummy Variables (various) (various) <0.05
Table 6.7. Road and Electricity Impacts on Expenditure for Poor Rural Households
(R
2
= 0.192; n = 327)
a
n = number of households participating; NS = not significant (p>0.05).
Note: The econometric analysis used data only from those households and villages that provided infor-
mation on all the parameters used in this analysis.
a
Dependent variable R
2
is a logarithm of total household expenditure.
Source: Nrd2c database for villages; Thailand study team field survey.
Independent Variable
Thailand Country Study 107
electrified, and expenditure on electricity bills. This con-
firmed the hypothesis that electricity helps to enhance edu-
cational attainment. For poor households, however, the
only significant variable in this cluster is expenditure on
electricity. Given the respective time frames, it seems likely
that more education encouraged greater use of electricity
by the poor, rather than the other way around.
The study team also ran transport and energy inter-
vention variables, along with other household-level vari-
ables, against satisfaction scores given by respondents on
changes that had occurred over the past 10 years in family
income, family well-being, family convenience, and fam-
ily happiness, as well as in the village economy and society
(Table 6.10). The main finding was that households with
more assets were more likely to report positive changes
Coefficients Standard Probability
Errors
Constant 3.504 0.354 0.0
Transport Variables
Number of Roads to District (1992) NS
Number of Roads to District (2001) 0.438 0.150 0.000
Increase in Number of Roads NS
Length of Paved Roads to District (1992) NS
Length of Paved Roads to District (2001) NS
Increase in Length of Paved Roads 0.065 0.016 0.000
Length of Laterite Roads to District (1992) NS
Length of Laterite Roads to District (2001) NS
Difference in Length of Laterite Roads NS
Average Travel Time to District (1984) NS
Average Travel Time to District (1992) 0.005 0.002 0.000
Average Travel Time to District (2001) NS
Change in Travel Time (19841992) NS
Change in Travel Time (19922001) NS
Change in Travel Time (19842001) NS
Years of Household Immediate Road Access NS
Energy Variables
Percent Village Households Electrified (1992) NS
Percent Village Households Electrified (2001) NS
Change in % of Village Households Electrified 0.012 0.003 0.000
Years Since Household was Electrified 0.038 0.013 0.000
Annual Electricity Bill 0.003 0.000 0.00
Village Dummy Variables NS
Table 6.8. Road and Electricity Impacts on Education for All Rural Households
(R
2
= 0.154; n = 694)
a
n = number of households participating; NS = not significant (p>0.05).
Note: The econometric analysis used data only from those households and villages that provided
information on all the parameters used in this analysis.
a
Dependent variable R
2
is a logarithm of average years of schooling of household members.
Source: Nrd2c database for villages; Thailand study team field survey.
Independent Variable
108 Assessing the Impact of Transport and Energy Infrastructure on Poverty Reduction
over the last 10 years. Access to television and telephones
had a particularly positive effect on all facets of family life.
Ownership of radios and plows was linked to a positive
perception of changes in the village economy and society,
respectively. With respect to transport changes, results
were largely not significant. However, the average travel-
ing time in 1992 and the current number of roads to the
district office were associated with a perception of greater
family happiness. A greater length of laterite road in 1992
was associated with positive changes in family well-being,
and a greater length of paved road in 1992 with greater
family convenience. The current length of paved roads is
correlated with perceptions of positive changes in the vil-
lage economy and society.
Other factors possibly influencing peoples perceptions
of change were their occupation, their status as natives of
Coefficients Standard Probability
Errors
Constant 4.097 0.267 0.000
Transport Variables
Number of Roads to District (1992) NS
Number of Roads to District (2001) 0.438 0.150 NS
Increase in Number of Roads NS
Length of Paved Roads to District (1992) NS
Length of Paved Roads to District (2001) NS
Increase in Length of Paved Roads 0.065 0.016 0.000
Length of Laterite Roads to District (1992) NS
Length of Laterite Roads to District (2001) NS
Difference in Length of Laterite Roads NS
Average Travel Time to District (1984) NS
Average Travel Time to District (1992) 0.005 0.002 0.040
Average Travel Time to District (2001) NS
Change in Travel Time (19841992) NS
Change in Travel Time (19922001)
Change in Travel Time (19842001) NS
Years of Household Immediate Road Access NS
Energy Variables
Percent Village Households Electrified (1992) NS
Percent Village Households Electrified (2001) NS
Change in % of Village Households Electrified 0.012 0.003 0.000
Years Since Household was Electrified 0.038 0.013 0.000
Annual Electricity Bill 0.005 0.001 0.000
Village Dummy Variables NS
Table 6.9. Road and Electricity Impacts on Education for Poor Rural Households
(R
2
= 0.114; n = 337)
a
n = number of households participating; NS = not significant (p>0.05).
Note: The econometric analysis used data only from those households and villages that provided
information on all the parameters used in this analysis.
a
Dependent variable R
2
is a logarithm of average years of schooling of household members.
Source: Nrd2c database for villages; Thailand study team field survey.
Independent Variable
Thailand Country Study 109
the village or in-migrants, or the amount of debts they
owed. Being a farmer was correlated with positive percep-
tions of changes in family convenience, probably due to
the mechanization of agriculture over the last 10 years.
Being an in-migrant was correlated with a perception that a
familys income and welfare had deteriorated over time. Not
surprisingly, debts were negatively correlated with perceived
changes in family income, welfare, and happiness.
Perceptions of Impacts
Given the policy-oriented focus of the study, the Thai-
land study team set out to determine if the poor had differ-
ent views about the impacts of transport and energy changes
than the public at large. There were three possible out-
comes: (i) the poor benefit more from transport and en-
ergy changes than the public at large, (ii) the poor benefit
equally with the public at large, and (iii) the poor do not
benefit as much as the public at large, and may even be
negatively affected by such investments. These outcomes
corresponded to positions taken by different stakeholders
in national debates over the merits of additional infra-
structure investment. The aim of the study was to inform
this debate by providing data from the point of view of the
poor themselves.
The study examined perceived impacts on occupations,
household income and expenditure, the availability of
Family Family Family Family Village Village
Income Well-Being Conven- Happiness Economy Society
-ience
Asset Ownership
Stereos + +
Bicycles + +
Refrigerators + +
Gas Stoves + + +
Televisions + + + +
Telephones + + + +
Mechanical Plows + +
Radio/Cassette Player +
Transport
Travel Time to District +
Office, 1992
Length of Laterite Road +
to District Offfice, 1992
Length of Paved Road to + + +
District Office, 2001
Number of Roads to +
District Office, 2001
Other
Being Farmers +
Being In-migrants
Amount of Debts
Table 6.10. Factors Affecting Perceptions of Change Over 10 Years
+ = positive change; = negative change.
Source: Thailand study team field survey.
Factor
110 Assessing the Impact of Transport and Energy Infrastructure on Poverty Reduction
goods, household debts, education, health care, availability of
free time, safety, access to information, access to common
resources, within-community (bonding) social capital, and
outside-community (bridging) social capital. The main
results for roads and electricity are summarized in Tables
6.116.12 and discussed in the subsequent paragraphs.
Rural Transport Improvements. The question-
naire formulated this issue in terms of rural road improve-
ments. An analysis of the answers provided by respon-
dents when invited to describe the mechanisms of these
impacts showed an implicit assumption that rural road
improvements are followed by improvements in transport
services and trading activity, as well as greater personal
mobility. Table 6.11 shows the percentage of poor and
nonpoor households reporting net impacts. Statistical tests
using logistic log-linear models shows that, for most
impacts, the differences between poor and nonpoor
respondents were not statistically significant. Where their
views differed, it was sometimes not in the ways that would
be expected. A similar result was found for electricity. This
would tend to confirm the view that infrastructure, as a
public good, benefits all people more or less equally.
Most households reported that rural road improve-
ments had no significant impact on occupational choice
(but see Box 6.1). This finding was significantly stronger
Impact Result Percent of Respondents
All Households Nonpoor Poor
(n=913) (n=441) (n=454)
Occupational Change No Impact** 87.6 82.1 93.0
Household Income Increase Income** 50.7 55.7 45.4
No Impact** 44.2 41.4 47.3
Decrease Income 5.0 2.9 7.3
Household Increase Expenditure 81.9 80.5 83.1
Expenditure
Goods Availability More Goods Available 96.5 96.8 96.5
Satisfaction With Goods Satisfied 92.7 94.1 91.8
Household Debts No Impact** 90.0 87.8 92.7
Household Education Improves Education 91.9 90.5 93.1
Household Health Improves Health** 90.3 93.4 87.0
Free Time Availability More Free Time* 67.3 69.4 65.3
No Impact** 25.1 20.9 29.1
Safety Increase Safety 58.6 56.9 59.9
Decrease Safety 25.0 28.6 22.0
Access to Information Information More 92.7 93.4 92.2
Accessible
Access to Common More Accessible** 67.5 63.2 71.6
Resources No Impact 29.2 34.0 26.4
Bonding Social Capital Better Relations in 90.8 90.5 91.8
Village
Bridging Social Capital Better Relations 91.5 92.3 90.5
Outside Village
* Significant difference between poor and nonpoor households at p<0.05; **Significant difference at p<0.01.
Note: All Households includes results from 18 unclassified households.
Source: Thailand study team field survey.
Table 6.11. Perceived Impacts of Rural Road Improvements
(Percent)
Thailand Country Study 111
for the poor and ultra-poor than for the nonpoor, suggest-
ing that the nonpoor were perhaps better placed to take
advantage of the opportunities for occupational change
offered by road improvements. However, the general con-
clusion is that rural people in Thailand, including the poor,
were not likely to change their main occupations in
response to road improvements. Whether a person classi-
fied himself as a farmer, a laborer, a herder, a trader, or a
public employee was probably primarily determined by
the nature of his economic and social assets, rather than by
his transport opportunities. It would have been interest-
ing, however, to explore whether or not road improve-
ments had any impact on the occupational choices of
women, or on those of the next generation.
occupational choice discussed above, it seemed clear that
most respondents perceived an increase in opportunities
for sales or employment that would supplement the activ-
ity that they regard as their primary occupation.
Among those who felt that road improvements had
reduced their household incomes, the main reasons were
the general economic slowdown due to the Asian finan-
cial crisis, fewer jobs available, lower product prices, and
lower sales. This suggests that, especially among the
ultra-poor, a small minoritys livelihood strategies cannot
stand up to the competition introduced by road improve-
ments. Interestingly, one nonpoor respondent cited higher
wages paid as a negative consequence of road improve-
ments, while four respondents (two ultra-poor and two
Only about half of all households thought that rural
road improvements had increased their household income.
Poor households were significantly less likely to think so
than nonpoor households. Most of the rest of the respon-
dents felt that road improvements had had no impact on
their incomes. However, about 5% of all households,
including 7% of the poor and close to 10% of the ultra-
poor, felt that road improvements had actually decreased
their incomes. Respondents gave many reasons why roads
might increase incomes. The most frequently cited were
an increase in job opportunities both inside and outside
the village, higher sales of local products, and overall eco-
nomic improvement. Lower transport costs, higher prod-
uct prices, and more farm-gate sales were also mentioned.
When this response was combined with the response about
nonpoor) cited an oversupply of labor (migrants from even
poorer regions), suggesting that road improvements also
introduced greater competition in the local labor market.
A large majority of respondents felt that rural road
improvements had caused an increase in their household
expenditures. The result was slightly higher for the poor,
but this small difference was not statistically significant.
The main mechanism identified by respondents was that
rural road improvements induced more personal travel.
Others felt that they became more likely to spend on con-
sumer goods, and/or that consumer goods became more
expensive. A relatively small share of respondents cited
increases in the cost of transport or of the factors of pro-
duction. Individual respondents also mentioned the need
to buy more because of negative impacts on natural
Box 6.1. Roads and Electricity Changed My Life
Nud, 30, a villager in Wang Kata tambon, Pang Chong District, Nakhon Ratchasima Province, told his life story. He remembered that
he was born in this village, but his parents and older siblings migrated in and settled there by clearing land for farming.
When he was young, village paths were for carts only. It was very difficult and took days of travel to reach the amphoe (district
headquarters). No cars could enter the village, making it very difficult to send out sick people to get health care. Many students had to live
with relatives in the amphoe in order to go to school, and were able to see their parents only on holidays. Everyone in the village farmed, but
it was difficult to market the resulting produce; Nud and others had to pay high prices to have it transported.
Paths and cart tracks became earthen roads about 10 years ago. Cars began to appear,
transporting people to the amphoe and stu- dents to school about once or twice weekly. When
roads became partly laterite, however, Nud invested in a truckstill the only one in Wang
Katausing it to transport his own and other villagers products. After realizing that the income
from driving his truck was more reliable, Nud left the farming to his wife and now drives to and
from the amphoe every morning, earning 25 baht per passenger.
When electricity recently also became available in the village, Nud opened a car repair
shop, where he works every afternoon. So elec- tricity has given him two additional career oppor-
tunities. However, the electricity-related ex- penses have also increased, and Nud is concerned
about his daughter spending too much time watching television.
Nud is grateful for the roads and electricity that have brought new economic opportunities. Things are better than before, and the future
for the next generation is even brighter. He foresees that his children will not work in the village anymore, but will seek work further afield.
Source: Thailand study team.
112 Assessing the Impact of Transport and Energy Infrastructure on Poverty Reduction
resources, increased educational expenses, and the need
to pay for road maintenance.
A small minority (about 3% of the sample), predomi-
nantly nonpoor, felt that road improvements decreased
household expenditure. In these cases, the reasons cited
included lower passenger and goods transport costs,
decreased need to travel to buy goods, lower product prices,
lower expenditures on gasoline, and fewer people at home
because of migration to find jobs elsewhere.
Respondents overwhelmingly confirmed that more
goods were available in local markets as a result of trans-
port improvements, and that this was a positive impact for
both the poor and nonpoor. The primary reason for satis-
faction with this result was the reduced risk of shortages, a
serious problem for all (but especially for the poor) in
remote rural areas. Respondents were also happy to be
able to choose from a wider selection of goods. Other
reasons mentioned included more shops, cheaper goods,
more good-quality food available, and greater convenience
(including savings in transport time). The very small
minority (less than 2% of the sample) that thought having
more goods locally available was not a good thing cited
the greater availability of expensive goods and the conse-
quent temptation to overspend.
The study team particularly wanted to examine the
relationship between rural infrastructure improvements
and household debts. According to one popular view in
Thailand, poor families are in debt because the country
has been following the Western development ideology,
based on infrastructure investments. In other words, roads
and electricity promote a lifestyle that causes overspend-
ing by the poor, bringing debts to poor communities. This
notion is roundly rejected by the findings of the study.
Although about 80% of the surveyed households did
indeed have debts, 90% of respondents saw no connection
between the debts and rural roads (or electricity). This
view was even more strongly expressed by the poor. Most
of the household debt reported in the survey was related to
investment in agricultural activities. Among the 10% of
the sample that thought road improvements did lead to
increased household debt, about half attributed this to
overspending, 30% to borrowing for investment purposes,
and 10% to consumer debt incurred in order to imitate
others (adopt a modern lifestyle).
20
Respondents had a strongly positive view of the impact
of roads on education. Poor households in the survey held
this view even more strongly than nonpoor households,
although the difference is not statistically significant.
Almost all respondents attributed this impact to the greater
convenience of travel to school. A few respondents also
mentioned the availability of more sources of information
and the effects of increased income on household educa-
tion expenditures. Of those few who did not see a positive
impact of roads on education, most felt that they had no
net impact.
Similarly, survey respondents strongly viewed road im-
provements as having a positive impact on family health.
In this case, however, the poor were significantly less likely
than the nonpoor to report such positive impacts. The main
reason given was more convenient traveling to health care
centers, followed by prompt access to health care, which
may reflect the greater ability of health care providers to
reach their clients in their villages or homes. Interest-
ingly, quite a number of respondents (67, or 8% of the
total) mentioned reduction in dusta result of road pav-
ingas a significant source of positive health impacts. A
few respondents also mentioned the effects of increased
income on health. About 3% of the sample identified nega-
tive impacts, mainly in connection with the dust generated
on laterite roads. A few respondents also mentioned
vehicular air and noise pollution.
Views about road impacts on the availability of free
time were rather mixed, although little variation between
the views of the poor and the nonpoor emerged. About
two thirds of the sample felt that road improvements
resulted in more free time, while about one fourth felt that
there was no net impact, and the remainder saw a net nega-
tive impact. The main reasons for more free time were
20
This type of consumer debt may be related to the purchase of
television sets, which are widely available in rural Asia. From
another perspective, such expenditure could be regarded as an
investment in information (see results for electricity on p. 118).
For survey respondents, road improvements mean more
convenient
i.e., fastertravel to health care centers.
Thailand Country Study 113
that people were able to spend less time traveling
(implying a saving in travel time on regular trips), and
the greater availability of goods in the village (also sav-
ing travel time). Among those who saw a negative
effect, most felt that they now had to work harder, pre-
sumably to meet increased expenditures. Only a very
small minority felt that they spent more time traveling
after road improvements took place.
Responses were also mixed concerning road impacts
on safety. While slightly more than half of respondents
(in all categories) felt that roads increased safety, a sig-
nificant minority (2030%) felt that the net impact of
roads on safety was negative. Interestingly, the ultra-
poor were more likely to perceive positive impacts and
less likely to perceive negative impacts on safety than
either the nonpoor or poor households closer to the pov-
erty line. The main reason that road improvements were
perceived as improving safety was the greater accessi-
bility of villages to the police. This reason was particu-
larly important for the ultra-poor, suggesting a new
dimension of their vulnerability in isolated rural com-
munities. Less danger from wild animals and fewer
accidents due to improved road conditions were also
mentioned. Among those who thought that road
improvements reduced safety, the main reason given was
that more roads induced more traffic accidents. More
frequent thefts and easier access of outsiders to the com-
munity were also safety concerns. Such concerns were
predominantly expressed by nonpoor respondents.
Respondents in all income classes strongly agreed
that rural road improvements increased access to infor-
mation. Those who did not share this view mainly felt
that roads had no impact in this area. The main mecha-
nism of impact transmission in this case was overwhelm-
ingly believed to be the greater ease of personal travel
outside the community. Only a very small number of
respondents mentioned the greater availability of news-
papers, postal services, or telecommunications, or the ar-
rival of newcomers bringing new information into the
community.
With respect to access to common resources, about
two thirds of the respondents perceived a positive impact,
with a significantly more positive response among the poor
than among the nonpoor. Most of the remaining respon-
dents saw no net impact on access to common resources.
The reason given by almost all the respondents was greater
road access to common resource areas. Only 3% of the
sample saw a net negative impact, and this was mainly
attributed to outsiders getting greater access to common
resources that were felt to belong to the village. It may be
noteworthy that negative road impacts on common
resources were mostly perceived by nonpoor respondents.
Respondents agreed overwhelmingly (over 90% in all
cases) that rural road improvements led to better social
relations, both within rural villages and between those vil-
lages and the outside world (bonding and bridging
social capital). About 7% perceived no impact, and only
about 2% thought roads had a negative effect on social capi-
tal. The main reason given for bonding effects was the
greater ease of traveling within the village. Other reasons
were that road improvements facilitated group meetings
and mutual help, as well as providing more free time for
social activities.
More convenient travel was cited as the main reason
why road improvements facilitated bridging social capital.
Having more business connections with outsiders was also
mentioned. Those few who felt that roads had a negative
effect on social capital (both bonding and bridging) said
that generally people had become more selfish, and that
having to work harder to meet increased expenditures meant
that they had less time for others. Poor and nonpoor house-
holds did not differ significantly on this subject.
Rural Electrification. The results for rural elec-
trification, in general, closely parallel those for rural roads
(Table 6.12). Like roads, rural electrification was per-
ceived as having little impact on occupational change, par-
ticularly for poor households. Only about 40% of all house-
holds, somewhat less than for rural roads, believed that
rural electricity had helped increase their income. Poor
households were slightly but significantly less likely to
experience an income increase and more likely to experi-
ence an income decrease than nonpoor households. The
majority perceived no income impact.
For those who said they had experienced a change, the
primary mechanisms were more jobs available both in the
Road paving has a positive health impact by reducing dust.
114 Assessing the Impact of Transport and Energy Infrastructure on Poverty Reduction
village and outside, and overall economic improvement.
Higher product sales was also a reason for improved house-
hold income.
21
Only a few respondents cited the possibil-
ity of starting a home-based business and receiving higher
prices for local products or higher wages. Others men-
tioned the possibility of working for longer hours. Elec-
tric water pumps were also cited as time-saving devices that
released household energies for additional production.
The poor and the nonpoor shared these views. How-
ever, the nonpoor were distinctly more likely to mention
increasing jobs within the village as mechanisms for
income improvement, and distinctly less likely to men-
tion increasing jobs outside the village. This finding sug-
gests that the nonpoor were more likely to be able to invest
and capture the benefits of electricity through local busi-
nesses, while the poor depended on other investors to cre-
ate electricity-related job opportunities. Those who said
that electricity had a negative impact on their income were
predominantly from the ultra-poor group. They attrib-
uted this effect to a general economic slowdown and fewer
jobs being available (Box 6.2).
In contrast to the limited impacts on income, a higher
share of households perceived that electricity increased
their household expenditure. This was especially true for
the upper range of the poor and for the nonpoor, but less
so for the ultra-poor. The main reason, not surprisingly,
was higher electricity bills. Ultra-poor households cited
shis reason slightly less frequently, presumably because
they were less likely to have an electricity connection.
22
Another reason, mentioned by 15% of respondents, was
that electricity encourages other spending, presumably on
22
In the rural sample, of the 33 households without an electricity
connection, 20 were ultra-poor, 2 were poor, and the other 11
were nonpoor.
21
This may be linked to the ability to use electricity to increase irriga-
tion. See paragraph on access to common resources on p. 120.
Impact Result Percent of Respondents
All Households Nonpoor Poor
(n=913) (n=441) (n=454)
Occupational Change No Impact** 91.4 88.9 94.1
Household Income Increase Income** 39.6 40.8 37.7
No Impact** 56.5 57.6 56.0
Decrease Income** 3.9 1.6 6.3
Household Increase Expenditure 87.3 88.2 86.5
Expenditure
Household Debts No Impact 86.0 82.8 89.4
Household Education Improves Education 87.1 88.9 85.8
Household Health Improves Health 86.2 89.4 86.8
Free Time Availability More Free Time 68.3 71.7 65.7
No Impact 25.1 22.2 27.2
Safety Increase Safety 86.7 86.0 87.1
Access to Information Information More 93.4 95.9 91.1
Accessible**
Access to Common More Accessible** 55.6 58.9 52.7
Resources No Impact 41.8 38.4 44.5
Bonding Social Capital Better Relations in 78.6 81.4 75.6
Village
Bridging Social Capital Better Relations 78.9 78.0 79.3
Outside Village
* Significant difference between poor and nonpoor households at p<0.05; **Significant difference at p<0.01.
Note: All Households includes results from 18 unclassified households.
Source: Thailand study team field survey.
Table 6.12. Perceived Impacts of Rural Electricity Improvements
Thailand Country Study 115
appliances. A smaller group felt that electricity caused
goods to become more expensive. Only a few individuals
felt that electricity lowered costs. Half of them mentioned
the cost of lighting, and the others did not specify the costs
concerned.
As with road improvements, survey respondents gen-
erally rejected the suggestion that electricity improvements
had anything to do with their debts. However, a minority
(about 14%) did feel that electricity had increased their
debts. This effect was more often felt among the nonpoor
than among the poor. This finding suggests that the poor
(and especially the ultra-poor) were more careful about
incurring consumer debt than are the nonpoor, who can
afford to take greater risks and spend a larger share of
their income on nonessentials.
Respondents clearly felt that electricity improvements
had a positive effect on household education. The main
reason, cited by 72% of respondents, was the availability
of light for doing homework in the evening. While no
significant difference emerged on this point between the
poor and the nonpoor, the impact on the ultra-poor was
slightly less marked than the impact on the nonpoor and
the less poor. Most other respondents felt that electricity
had no net effect on education. About one fourth of all
respondents mentioned getting more information from
television and radio. Others cited more modern educa-
tional equipment, the ability to acquire computer skills,
the ability to translate time saved on household tasks into
time spent on education, and the ability to spend more
time reading. Among the few who felt that electricity had
a negative educational effect, the great majority of those
who gave a reason blamed this effect on children watching
too much television.
The survey respondents also agreed that electricity had
a positive impact on family health. This impact was per-
ceived somewhat more strongly by the nonpoor and less
strongly by the ultra-poor. Again, most of those who did
not share this view felt that electricity had no net impact on
health. The main reason given for a positive impact was
that lighting is good for eye health. Better food preserva-
tion through refrigerators was also an important conse-
quence. Others mentioned the effects of increased income
on health, reduced heat stress through use of electric fans,
and less indoor air pollution. Secondary effects of better
lighting include reduced dangers from poisonous animals
and the ability to provide better care to the elderly and ill
during the night. As for the few individuals (half of them
ultra-poor) who felt that electricity had negative effects
on health, the main reasons were insufficient sleep and eye
problems from watching too much television, and health
care opportunity costs due to over-spending on electrical
appliances and the need to spend more time working.
The survey results regarding impacts of electricity on edu-
cation and health generally seemed to confirm the
hypothesis that positive effects were associated with
access to electricity for both the poor and the nonpoor. The
fact that the ultra-poor seemed to benefit somewhat less
may result from the fact that fewer of the ultra-poor house-
holds in the rural survey sample had access to electricity.
About two thirds of all respondents said that electric-
ity provided them with more free time. Poor households
were somewhat, but not significantly, less likely to per-
Box 6.2. It is Easier to Earn Income Now
Uncle Tong Luan, 50, a villager in Klong Muang tambon, Pak Chong District, Nakhon Ratchasima Province, is now herding milk
cows, a career he started about 10 years ago when electricity first came to the village and brought benefits to the villagers. The privately
owned milk center, which uses electricity to extract milk from the cows, was established at the village entrance. Villagers like Tong Luan
started raising milk cows and now earn a higher, more stable income. Moreover, raising cows is not hard work, so even older people like
Tong Luan can earn a decent income.
Before, he was a farmer, just like everyone else. But Klong Muang also lacked roads, so farming was not very lucrative: much
time was consumed in transporting products, and if transport was lacking, the villagers had to sell their products at the same time,
the time when outsiders came to buy the products. That led to depressed prices and less income. So roads helped to raise selling
prices.
When the roads came, the villagers had more options for selling their crops and selling prices rose. Realizing the benefits they
had gained, the villagers always worked together to ensure that road maintenance is carried out. However, Tong Luan feels that the
government should improve the condition of the roads, since earthen and laterite roads cannot withstand heavy rains.
Roads also interact with electricity. Tong Luan notes that better roads make transporting milk easier, especially for him, because
he lives far from the village center. He was one of the last villagers to get electricity because he lives so far away; Tong Luan believes
that the better-off families in the village have benefited more from electricity, since they were electrified earlier.
Source: Thailand study team.