Assessing the Impact of Transport and Energy Infrastructure on Poverty Reduction - Chapter 7 pps
Bạn đang xem bản rút gọn của tài liệu. Xem và tải ngay bản đầy đủ của tài liệu tại đây (1.11 MB, 42 trang )
India Country Study 135
Chapter 7
INDIA COUNTRY STUDY
National Context
I
ndia is a very large country with a population of more
than 1 billion, representing approximately one third
of the population served by ADB and one sixth of the
world population. Its gross national income per capita in
2001 was about $460, equivalent to $2,450 at 1993 purchas-
ing power parity.
24
This places India among the lowest-
income countries in the world. The country is densely popu-
lated (about 350 persons per square kilometer [km
2
]), and
still predominantly rural. According to 1997 data, 44 million
people in India were living below the international extreme
poverty line of $1 per day, and 86 million people were living
on less than $2 per day. Inequality in India is slightly higher
than in other South Asian countries, with a Gini index of 37.8.
Social welfare indicators are moderate: the average life
expectancy is 63 years and the adult illiteracy rate is 43%.
A balance of payments crisis in 1991 temporarily
slowed Indias economic growth and triggered a process
of widespread economic policy reform. This process
relied heavily on privatization of public enterprises and
reduction of public expenditures and public debt. The
impact of these reforms on poverty reduction is the subject of
much discussion. Many of the reforms were not fully imple-
mented, and public revenues declined along with expendi-
tures. The response of the private sector was not as strong
as expected. India now needs to achieve rates of more than
7% annual real gross domestic product (GDP) growth in
order to sustain progress in reducing poverty. The target
for the Tenth Five-Year Plan (20022007) is an annual GDP
growth rate of 8%.
Poverty Reduction
India has made steady progress in reducing poverty
since the mid-1970s, paralleling the growth of agricul-
tural output and public investment in infrastructure and
human capital development (World Bank 2000b, updated
in World Bank 2003c). In the last decade, however, the
rate of poverty reduction has slowed, notably in the rural
areas where over 70% of the poor population live, and
especially in the poor states of Indias Northeast. These
states have experienced slower growth, fiscal problems,
inappropriate incentive frameworks, and problems in gov-
ernance, all of which have reduced the maintenance of
infrastructure and the provision of social services and pov-
erty programs to the poor. Agricultural subsidies, which
in the past have promoted growth, now seem less effective,
while their costs are limiting the ability of states to sup-
port social spending. The proportion of people living on
less than $1 a day declined from 46% in the early 1990s to
39% in 19992000.
Because of its size, domestic research capacity, and good
socioeconomic data, India has always been of great interest
to students of development. Much of the thinking that
helped development planners to shift from considerations
of economic growth alone to a greater focus on poverty
reduction originated in India. Concern about the rela-
tionship between growth and poverty reduction stimulated
a major World Bank study covering Indias 15 major states
and using data from 20 household surveys conducted
between 1960 and 1994 (Ravallion and Datt 1999). The
study measured the elasticities of poverty in relation to
farm yields, nonfarm output, and development expendi-
tures in different sectors. The study showed that the
effects on poverty of changes in agricultural productivity
did not differ significantly from one state to another. The
effects on poverty of changes in nonfarm (urban and rural)
output, however, varied considerably, depending in part
on rural infrastructure endowments. The growth process
in states with lower farm productivity, greater disparity
between urban and rural living standards, and lower lit-
eracy rates was less pro-poor.
A follow-up paper (Datt and Ravallion 2002) com-
pared progress on poverty reduction in the prereform and
postreform period to ask why Indias success in economic
24
Data in this paragraph are taken from World Bank (2003a).
136 Assessing the Impact of Transport and Energy Infrastructure on Poverty Reduction
growth has not done more for the poor. An answer was
found in the sector and geographical distribution of
growth, which has not taken place in the states where it
would have the greatest impact on poverty. States with rela-
tively low levels of rural infrastructure endowments and
education were less able to translate growth into poverty
reduction. Thus, future investments should focus on
redressing current inequalities between urban and rural
infrastructure and investment in human capital.
A recent ADB review, using Indias national poverty
line, estimates that the number of poor in India declined
during the 1990s from about 287 million in 19931994
to about 274 million in 19992000, including 210 mil-
lion in rural areas and 64 million in urban areas (Sundaram
and Tendulkar 2001). These figures correspond to a de-
cline in the headcount ratio from 34% to 29% in rural
areas and from 26% to 23% in urban areas during the
reform period. This study suggests that more poverty re-
duction took place during the reform period than in the
10-year period immediately preceding it, when rural pov-
erty was reduced but urban poverty increased, so that the
absolute numbers of the poor remained about the same.
Another positive development in the postreform decade
has been a widespread increase in adult literacy, although
more so for men than for women.
Indias poverty reduction strategy includes more and
better-targeted spending on education and health care ser-
vices for the poor, as well as on rural infrastructure,
accompanied by regulatory reforms to improve the cli-
mate for investment and encourage employment of the
poor. The strategy explicitly proposes cuts in irrigation
and energy subsidies and privatization of the power sector
to reduce the unsustainable debt of the poorer states and
to release funds for social and infrastructure spending.
The possibility of seeking greater private sector partici-
pation in infrastructure investment has also been raised in
this context.
At the national level, three different poverty alleviation
programs are targeted to the rural poor. Two are labor-based,
employment-generating public works programs; the third
provides finance for self-employment in small enterprises.
These programs are complemented by a policy environment
that is intended to promote private investment in labor-
intensive enterprises in agriculture, industry, and services. In
addition to these central government initiatives, Indias dif-
ferent states play an active part in creating the policy environ-
ment and providing public investment for economic growth
and poverty reduction. Significant variation in performance
at the state level may be related to significant variation in
poverty reduction outcomes across the states.
Transport Sector Policy
In the past, Indias public sector made most infrastruc-
ture investments, including both central and state govern-
ments. However, poor asset management and maintenance,
as well as the inability to recover the costs of supplying these
services from the users, led to large inefficiencies and large
losses in these sectors. Despite some initiatives to attract
private sector participation in infrastructure investment,
such participation remains low. The key problem prevent-
ing the private sector from investing is the lack of an appro-
priate regulatory framework that allows for cost recovery
through user charges while keeping services affordable to
the poor.
25
Recent major programs in road development include
the Golden Quadrilateral project to upgrade trunk roads
connecting the four major metropolitan areas of Delhi,
Mumbai, Chennai, and Kolkata; the National Highways
Development Project; and the Prime Ministers Rural
Road Program. ADB and the World Bank have been sup-
porting each of these programs. A Central Road Fund was
created in 2000, funded by taxes on gasoline and diesel
fuel. The diesel fuel tax is allocated to the development
and maintenance of national highways, state roads, rural
roads, bridges, and railway lines, including safety work on
unmanned railway crossings. A model concession agree-
ment has been developed for large privately funded road
construction projects.
India has one of the largest railway systems in the world,
with a network of over 63,000 km. Railways are constructed,
maintained, and operated by Indian Railways. Like any
other public utility, Indian Railways runs some uneconomic
operations due to social obligations (second-class passen-
ger service and movement of essential commodities). These
activities are cross-subsidized by profit earned through
freight services and higher classes of passenger travel. Partly
due to this cross-subsidization and increases in administra-
tive expenses, Indian Railways has experienced an increas-
ing financial burden and a decline in transport sector mar-
ket share. As a result of these problems, the Ministry of
Railways has established a reform program with a view to
operating railways on more commercial lines, moderniz-
ing the railway system, and expanding its capacity to serve
the emerging needs of the growing economy.
India has a long coastline (about 7,000 km) and many
ports of entry: 12 major ports and 184 intermediate and
minor ones. Given the dominant role of containers in
25
This discussion is based on Government of India (1996).
India Country Study 137
international trade, the capacity to handle container traf-
fic is central to the future of Indias ports. The majority of
containers that move through the country are transshipped
through the ports of Colombo (Sri Lanka), Singapore,
Dubai, and Salalah (Oman). This results in delays and
much higher transaction costs. Therefore, it is proposed
to develop hub ports on the east and west coasts of the
country and an international container transshipment ter-
minal in Cochin.
Current policy encourages private participation in new
port construction and operation, either in joint ventures
with state or national authorities or as a completely pri-
vate operation. Many initiatives have been taken to attract
private sector investment in ports. More than 40 projects
involving an investment of over Rs1 trillion
are at various
stages of development. To corporatize major ports, the
Major Port Trusts Amendment Bill (2001) was intro-
duced in the Parliament.
Energy Sector Policy
In the past, the Government of India has invested
heavily in electricity infrastructure and in subsidizing
service to agricultural and domestic consumers. Electric-
ity services, from power generation through transmission
and distribution, were provided by State Electricity Boards
(SEBs). These boards were often subject to local political
influence. Consequently, they found it difficult to collect
revenues or to charge rates that would recover their costs.
Excessive borrowing in the energy sector by both the cen-
tral and state governments was a contributing factor in the
economic crisis of the 1990s. Following the crisis, the
central Government set up an Expert Group on Power to
review the situation and make policy recommendations.
The main lines of the proposed reform included unbun-
dling energy services and privatizing them where pos-
sible. The role of the SEBs was to be transformed into a
regulatory commission ensuring that the public interest is
served by privately operated utilities.
State-level regulatory commissions were created in 22
states, and a scheme was developed to resolve cross-debts
between the states and the central utilities. To provide
financial assistance to states for undertaking renovation
and modernization programs, a new plan known as the
Accelerated Power Development Programme was
launched. State governments are being encouraged to sign
memoranda of understanding with the central Govern-
ment on energy sector reform. At the time of writing, 21
state governments had agreed to undertake reforms in a
time-bound manner. However, the SEBs continued to be
subject to political influence, so that tariff orders issued
by the regulatory commissions were not always fully imple-
mented. The central Governments objective was to pro-
vide Power for All by 2012, by progressively connect-
ing smaller villages to the network.
Case Study Context:
Gujarat State
Gujarat is one of Indias more progressive states. It
has a successful record of poverty reduction. Located in
the northwest part of the country, Gujarat has a strong
entrepreneurial tradition and a history of being open to
external trade and private investment. Being on the coast,
it offers a variety of possibilities for study of different trans-
port and energy interventions (road, rail, ports and ship-
ping, rural electrification) that have taken place over the
last 10 years. It also has a strong tradition of cooperative
action and community initiative. Gujarat was the home
state of Mahatma Gandhi, Indias moral leader during
the struggle for independence. Recently, however, it has
India has a massive program for providing rural habita-
tions with all-weather road connectivity.
138 Assessing the Impact of Transport and Energy Infrastructure on Poverty Reduction
been torn by ethnic violence and by political and religious
strife between Muslims and Hindus, mainly concentrated
in the urban areas. In rural areas, Hindus and Muslims
generally manage to live together peacefully.
The total area of the state is about 196,000 km
2
, with a
population of about 50 million. The population density, at
255 per km
2
, is significantly lower than for the country as
a whole. About 63% of the population lives in rural areas,
compared with the national average of more than 72%.
India Country Study 139
Adult literacy is close to 70%, for both men and women,
which is above the national average of 65%. Considerable
variation can be found within the state in terms of terrain,
population density, and production patterns. The north-
ern part of the state bordering Pakistan is a near-desert.
Scheduled tribes live in the northeastern foothills. In the
central and southern parts of the state, however, are found
a densely developed transportation network and intense
economic activity, including both agriculture and indus-
try in a rapidly urbanizing environment.
Gujarat State is the sixth largest state in India in net
domestic product. In per capita income, however, the state
ranks fourth, behind Maharashtra, Punjab, and Haryana.
Only 17% of the state domestic product is accounted for
by the primary sector, mainly agriculture.
Only 34% of the cropped area is irrigated;
the rest relies on the monsoon rainfall.
As a consequence, dryland crops (ground-
nuts, cotton, and coarse cereals) domi-
nate the states cropping pattern. In
recent years, the share of the primary sec-
tor has declined in favor of the secondary
(industry) and tertiary (services) sectors.
The state ranks first nationally in the pro-
duction of cotton and groundnuts, and
second in the production of tobacco. It is
also known for ushering in the dairy revo-
lution in the country. The industrial struc-
ture of the state is diversified, including
chemicals, petrochemicals, fertilizers,
engineering, and electronics. Chemicals,
chemical products, and textiles dominate
industrial output. The state is a major
producer of inorganic chemicals such as
soda ash and caustic soda, as well as phosphate fertilizers
About 60% of the countrys salt production takes place in
Gujarat. The state also has the countrys largest petro-
chemical complex, located in Jamnagar district.
In the past, the state invested heavily in infrastructure.
The share of transport and energy investment in the Sixth
Five-Year Plan (19801985) was 35% of all public invest-
ment; in the Seventh Plan (19851990) it was 31%, and in
the Eighth Plan (19901995), 29% . More recently, how-
ever, a shift in emphasis has taken place toward providing
social services. In the Eighth Five-Year Plan (19921997),
only 17% was allocated for transport and energy invest-
ment, and in the Ninth Plan (19972002) the amount
came down to 14%. This, however, still represented an
investment of about Rs48 billion (more than $1 billion).
Almost all of the villages in the state have been connected
to the electricity grid for more than 10 years; about 94%
are also connected by roads to the state and national high-
way network.
At present, private participation in infrastructure
investment is being encouraged. The Gujarat Infrastruc-
ture Development Board has prepared a master plan for
the state, in order to match supply with forecast demand in
nine sectors: roads, rail, ports, airports, urban infrastructure,
industrial parks, water, gas grids, and telecommunications.
About 383 projects have been identified, involving a pro-
jected investment of Rs11.7 trillion ($252 billion), a
major share of which is expected to come from the private
sector. Some road projects were already being constructed
under public/private partnerships, including the widening
of the Vadodara-Halol and Ahmedabad-Mehsana roads from
two to four lanes, and the construction of bridges across the
Narmada and Mahi rivers. Roads leading to industrial loca-
tions were also being upgraded, with significant financial par-
ticipation by the beneficiary industries.
Transport
Road policy in Gujarat focuses on imparting connec-
tivity to all villages by all-weather (pucca) roads, and
developing an adequate and efficient road system to meet
all transportation needs. Gujarat had 73,600 km of roads
in 2000/01, up from 67,100 km in 1990/91, an average
growth rate of about 700 km per year. State and national
highways accounted for 29% of the network, district roads
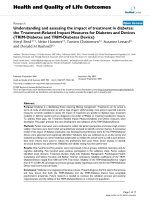
Rapid growth in motor vehicle ownership is straining the Gujarat state
governments capacity to maintain and enhance the road network.
140 Assessing the Impact of Transport and Energy Infrastructure on Poverty Reduction
for 43%, and village roads for 28%. These shares did not
change significantly over the 10-year period. A remark-
able increase also took place in the number of registered
motor vehicles in the state, from 1.84 million in 1990 to
5.58 million in 2001. About 70% of these vehicles were
two-wheelers (motorcycles and mopeds). This rapid
growth in vehicle ownership has strained the governments
capacity to maintain and enhance the core road network.
Congestion is rising, and although Gujarats existing road
network is qualitatively rated as the best in the country, it
is insufficient to meet present demand and is in need of
major upgrading. To tackle the various problems, the gov-
ernment formed the Gujarat Roads Development Corpo-
ration, to undertake construction and maintenance of roads
and bridges throughout the state.
In 2000, the Gujarat State Road
Transport Corporation (GSRTC)
and private bus companies provided
passenger transport services, while all
trucking was privately owned. In
March 2000, the share of the private
sector in the bus fleet was about 74%,
with GSRTC accounting for the rest.
GSRTC, with 58,000 employees,
operates 9,000 buses and runs large
annual losses. In addition to being
overstaffed, GSRTC was constrained
to operate on uneconomic routes,
often on unimproved roads that im-
pose high operating costs. Revenues
have not permitted timely repairs or
renewal of the vehicle fleet. Conse-
quently, most of the state buses were
old and unreliable, if not actually un-
safe.
Gujarat has a coastline of about
1,600 km. It has a major port, Kandla, and about 40 inter-
mediate and minor ports that process 80% of the tonnage
handled by the countrys intermediate and minor ports.
The Gujarat Pipavav Port Limited at Pipavav in Saurashtra
district and Gujarat Adani Port Limited at Mundra in
Kuchchh are the countrys first green field ports, devel-
oped in joint venture between the public and the private
sector on a build, own, operate, and transfer (BOOT)
basis. The states port policy, established in 1995, identi-
fied 10 more potential sites, four of which were being
developed under public-private partnerships and six of
which were to be exclusively for the private sector.
Imports accounted for the bulk of the traffic passing through
ports in the state, but exports also accounted for a significant
share. The volume of cargo handled by Gujarats ports has
grown rapidly, although this growth was temporarily inter-
rupted in 2001 by the consequences of a severe earthquake.
Alang, one of the largest ship-breaking yards in the world, is
also located in Gujarat State.
Energy
Gujarat was one of the first states in India to establish
an Electricity Regulatory Commission, in 1999, although
other states have been more proactive in implementing
power sector reforms. A plan to restructure and unbundle
the services provided by the Gujarat Electricity Board
(GEB) was drawn up. As a step in this direction, a sepa-
rate transmission company was incorporated as a GEB
subsidiary. ADB has supported these reforms through the
Gujarat Power Sector Development Programme. Gujarat
announced a new power policy and a Power System Mas-
ter Plan, which was to encourage further private sector
participation in generation, transmission, and distribu-
tion. Installed electrical capacity in the state was 8,600
MW by the end of March 2001, nearly twice the installed
capacity 10 years previously. Gross generation of electric-
ity more than doubled during the period. GEB generated
about half of this amount; the rest came from central and
private sources. Since 1997, the private sector has signifi-
cantly increased its share in installed capacity and power
generation.
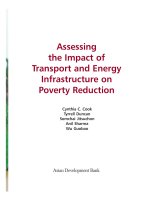
Gujarat, which has a coastline of 1,600 miles, has acquired two new privately
owned ports, one of which is at Mundra.
India Country Study 141
About 45% of the electricity generated was reportedly
consumed by the agriculture sector. This share may be
overstated, however, as substantial subsidies were provided
for agricultural power and its use was not metered; hence,
utilities underreported the systems actual distribution
losses by ascribing a significant portion of nontechnical
losses and thefts to agricultural power supply. Industry
consumed about 29%; the remaining 12% went to domes-
tic uses. The backlog of applications for agricultural con-
nections was large and growing. A scheme was developed
to give priority to applicants who accept the installation of
meters. About three fourths of all agricultural connec-
tions were being installed under this scheme.
The state has reached its goal of 100% electrification
of rural villages.
26
In fact, practically all villages had been
reached by electricity before 1991, i.e., before the begin-
ning of the period covered by this study. Unserved ham-
lets in some villages were being electrified under the Tribal
Area Sub Plan, financed by the state, and Rural Electrifi-
cation Corporation schemes. The state was also providing
grant funding for electrification of border areas in
Kuchchh, Banaskantha, and Patan districts. Under the Jyoti
Gram Yojana community development program, villages
could choose to invest their block grants in a local energy
supply system. Given the difficulties of assuring a reliable
supply of grid electricity in rural areas, the Gujarat En-
ergy Development Agency undertook to promote new and
renewable sources of energy. It had an Integrated Rural
Energy program providing parts of the state with a range
of energy-efficient technologies.
Poverty
Gujarat witnessed a significant decline in poverty over
the past two-and-a-half decades. Between 1973/74 and
1999/2000, poverty ratios in the state dropped from 52.6%
to 15.6% (urban) and from 46.4% to 13.2% (rural). Much
of this decline took place between 1987/88 and 1999/2000.
As a result, the state had the fourth best record of poverty
reduction in the country, behind Jammu and Kashmir,
Kerala, and Rajasthan. Gujarat also ranked sixth among
the states in terms of the Human Development Index,
which captures other dimensions of socioeconomic wel-
fare. Significantly, urban poverty is now more widespread
than rural poverty in Gujarat. This can be attributed to the
migration of poor rural households within the state and
from other states in search of employment, especially to
urban centers from drought-prone areas with little hope
of improving agricultural productivity (Kundu 2000).
Gujarat still shows significant rural-urban disparities in
per capita consumption expenditure, life expectancy,
infant mortality, and formal education.
Study Districts
An analysis of poverty reduction performance at the dis-
trict level was conducted to determine the districts to be cov-
ered by this study. Based on data from the National Sample
Survey (NSS) conducted in 1987/88, 1993/94, and 1999/
2000, districts were classified into three groups: those that
had achieved significant poverty reduction over the period,
those with a persistently low incidence of poverty, and those
with a persistently high incidence of poverty. State poverty
lines for urban and rural areas were used to determine the
poverty headcount ratio for each district.
27
Sample districts
were then selected from each group in consultation with state
government officials. Three districts were selected for the
study: Jamnagar, which achieved very high poverty reduction
in both periods; Bharuch, where poverty was relatively low at
both the beginning and the end of the decade; and Panchmahal,
the only district in the state with persistently high poverty.
Kuchchh District, where significant poverty reduction took
place mainly between 1993/94 and 1999/2000, was added to
the sample in order to include a port project in the study.
Jamnagar. Jamnagar District is located on the south-
ern side of the Gulf of Kuchchh. The district is made up of
a low coastal plain broken by hills and sand dunes. It
receives only limited rainfall. Historically, Jamnagar was
one of the most important of the princely states in
Saurashtra. It is predominantly Hindu but also has a popu-
lation of Muslims, Jains, Christians, Sikhs, and Buddhists.
A relatively small share of the population belongs to
scheduled castes (untouchables), and tribals are virtu-
ally absent. The district is home to more than 1 million people,
about half of whom live in Jamnagar City and 15 major towns.
The other half live in about 700 rural villages. The main
language spoken is Gujarati, but Kachchi speakers are
27
The Gujarat state poverty lines for 1999/2000 were Rs318.94 per
capita per month for rural areas, and Rs474.41 per capita per month
for urban areas, corresponding to $82 (rural) and $122 (urban) in
annual consumption expenditure.
26
With the exception of 88 nonfeasible villages in remote areas,
with periodic flooding, heavy forest cover, and so on. Clearly these
are also poor, disadvantaged, and vulnerable communities.
142 Assessing the Impact of Transport and Energy Infrastructure on Poverty Reduction
also present (about 5%). Jamnagar District has a 200-km
coastline and is well endowed with infrastructure. It has
the countrys largest petrochemical complex, as well as
local industries such as brass works and textiles. The pov-
erty level in Jamnagar District was 32% in 1987/88. By
1993/94 it had dropped to 16%, and by 1999/2000 it was
less than 5%.
Bharuch. Bharuch District is located in the southern
part of the state, in a densely populated and agriculturally
productive area. Bharuch City is one of the oldest seaports
in India, located at the mouth of the Narmada River on the
Gulf of Khambat. It became an important Buddhist center
in the 7th century, and under the Rajput dynasty (750
1300 C.E.) it was the chief port of West India. Exports
include cotton, wheat, and timber, as well as industrial prod-
ucts such as textiles and other manufactured goods. Pov-
erty levels in Bharuch District were already low in 1987/88
(14%), and by 1999/2000 had been reduced only slightly
further (to 11%).
Panchmahal. Panchmahal District is located in the
eastern part of the state, on the border with Rajasthan.
The topography is hilly to mountainous and soils are rela-
tively poor, although rainfall is usually adequate for dry-
land agriculture. A relatively high proportion of the popu-
lation comes from hill tribes and has limited access to
agricultural land. Panchmahal is the only district in
Gujarat where poverty is still very high (38%, or nearly
three times the state average in 1999/2000). Although
Panchmahal has received some infrastructure investments
recently, the rate of poverty reduction in this district is still
very low.
Kuchchh. Kuchchh District is located on the north
side of the Gulf of Kuchchh. It has an extensive coastline
and has become the site of new port development, includ-
ing the port of Mundra, whose impact is assessed in this
study. Much of Kuchchh District receives low and irregu-
lar rainfall; access to water is always a problem. To the
north it is bordered by the Rann of Kuchchh, a semi-desert
area known for its wildlife refuge. Kuchchh is another dis-
trict that achieved a good performance in poverty reduc-
tion over the past decade. In 1987/88 poverty in Kuchchh
District was over 40%; by 1999/2000 it had been reduced
to 16%. However, Kuchchh suffered more than other dis-
tricts in Gujarat from the effects of the 2001 earthquake,
which disrupted transport services and posed problems
for the delivery of emergency assistance.
Methodology
Definition of Poverty
The case study employed the definition of poverty used
in national surveys in India. The poverty line was deter-
mined based on normative food intake levels, equivalent
to 2,435 calories per day for the rural population and 2,095
calories per day for the urban population. Equivalent val-
ues of food expenditure, plus an allowance for basic non-
food expenditures, were calculated from data collected
during the 1972/73 NSS. These norms were updated to
current years by applying changes in the Consumer Price
Index of Agricultural Laborers for rural areas and the Con-
sumer Price Index of Industrial Workers for urban areas.
Since 1993/94, the poverty line has been calculated sepa-
rately for each state on the basis of state-specific prices,
adjusted for interstate price differentials.
For the purposes of this study, the India team calculated
three measures of poverty for each subgroup within the sample:
(i) the headcount index (proportion of people below the pov-
erty line), (ii) the poverty gap index (average distance of house-
hold income from the poverty line, a measure of the depth of
poverty), and (iii) the squared poverty gap index (a measure
of the severity of poverty). The poverty line used in this study
was Rs342.13 per month, corresponding to an annual per
capita income of Rs4,105 or about $88 in 2003. The Gini
index was also calculated for each subgroup within the sample
to measure inequality.
Transport and Energy
Interventions
Based on consultations with district officials in the
selected districts, the study team identified four case study
locations, defined as clusters of villages around recently
improved district-level roads. Some villages are located close
to the improved roads, while others are some distance away
on unimproved roads or tracks. From each of the selected
districts, one district road completed in the mid-1990s was
chosen to form the basis for the study sample. The sample
district roads range in length from 10 to 18 km.
In Jamnagar District, the sample road was Bagadhra-
Butavodar-Mandason in Jamjodhpur taluka (block), which
was completed in 19971998. The road length is about
18 km. It provides six villages in the block with access to
block and district headquarters by connecting them to the
state highway system. The distance from these villages to
India Country Study 143
block headquarters ranges from 20 to 40 km; the city of
Jamnagar is 6075 km away. All of the villages had pri-
mary schools located in the village, and most had post and
telegraph services not very far away. Two of the six villages
had middle schools and one had a girls school, but other
services, such as secondary schools, health services, mar-
ketplaces, and police and railway stations were generally
located in block headquarters, or more than 10 km away
from the villages.
In Bharuch District, the selected sample road is the
Kalak-Madafar road in Jambhusar taluka. This road is
10.8 km in length and was completed in 19971998. The
road connects six villages to block headquarters on the
state highway. The villages are 513 km by road from
block headquarters. The distribution of services was simi-
lar to that in Jamnagar district, but distances to service
locations were generally shorter than in Jamnagar.
The sample road for Panchmahal district was the Palla-
Padhora-Bakrol road in Ghoghamba taluka, also built in
19971998. The road is 13.3 km long and serves 13 vil-
lages. The distances from the villages to block headquar-
ters range from 1 to 18 km. The distribution of services
was similar to that in the other districts, except that the
nearest railway station was much farther away, from 45 to
60 km depending on the location of the village.
In Kuchchh, Mundra Port, built on a BOOT basis by
Gujarat Adani Port Limited, was selected for the study.
Mundra Port, which began operating in 1998, is an all-
weather port, well connected to the national road and rail
networks.
28
It is a joint venture project of the Gujarat Mari-
time Board and the Adani Group. The port is capable of
handling dry and liquid cargo and container ships up to
80,000 dead-weight tons. In approximately 4 years since
port operations began, it has handled over 8 million tons
of bulk cargo. Because of the advantages offered by the
port, two new industries have located in the area. Five
villages were selected for the study, located 1825 km from
the port itself and 29 km from block headquarters.
Except for being far from district headquarters and the
railway station at Kuchchh, most other services were
located in or near the villages.
Research Methods
The study had two main objectives: (i) to evaluate the
impact of interventions in transport and energy infrastruc-
ture on poverty reduction at the community, household,
and individual levels; and (ii) to identify the direct and
indirect mechanisms that produce these impacts on pov-
erty. To achieve these objectives, the study used a combi-
nation of approaches, including village-level information,
interviews with key informants from service agencies,
household interviews with questionnaires, limited partici-
patory focus group discussions, and supplementary sec-
ondary data analysis.
The National Council of Applied Economic Research
(NCAER) study team prepared a detailed village ques-
tionnaire and filled it out in all 30 villages in the sample
frame through interviews with key
informants. The questionnaire cov-
ered economic and social infrastruc-
ture, with an emphasis on electricity,
transport, health care, and education.
The team also obtained information
on distance from the road, distance
from the main centers of activity, pro-
portion of households with electric-
ity, caste composition, and major eco-
nomic activities. Basic household
information was collected from all
households in the sample frame. The
list of households was then stratified
into four groups in terms of distance
from the pucca road (more or less than
28
Pipavav, Gujarats other privately oper-
ated port, has been less successful, due
to its lack of a direct connection to the
nations rail network.
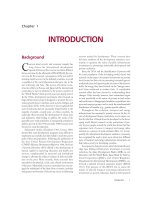
Village residents in Bharuch district, Gujarat, exchange views with members of
the study team.
144 Assessing the Impact of Transport and Energy Infrastructure on Poverty Reduction
0.5 km) and household access to electricity. A total of 7,931
households were in the sample frame, about half of whom
had electricity and half did not. About one third of the
sample frame lived less than 0.5 km from the improved
road; two thirds lived more than 0.5 km away.
A sample size of 2,600 households was selected, about
one in three households in the sample frame. The sample
size for each district was determined in proportion to the
total number of households in the sample frame for each
district. From each of the four strata, then, the household
survey sample was drawn using systematic random sam-
pling. When a selected household was not present or did
not respond, replacement households were selected from
the same district list by matching characteristics with the
original household, including access to roads and elec-
tricity, caste, religion, primary occupation, and landown-
ership. A detailed household questionnaire was designed
to collect household and individual impact data as well as
data on constraints experienced by the beneficiaries in
accessing transport and energy services. Local field inter-
viewers were recruited and trained by the NCAER
survey
team. A total of 2,591 households responded to the survey.
In the four districts, in-depth focus group discussions
were also carried out in selected villages. The aim of these
discussions was to better understand the nature of the
interventions, changes brought about by such interven-
tions, and constraints in accessing services provided by
the interventions. Ten of the 30 villages in the sample
frame were selected for this purpose, with the aim of cov-
ering a variety of ethnic and economic groups. Two
villages each were selected from Jamnagar, Bharuch, and
Kuchchh districts, and four villages from Panchmahal dis-
trict. During these discussions, a few individuals were also
selected for profiling as individual case studies.
Sample Household
Characteristics
As Table 7.1 shows, the sample design produced a set
of households approximately equally distributed between
the four groups of households with good road and elec-
tricity access, households with good road access but no
electricity, households with electricity but
poor road access, and households with
neither electricity nor good road access.
Slightly more than half (54%) of the elec-
trified households also lived close to the
pucca roads, while slightly more than half
(53%) of the nonelectrified households
lived more than half a kilometer from the
pucca roads. Similarly, 51% of the house-
holds with good road access were electri-
fied, while only 45% of the households
with poor road access had electricity.
Sample households were most likely to
have both good road and electricity
access in Jamnagar District, and least
likely to have either in Panchmahal Dis-
trict. Households in Bharuch District had
good road access but less access to elec-
tricity, while those in Kuchchh occupied a
middle position.
Based on household survey data, the incidence, depth,
and severity of poverty were calculated for the four
subsamples at each site and for the four subsamples as a
whole (Table 7.2). The results show a much higher inci-
dence of poverty than the estimates made at the state level.
The average poverty level for the entire sample was 64%.
For sample households in Jamnagar, the poverty ratio was
32%, ranging from 29% (for electrified households near
the road) to 40% (for nonelectrified households far from
the road). In Bharuch, the average was 35%, but the
results for subgroups varied from 18% to50%, being much
higher for nonelectrified households (3750%) than for
electrified households (1825%). In Kuchchh, the overall
ratio was 52%, and poverty among the different subgroups
varied from 42% to 58%. The poverty ratio was highest in
Panchmahal (91%), ranging from 89% to 93% among the
subgroups. Taken together, the study found a poverty level
Gujarat has reached its goal of 100% electrification of rural villages, but has
a long way to go before it reaches 100% of households.
India Country Study 145
of 48% among sample households with both good road
access and electricity, 62% for households with electricity
but not close to a good road, 68% for households without
electricity but living close to a good road, and 76% for
households that had neither good road access nor elec-
tricity.
What can explain these exceptionally high estimates?
First, the locations studied have only recently been pro-
vided with good road access, and perhaps poor access has
prevented poverty reduction from taking place sooner. It
is also true that aggregate statistics can easily mask block-
specific and village-specific variations in poverty, although
it is difficult to imagine that the selected district road
improvements would have served exceptionally poor vil-
lages in all cases. A third possible explanation may be the
poor rainfall that the state received for the years prior to
the field study.
29
Average household and per capita incomes were also
calculated for the poor and the nonpoor in each district
and each subsample. Because of variations in household
size (poor households tended to be larger), the differences
in household income were less marked than the differ-
ences in per capita income. Results by district are summa-
rized in Table 7.3.
With respect to religion, Hindus made up a large
majority of sample households. In Jamnagar and Panch-
mahal, Hindus accounted for over 90% of the sample. In
Kuchchh they accounted for almost 80%, and in Bharuch, the
sample was about 60% Hindu. Most of the rest were Mus-
lims, but each district also had a very small minority of Sikhs
and Jains. Among the poor
households, Hindus pre-
dominated slightly.
In Jamnagar and Bhar-
uch, general category
households and scheduled
castes dominated the caste
composition among the
selected households. In
Panchmahal, scheduled
tribes and other back-
ward castes constituted a
large majority. The study
area was predominantly a
tribal area with scheduled
tribes constituting more
than two thirds of the
sample households. In
Kuchchh District, other
backward castes made up
the majority, with close to
two thirds of the sample
households, followed by
scheduled castes, which are
the second major caste
group in Kuchchh.
The sample data sug-
gest that caste is linked to
the probability of being
29
The results for the entire
sample may also have been
somewhat skewed by the
relatively high proportion
(46%) of responses from
Panchmahal District.
Road Access
District Access to Electricity Up to 500 m >500 m Total
Jamnagar Electrified 243 134 377
(45.8%) (25.3%) (71.1%)
Nonelectrified 101 52 153
(19.1%) (9.8%) (28.9%)
Total Jamnagar 344 186 530
(64.9%) (35.1%) (100.0%)
Bharuch Electrified 74 54 128
(24.3%) (17.8%) (42.1%)
Nonelectrified 110 66 176
(36.2%) (21.7%) (57.9%)
Total Bharuch 184 120 304
(60.5%) (39.5%) (100.0%)
Panchmahal Electrified 173 263 436
(14.65%) (22.2%) (36.8%)
Nonelectrified 307 443 750
(25.9%) (37.4%) (63.2%)
Total Panchmahal 480 706 1,186
(40.5%) (59.5%) (100.0%)
Kuchchh Electrified 183 122 305
(32.0%) (21.4%) (53.4%)
Nonelectrified 120 146 266
(21.0%) (25.6%) (46.6%)
Total Kuchchh 303 268 571
(53.0%) (47.0%) (100.0%)
Total Electrified 673 573 1,246
(26.0%) (27.3%) (51.9%)
Nonelectrified 638 707 1,345
(24.6%) (22.1%) (51.9%)
Total Sample 1,311 1,280 2,591
(50.6%) (49.4%) (100.0%)
Source: India study team field surveys, 2002.
Table 7.1. Sample Households by District and Access to Roads
and Electricity
146 Assessing the Impact of Transport and Energy Infrastructure on Poverty Reduction
Close to Road Far from Road
Electrified Nonelectrified Electrified Nonelectrified
Jamnagar
Head Count Index 28.4 36.7 29.6 40.0
Poverty Gap Index 5.0 7.3 6.1 7.9
Severity of Poverty 1.3 2.0 1.9 2.1
Gini Coefficient 30.4 22.1 30.5 27.7
Bharuch
Head Count Index 24.9 50.1 17.6 36.8
Poverty Gap Index 3.8 9.7 3.6 8.4
Severity of Poverty 0.8 2.5 1.1 3.6
Gini Coefficient 29.6 23.7 19.3 21.6
Panchmahal
Head Count Index 92.8 90.2 89.3 92.1
Poverty Gap Index 44.3 41.6 43.1 44.7
Severity of Poverty 24.0 22.8 23.9 24.8
Gini Coefficient 22.6 27.2 31.2 25.7
Kuchchh
Head Count Index 42.1 56.7 57.7 56.0
Poverty Gap Index 16.9 25.7 25.0 32.6
Severity of Poverty 4.5 5.7 6.6 6.3
Gini Coefficient 33.1 25.7 28.3 27.8
Entire Sample
Head Count Index 48.4 68.4 62.1 75.7
Poverty Gap Index 16.9 25.7 25.0 32.6
Severity of Poverty 8.1 12.6 12.9 17.1
Gini Coefficient 35.8 31.2 36.2 31.9
Table 7.2. Incidence of Poverty in Sample Households
(Percent)
Source: India study team field surveys, 2002.
District
Table 7.3. Sample Average Annual Income by District
Average Annual Income (rupees)
Household Per Capita
Poor Nonpoor Poor Nonpoor
Jamnagar 17,411 27,446 2,968 6,687
($377) ($590) ($64) ($144)
Bharuch 20,896 25,653 3,265 6,108
($449) ($552) ($70) ($131)
Panchmahal 18,430 16,912 2,547 4,832
($394) ($364) ($55) ($104)
Kuchchh 20,611 27,558 3,747 8,351
($443) ($593) ($81) ($180)
Entire Sample 18,868 25,928 2,816 6,823
($406 ($558) ($61) ($147)
Source: India study team field surveys, 2002.
District
India Country Study 147
poor or nonpoor. Whereas 70% of the general caste house-
holds were nonpoor, and more than half of the scheduled
caste households were also in the nonpoor category, about
60% of the households from other backward castes were
poor, and nearly 90% of those from scheduled tribes were
poor, predominantly those still living in Panchmahal dis-
trict. However, the econometric analysis conducted for
this study did not show caste as a variable significantly
affecting the probability that a household would be poor.
Illiteracy rates were higher among women than among
men, and higher among poor households than among
nonpoor households. Illiteracy appeared to be lowest in
Jamnagar district, around 22% for men and 33% for
women in poor households and somewhat higher for men
(26%) and women (43%) in nonpoor households. Illit-
eracy appeared to be higher in Bharuch district among
poor households, around 35% for men and 53% for
women, while in nonpoor households it ranged from 31%
for men to 56% for women. Illiteracy rates for men in
Kuchchh district were comparable with those in Jamnagar,
while for women they were worse (43% for poor women
and 56% for nonpoor women). Illiteracy rates were high-
est in Panchmahal district (about 47% for men and about
62% for women, regardless of poverty status).
A majority of sample households in three of the four
districts were employed in the agriculture sector. In
Jamnagar district, 40% of the poor households and 57% of
the nonpoor households were farmers, while 39% of the
poor households and 24% of the nonpoor households were
agricultural wage laborers, and 17% of the poor households
and 10% of the nonpoor households were nonagricultural
wage earners. In Bharuch district, only one fourth of the
households had their own farms, and more households
depended on agricultural wage labor. In Panchmahal Dis-
trict, a majority were farmers, but nonagricultural employ-
ment was also important, especially among the nonpoor. In
Kuchchh, less than one fourth of the sample households had
their own farms, and nonagricultural employment was more
prevalent than agricultural wage labor. In all districts, occu-
pations other than farming, agricultural labor, and nonagri-
cultural labor represented only a very small minority of the
sample, although Kuchchh district showed a slightly more
diversified occupational profile (Table 7.4).
The average size of landholdings among the sample
households was 2.4 hectares (ha) for poor households and
3.4 ha for nonpoor households (Table 7.5). The differ-
ence between poor and nonpoor households in the share
of farmland irrigated was not significant. Among the four
sites, sample households in Kuchchh had the smallest
average farm size, while sample households in Bharuch
had the largest landholdings. However, the sample farm
households in Kuchchh had a higher irrigation intensity,
especially electrified households. Given the small size of
landholdings, the average household in all four sites would
fall in the category of marginal and small farmers. On the
average, poor households had smaller landholdings than
nonpoor households in Jamnagar and Bharuch, but in
Panchmahal and Kuchchh districts the poor households
had larger landholdings than nonpoor households.
Because Gujarat is largely an unirrigated state, crops that
can be grown in dryland areas dominate the cropping pattern
(Table 7.6). The major crops in Jamnagar were groundnuts
and cotton, which together account for 100% of the cropped
area of poor households and 97% of the cropped area of
nonpoor households. In Bharuch district, the pattern was domi-
nated by a single crop, cotton, accounting for 83% of the
cropped area of poor households and 82% of the cropped area
of nonpoor households. The second most important crop in
Bharuch district was wheat. Among the poor sample house-
holds of Panchmahal district, maize accounted for about 82%
of the cropped area, followed by groundnuts. This pattern
was even more strongly shown among nonpoor households.
Sample households in Kuchchh had a more diversified crop-
ping pattern: bajra (pearl millet) had become the dominant
crop, with significant areas also devoted to wheat and cotton,
and smaller areas to a variety of other crops, including fodder.
About three fourths of the poor sample households
and about half the nonpoor households owned livestock
(cows, buffaloes, and poultry). Livestock ownership was
most prevalent in Panchmahal District, where the poor
were even more likely to have livestock than the nonpoor,
mainly because buffaloes were still being used for trans-
port. In Kuchchh District, the poor were also distinctly
more likely than the nonpoor to own livestock. In the other
two districts, no great difference emerged between the poor
and the nonpoor in patterns of livestock ownership.
Sales of farm products were the most important source
of income for the sample households, followed in most
cases by agricultural wages (Table 7.7). In Jamnagar Dis-
trict, farm sales and agricultural wages contributed over
three fourths of total income for both poor and nonpoor
households. In Bharuch, they accounted for about 60% of
all income, but the share of wage income was much higher,
consistent with the occupational pattern. Farm income was
important for the poor in Panchmahal, but relatively little
came from agricultural wages. This pattern was even more
marked for the nonpoor in Panchmahal, who derived only
38% of their income from agriculture, relying more heavily
148 Assessing the Impact of Transport and Energy Infrastructure on Poverty Reduction
on nonagricultural wages and government salaries. In
Kuchchh, only 43% of the income of poor households and
23% of the income of nonpoor households came from
agriculture. Nonagricultural wages, salaries (especially
in nonpoor households), and business and trade accounted
for the majority of household income in Kuchchh.
Jamnagar Bharuch Panchmahal Kuchchh
Occupation Poor Nonpoor Poor Nonpoor Poor Nonpoor Poor Nonpoor
Cotton 40.2 44.8 83.3 82.3 10.1 13.3
Groundnut 59.8 52.1 9.7 2.8
Wheat 13.2 11.1 23.5 23.3
Maize 82.2 95.0
Bajra (Pearl Millet) 48.8 46.3
Others 0.0 3.1 3.5 6.7 8.1 2.2 17.6 17.1
Table 7.6. Distribution of Sample Cropped Area by Crop
(Percent)
Source: India study team field surveys, 2002.
Jamnagar Bharuch Panchmahal Kuchchh
Poor Nonpoor Poor Nonpoor Poor Nonpoor Poor Nonpoor
Average Farm Size 2.4 4.6 2.6 5.2 2.4 1.3 2.0 1.4
Percent Irrigated 14.1 11.2 0.7 0.6 0.0 0.0 74.0 78.3
Table 7.5. Distribution of Sample Households by Size of Landholding
(ha)
Source: India study team field surveys, 2002.
Jamnagar Bharuch Panchmahal Kuchchh
Occupation Poor Nonpoor Poor Nonpoor Poor Nonpoor Poor Nonpoor
Farmer 40.2 56.5 17.0 28.1 66.4 52.3 21.0 21.0
Farm Laborer 38.6 23.6 47.3 32.3 11.1 4.6 12.1 12.1
Nonfarm Laborer 17.4 10.3 22.3 19.3 11.6 23.9 35.3 35.3
Government 0.8 3.0 3.6 5.2 4.5 10.1 2.6 2.6
Nongovernment 0.8 0.5 5.4 6.3 1.5 1.8 11.0 11.0
Business 0.0 2.5 0.0 4.7 2.0 1.8 1.8 1.8
Self-employed 1.5 1.5 2.7 2.1 1.8 3.7 12.1 12.1
Other 0.8 2.0 1.8 2.1 1.0 1.8 4.0 4.0
Table 7.4. Distribution of Sample Households by Occupation
(Percent)
Source: India study team field surveys, 2002.
India Country Study 149
In general, the size of poor households was larger than
that of nonpoor households in all districts. Poor house-
holds averaged 6.7 persons, while nonpoor households
averaged 3.8 persons. The average number of income earn-
ers ranged between 1.1 and 1.4 for all categories of house-
holds. The number of earners in poor households was
slightly higher than in nonpoor households for all dis-
tricts except Jamnagar.
Findings
Community-Level Impacts
At the community level, changes were measured over
the 6 years from 1997 to 2002. Since all the villages were
electrified before 1997, changes over this period could be
largely attributable to recent district road improvements.
However, they might also represent delayed effects of vil-
lage electrification. Since there are no without-service
villages in the sample, the study could measure only
changes that occurred after both electrification and road
improvements had taken place. Consequently, it was not
possible to separate transport effects from energy effects
at the village level.
Changes in cropping patterns occurred in each of the
sample sites. It seems likely that these changes were made
mostly in response to changing prices. Trends suggested a
shift away from food crops and toward commercial crops,
providing greater market integration and higher incomes
along with an acceptable level of risk. Some changes also
had to do with expansion of the area under irrigation,
especially in Kuchchh district.
In Jamnagar district, groundnuts continued to be the
dominant crop. Cotton was also still important. Signifi-
cant changes in allocated areas occurred for cereals, such
as wheat, maize, and millet; pulses, such as gram and
pigeon pea; and sesame, an oilseed crop. A decline took
place in area under millet, but the other areas have
expanded. The site in Bharuch district saw a significant
expansion in areas under cotton, pigeon pea, sesame, and
gram. The area under wheat remained the same, but the
area allocated under sorghum showed a significant
decline. In Panchmahal, the area under maize remained
approximately the same, but areas under pigeon pea and
rice significantly increased. A remarkable expansion
(about five times) occurred in the area under vegetables.
In Kuchchh, the cultivation of bajra declined in favor of a
significant expansion of the area under sorghum, culti-
vated in both dry and rainy seasons. Growing of wheat,
green gram, and cotton also decreased, while the area
under dates, vegetables, maize, and sesame increased.
These changes were consistent with a pattern of
increasing reliance on the market and taking advantage of
price differentials for perishable crops, which were an
important advantage of transport improvements. In
Jamnagar district, the market price of millet declined sub-
stantially, while the price of gram similarly increased. The
sample villages of Bharuch district witnessed a consider-
able increase in the real prices of wheat, sorghum, cotton,
and desi ghee (a dairy product). The change in the price of
cotton, in particular, was reflected in a change in the area
allocated. In Panchmahal district, with the exception of
maize, real prices of dryland crops decreased over the study
period. However, real prices of vegetables, pulses, and
fodder increased. In the sample villages of Kuchchh
Jamnagar Bharuch Panchmahal Kuchchh
Source of Income Poor Nonpoor Poor Nonpoor Poor Nonpoor Poor Nonpoor
Sale of Farm Products 40.3 56.4 23.9 32.6 52.2 34.1 27.2 15.3
Agricultural Wages 36.8 18.8 39.0 26.1 10.4 3.9 15.4 7.3
Nonagricultural Wages 17.1 8.2 20.4 13.7 13.1 19.8 29.4 24.1
Government Salary 1.0 6.9 6.4 9.7 9.6 25.7 4.8 5.7
Nongovernment Salary 0.3 0.5 5.9 7.5 3.1 4.0 3.2 26.8
Business/Trade 0.0 2.2 0.0 5.0 3.1 4.9 0.0 3.3
Other 4.5 6.9 4.5 5.6 8.5 7.5 18.9 17.5
Table 7.7. Sample Household Income by Sources
(Percent)
Source: India study team field surveys, 2002.
150 Assessing the Impact of Transport and Energy Infrastructure on Poverty Reduction
district, the prices of milk and milk products increased in
real terms; this explains the significant increase in area
under fodder and fodder substitutes. The real prices of
other products decreased. Household interviews and
focus group discussions confirmed that the prices of key
crops had improved due to better connectivity of the vil-
lages to nearby markets.
To test this hypothesis, the changes in cropping pat-
terns and prices that occurred in the sample villages were
compared with overall changes reported at the district and
state level. The comparison certainly
suggested that the effects experienced
in the sample villages differed from the
norm and could be attributed, at least in
part, to the recent infrastructure
improvements. For example, in Jam-
nagar District, production of all crops
except bajra and fodder increased sub-
stantially in the sample villages, while,
except for groundnuts and sesame, they
declined overall at the district and state
levels. For groundnuts and sesame, the
growth in production in the sample vil-
lages considerably exceeded the growth
at the state level (Table 7.8).
In Bharuch, a moderate increase
occurred in the production of millet,
gram, pigeon pea, sesame, and cotton,
while millet, gram, and pigeon pea pro-
duction declined at the district and state
level, and cotton production, though
slightly increasing within the district,
also declined at the state level. In
Panchmahal, the production of staples,
such as sorghum, bajra, gram, ground-
nut, and sesame, declined substantially
as cultivable land was shifted to the pro-
duction of rice, pigeon pea, vegetables,
and fodder. In Kuchchh, a remarkable
expansion occurred in the sample villages in sorghum,
maize, and sesame production, as well as vegetables and
fodder, at a time when sorghum production was declining
in the state as a whole. (Data were not available for all
crops either at the district or the state levels.)
A comparison of the prices reported for different crops
and livestock products in the sample sites with the real
wholesale price indices for these crops on a national level
supports, to a certain extent, the statements of respondents
that farmgate prices increased as a result of the road
improvements. Generally, prices paid to farmers in the sample
villages increased, while wholesale prices on the national
market were falling or in some cases rising more slowly. This
was particularly true for ghee in Jamnagar; wheat, sor-
ghum, cotton and ghee in Bharuch; maize in Panchmahal;
and milk in Kuchchh. In other cases, prices paid to farm-
ers declined, but not as much as the wholesale price index.
Information from key informants in the sample sites
also showed that the real prices of important inputs had
generally decreased since the completion of the road. The
average prices of fertilizers used in the sample villages
declined by about 1.4% after road con-
struction; the prices of pesticides, which
are used quite extensively in the area
on commercial crops such as cotton and
groundnut, declined 1% to 9%. The
prices of agricultural equipment, such
as carts, diesel engines, electric motors,
and other agricultural tools, also
showed a significant decline, particu-
larly in the sample villages of
Panchmahal District. These changes
cannot be attributed to transport
changes alone, as macro policies also
have a bearing on the prices of these
inputs. However, farmers in the sample
villages were of the opinion that these
changes at least partly reflected the
greater availability of seeds, pesticides,
and agricultural tools that results from
an improvement in transport infrastruc-
ture. Farmers also noted the greater ease
of traveling to markets to buy these key
farm inputs.
Changes in the prices of farm
inputs in the sample villages were also
compared with changes in the whole-
sale price index for these inputs. While
the cost of inputs generally declined due
to overall macroeconomic policy, some
of the sample districts recorded much more dramatic
declines in the price of some inputs. The price of fertiliz-
ers to farmers did not decline as much as the national
index, suggesting that intermediaries, rather than farm-
ers, were capturing the benefits of the change in national
policy as well as part of the benefits of the road improvement.
In the case of pesticides, farmers in Jamnagar and Kuchchh
districts did not get the full benefit of national price
declines, but those in Bharuch and Panchmahal experienced
price declines in excess of changes in the national index,
indicating that they were capturing a share of transport cost
Transport improvements allowed
farmers to take advantage of price
differentials for perishable crops.
India Country Study 151
savings as well as sharing in the overall price reduction. In
Panchmahal District, the cost of agricultural tools and
machinery declined in real terms, but not as much as the
national index, while in the other three districts, costs to farm-
ers mainly increased in real terms, despite the decline in the
national price index. These differences in the extent to which
the benefits of transport improvements were passed on to
farmers probably reflect various imperfections in the markets
for these different types of inputs.
Another important change that took place in the sample
villages was an increase in the value of land. This increase
ranged from 70% over 5 years in the sample villages of
Panchmahal Dstrict, to a nearly 3,000% increase (2,889%)
in Kuchchh District. Land price increases in Jamnagar
District (77%) were slightly higher than those in
Panchmahal, while land prices in Bharuch District more
than doubled (153%). The remarkable increase in the value
of land in Kuchchh District is due not only to the provi-
sion of pucca roads, but also to the construction of Mundra
port. The port developers bought land to build residential
colonies for their employees and to create health and edu-
cation facilities. Furthermore, two factories were estab-
lished: the Adani-Wilmar refinery in Dhrab and Jindal
Saw Pipes Limited in Nana Kapaya, the two sample vil-
lages located close to the port. Commercial activity flour-
ished in the vicinity of the port, which led to a significant
increase in the value of land and buildings. For example,
local people rented out between 100 and 150 rooms to
factory workers.
The village data also reflected significant increases in
wages over the study period, due to the increase in labor
demand for both agricultural and nonagricultural work.
Wages in general were highest in the sample villages of
Kuchchh and lowest in the sample villages of Panchmahal.
Between 1992 and 1997 (i.e., before the transport inter-
vention), real wages remained approximately stable in the
sample villages of Bharuch District, while they declined
in both Jamnagar and Kuchchh. Only in Panchmahal Dis-
trict were wages on the increase before the road improve-
ment. After the road improvement, however, wages
increased in all districts, in both dry and rainy seasons. In
Panchmahal district, the increase was particularly marked
Jamnagar Bharuch Panchmahal Kuchchh
Crops Sample District Sample District Sample District Sample District Gujarat
Villages Level Villages Level Villages Level Villages Level State
Cereals
Rice 14.9 15.8 1.9
Wheat 544.4 27.9 0.7 71.4 27.4 23.4 58.8
Sorghum 96.5 67.1 86.9 76.4 346.7 36.5
Millet 58.3 25.2 75.3 32.6 61.6 47.7 84.7 60.5 14.2
Maize 1,511.4 70.4 2.3 3.2 490.0 10.0
Pulses
Green Gram 4.7 93.6 43.0
Gram 615.4 92.8 35.3 70.4 17.6 94.7 86.2
Pigeon Pea 278.6 32.2 86.4 25.3 63.1 45.1 26.2 16.0
Oilseeds
Groundnut 10.2 4.8 56.3 73.9 100.0 31.9 0.5
Sesame 72.2 11.3 47.5 11.8 58.8 66.7 569.2 9.4 28.4
Other Crops
Cotton 25.9 13.7 62.1 21.2 45.7 4.2 38.4 60.2 17.8
Vegetables 95.6 494.0 89.0 44.3
Fodder 50.0 35.0 39.1
Table 7.8. Change in Cropping Patterns, 1997/982001/02
(Percent change)
Blank cells = column does not apply; = data not available.
Note: The changes in the district level data are for 1997/982000/01.
Source: India study team field surveys, 2002.
152 Assessing the Impact of Transport and Energy Infrastructure on Poverty Reduction
for workers, especially for women. The increase was even
more dramatic when compared with real wages at the state
level, which decreased by 4.3% for both men and women
over the same period.
30
The pattern of these increases is
consistent with the hypothesis that road improvements
reduce the imperfections in labor markets that prevent
labor from being allocated efficiently and perpetuate
rural poverty (see, for example, Yao [2003]).
Interviews with the villagers showed that transport
improvements made it possible for them to travel to nearby
towns for wage work (Box 7.1). Contractors from the
nearby towns visited these villages with their own vehicles
to collect workers. With the road improvement, the vil-
lagers found that they were able to commute daily to rela-
tively distant places, where they could find wage work.
Employment opportunities within and around the villages
also improved.
As to the provision of health care and education ser-
vices in the sample villages, relatively little change took
place after completion of the road. The number of public
health centers near the sample villages and the number of
doctors available increased in the Panchmahal and
Kuchchh study locations. The main improvement seen by
the villagers, however, was better access to hospitals in the
nearby towns, both public and private. Since the villages
had very few primary health centers, residents appreciated
very much being able to access medical care in case of
emergencies. Also, regular antenatal and postnatal care
improved because the ANM (primary public health cen-
ter nurse) visited more frequently.
In two of the four sites, Panchmahal and Kuchchh dis-
tricts, road improvements were followed by an increase in the
number of primary schools in the villages. Primary schools in
the Panchmahal site went from 21 to 29, and in Kuchchh from
6 to 8. The number of primary school teachers increased
everywhere except in Jamnagar District, with quite dramatic
increases in Kuchchh (63%) and Panchmahal (50%). Corre-
spondingly, enrollments of both boys and girls increased
everywhere except for boys in primary school in the Jamnagar
site (where enrollments declined), and in the secondary schools
serving the Panchmahal site (where enrollments remained
about the same). The increase in both boys and girls school
enrollment in the Kuchchh sample villages was markedly
higher than in the other three locations. Enrollment in Kuchchh
increased by 50% for boys and 100% for girls at the primary
30
State-level data represent averages for both peak and lean seasons
and are provisional. These numbers may be revised as additional
data are received from the different blocks and districts.
Box 7.1. Reconciled with the Future Promise for Children
Fathimabhen, aged 55, has been a resident of Methan Village in Jamrudpur tehsil of Jamnagar District for more than 40 years, ever
since she tied the wedding knot to Umarbhai Lakhaja. They have four children, three daughters and a son. Up until a few years ago, when
the rainfall was normal, they used to grow pulses, bajra (pearl millet), and wheat on their 7 bigha (approximately 0.14 ha) of land, which
the family had inherited. This was sufficient for the familys livelihood. But because of severe drought conditions in the area over the last
few years, growing crops is not feasible. Under such conditions, the only option left for Fatima and her husband is to seek wage work.
Fatimas husband has taken up wage work through a contractor in a relief work camp provided by the Government, but Fatima cannot
work because of a chronic backache problem.
For about 23 weeks work, Fatimas husband receives wages of Rs45 per day, less Rs56 that he receives every day from the
contractor for his out-of-pocket expenses. The current situation has left them much worse off than before, when the farm supported all
six family members. Their lifestyle clearly reflects their present poverty. They live in a mud-walled hut built with a thatched/straw roof.
This is lighted by an electric bulb connected through a wire extended from the neighborhood, for which she pays Rs100 per month because
she cannot afford a separate connection. The kitchen is outside, in a corner at least 810 feet away from her living space. The kitchen is
also covered on top with straw/thatch; its two sides are protected by the mud wall that demarcates the boundary of their home.
Meanwhile, her husband walks home from his workplace, which is about 34 km from the house. Asked about why he did not come
by bus, he replied that the fare is Rs4 per trip, which they cannot afford. Fatima also added that private bus operators do not allow
passengers to carry their work materials on the bus for fear of damage to the bus.
Fatimas only consolation is that all her children are settled in Jamnagar Town, which is just 20 km from the village. Thanks to the
road, it has been possible for her children to visit their parents frequently. In Fatimas words, Because my son is employed in the forest
department, though on a temporary contract, he earns well and sends us Rs500 regularly. This, together with the wage income, adds up
to somewhere around Rs7,0008,000 annually. Asked about the uncertainty of her sons job, Fatima replied, He is in town, and in town,
even if one job is gone, one can find another job. There is no problem.
For Fatima, on the whole, although the family income is low due to bad monsoons in the region, the impact of road construction
has been positive in providing alternative sources of employment and strengthening family ties.
Source: India study team.
India Country Study 153
level, and by 33% for boys and 100% for girls at the secondary
level. Although the number of teachers also increased, the
dramatic growth in
enrollments resulted in
higher pupil-teacher
ratios in the Kuchchh
primary schools.
Data from the parti-
cipatory discussions
showed that both road
improvements and
electricity contributed
to the villagers confi-
dence in sending their
children, especially
girls, to school. They
said electricity had also
improved educational
opportunities for
adults. Schoolteachers
often lived in towns and
commuted to their vil-
lage classrooms. With
road improvements,
teachers now attend
classes in the village
schools more regularly.
The NCAER team
assessed changes in the
time taken to visit key
locations, including
administrative offices,
markets, and health care and education facilities, since the
road was improved (Table 7.9). Substantial reductions in
travel time were reported by village key informants. Time
taken to visit block headquarters decreased by 25% in
Kuchchh, 35% in Jamnagar, 53% in Bharuch, and 70% in
Panchmahal. Time savings to reach other amenities such
as markets, post and telegraph offices, police stations,
health care centers, and postprimary schools were of com-
parable magnitude, ranging from 12% to 33% in Kuchchh,
from 22% to 59% in Jamnagar, from 53% to 62% in
Bharuch, and from 19% (nearby post and telegraph ser-
vices) to 70% in Panchmahal.
These transport time savings were brought about not
only by construction of improved roads, but also by changes
in the modes of transport available in the sample loca-
tions. The changes basically reflected a shift from slow-
moving bullock and camel carts to fast-moving buses, jeeps,
trucks, auto-rickshaws, chakdas (three-wheelers made
from a motorcycle with a carriage-like trailer), taxis, and
Table 7.9. Village Time Savings by District and Destination
(Percent)
Destination Jamnagar Bharuch Panchmahal Kuchchh
Administrative
District Headquarters 34 49 40 12
Block Headquarters 36 53 70 25
Police Station 22 57 72 25
Commercial Services
Post Office 48 61 19 33
Telegraph Office 48 58 19 33
Market (Shops) 37 59 70 25
Agricultural Market 37 59 70 25
Railway Station 39 53 40 12
Health Care Services
Primary Health Center 27 57 67 22
Government Hospital 31 59 67 25
Private Hospital 29 59 70 25
Veterinary Hospital 30 59 70 25
Pharmacy 38 59 70 25
Education
Middle School 59 62 50 25
Secondary School 51 59 51 25
Girls School 44 59 40 36
Source: India study team field surveys, 2002.
In the areas of Gujarat studied, road improvements
resulted in greatly increased school enrollments for both
boys and girls.
154 Assessing the Impact of Transport and Energy Infrastructure on Poverty Reduction
mini matadors (minivans). All the study locations were
served by GSRTC buses, although the service was deemed
unreliable and other means of transport were often pre-
ferred. Discussions with transport service providers at the
sample sites indicate that they had experienced about 10%
savings on fuel costs and about 20% savings on vehicle
maintenance costs as a result of recent road improvements.
Village-level data also suggested that some changes
occurred in infrastructure related to drinking water sup-
ply and sanitation, although no change took place in
infrastructure related to drainage. With provision of elec-
tricity, the sources of drinking water diversified from hand-
dug wells and hand pumps to tubewells and public taps in
three of the four study sites. The exception is the site in
Bharuch District, where the groundwater is saline and the
main source of drinking water for the entire study period
was a public tap. Drinking water supply in the sample
locations also improved through delivery by tankers from
block headquarters, which was also facilitated by improved
transport infrastructure. Sanitation improved only in
Jamnagar and Kuchchh districts, where semi-flush toilets
have been installed in a few of the sample villages.
Other changes reported by key informants in the four
sample locations included the development of village mar-
kets, basically the establishment of two or three shops,
which provided commonly used consumer goods for all
the villages of each site (Box 7.2). Through radio and
television, people were better informed about crops,
weather, and daily news. Over the study period, a percep-
tible change occurred in consumption, for example, in
clothing worn, particularly for the nonpoor. In all four
sample locations, modern outfits replaced traditional
clothes, especially for the younger generation. Contact-
ing administrative staff at block headquarters and main-
taining ties with nearby and faraway family members
became easier with the improved roads. In addition,
laborers were able to work more days in the year due to a
wider range of construction activities within and outside
the villages. To a certain extent, transport and electricity
helped to mitigate the severity of drought for the last 4
years of the study period.
Household-Level Impacts
As noted above, the household sample was stratified
into four approximately equal groups according to
whether the household had access to electricity and whether
it resided close to (less than 0.5 km) or far from (more
than 0.5 km) the improved road. Since the household data
were collected at only one point in time, transport and
energy impacts were evaluated by comparing the perfor-
mance of groups with and without each improvement sepa-
rately. Potential synergies were then assessed by compar-
ing the performance of groups having access to both ser-
vices with groups having access to neither. As noted above,
the incidence of poverty in the four sample subgroups was
48% for households having access to both roads and elec-
tricity, 62% for households having electricity but poor road
access, 68% for households having good road access but
no electricity, and 76% for those that had no access to
either. Thus, the entire sample is predominantly (64%)
poor. The depth of poverty ranged from 17% in the first
group to 32% in the last group, and the severity of poverty
(squared poverty gap) from 8.1 to 17.1, following the same
pattern. Inequality, as measured by the Gini
index, was slightly higher among electrified households
(about 36) than nonelectrified households (about 32). Rela-
tively little difference in the Gini index could be seen
between households closer to and farther from the road.
The study team also divided the sample into poor and
nonpoor households and analyzed the data accordingly. The
analysis suggested significant differences in household and
per capita income between electrified and nonelectrified
households, as well as between households close to and
households far away from improved roads. The differ-
ences were somewhat greater for electrification than for
road access. The results for the four subsamples are shown
in Table 7.10.
The results suggest significant income differences
between electrified and nonelectrified households, both
poor and nonpoor. Having immediate access to a good
quality road seemed also to make a difference in incomes
for electrified nonpoor households, but not for electrified
poor households. Road access made more of a difference
for nonelectrified poor households. On a per capita basis,
less variation emerged, but the patterns were similar.
Curiously, nonpoor, nonelectrified households away from
the road had higher incomes than those in nonpoor,
nonelectrified households living close to the road. Per-
haps those farther from the road were more likely to own
their own farms, while households depending on wage
labor for their incomes, and not having land of their own,
were more likely to locate near the road so as to have
better access to employment opportunities both within
and outside the village.
Situational Factors. As to caste and religion, the
data showed that social groups were approximately evenly
India Country Study 155
distributed in terms of their access to roads and electricity.
In Jamnagar District, Muslim households (a small
minority) were disproportionately represented among the
households that had neither electricity nor good road
access. In Bharuch, where greater numbers of Muslim
households were located (although still a minority),
nonpoor Hindus were slightly more likely than nonpoor
Muslims to have both electricity and road access, whereas
poor Hindus were less likely than poor Muslims to have
such services. Hindus were also disproportionately rep-
resented among those households (both poor and nonpoor)
that had neither service, while Muslims were predomi-
nant among those with either one or the other amenity.
This may reflect the fact that Hindu society is more inter-
nally stratified than Muslim society. In Panchmahal,
Muslims (and other religious minorities) were likely to
be among those who were better served, and a similar
though less marked pattern held true in Kuchchh.
The illiteracy rate in electrified households was lower
than in nonelectrified households over the entire sample,
Average Annual Income (rupees)
Household Per Capita
Poor Nonpoor Poor Nonpoor
Electrified Good Road Access 20,749 32,864 3,192 7,825
($446) ($707) ($69) ($168)
Poor Road Access 20,579 27,465 2,781 6,866
($443) ($591) ($60) ($148)
Nonelectrified Good Road Access 18,338 17,956 2,958 5,527
($394) ($386) ($64) ($114)
Poor Road Access 17,113 18,240 2,517 5,527
($368) ($392) ($54) ($119)
Entire Sample 18,868 25,928 2,816 6,823
($406) ($558) ($61) ($147)
Table 7.10. Distribution of Sample Households by Intervention and Income
Source: India study team field surveys, 2002.
Box 7.2. Shahbhai Takes Advantage of Roads and Electricity
Thirty-four-year-old Shahbhai Andhersinh Bariya is a lifelong resident of Goth village in Panchmahal district. He lives with five other
members of his family. They have just one bigha (approximately 0.14 ha) of land, on which they grow paddy, maize, and pulses for own
consumption. This is not sufficient to sustain them. Thus, at the young age of 14 years, Shahbhai, who is primary-level literate, and his
brother started working as laborers on peoples farms.Even this work was not available regularly, however, due to the bad monsoon in the
last few years. So Shahbhai and his brother were forced to migrate to a town temporarily to do construction work to make ends meet.
Shahbhai disliked this, as he had to stay away from his family and his earnings were not sufficient both to save or remit home.
It was at this point that Shahbhai got the idea of opening up a small shop beside the village road, near the bus stop. He borrowed some
money from his relatives and built a cabin to use as a shop. To begin with he sold items like pan, bidi, tea, snacks, and the like. Subsequently,
because the village was close to Ghogamba town (block headquarters), a police station was set up on the roadside close to Shahbhais cabin.
The increased traffic on this road caused more and more people to start visiting Shahbhais cabin. Shahbhais earnings increased to Rs2,500
per month. Gradually, the demand for Shahbhais services extended to washing and ironing police uniforms. This helped him to earn even
more. Last year Shahbhai got his cabin electrified, by extending a connection from a relatives house close by. He pays them Rs100 rent
every month. Now he is able to keep the cabin open till late at night for travelers who visit his stall while waiting for the bus.
This trade has helped Shahbhai to improve his standard of living considerably. He feels more secure and happy. His children are
studying in a village school. Shahbhais future plans include sending his children to high school outside the village and getting an electricity
connection for his home.
Source: India study team.
156 Assessing the Impact of Transport and Energy Infrastructure on Poverty Reduction
for both males and females. Similarly, the illiteracy rate
was higher in poor households living farther from good
roads than in households located close to roads. However,
males in nonpoor households living farther from a good
road had a lower illiteracy rate than those living close to
roads. This was also true for females living in nonpoor
households with electricity but far from the road, but for
females in nonpoor households without electricity, road
access made no difference in literacy rates. This suggests
that electricity might have been a marker of modernity
among nonpoor households.
Though nonpoor household members (male and
female) were more likely than poor household members
to continue on to secondary education, the percentages
were higher in electrified households than in nonelectrified
households for both groups. They were also generally
higher in households close to good roads than in house-
holds located far from roads. The exception was males
living in nonpoor, electrified households far from the roads,
who were slightly more likely to have completed a sec-
ondary education than males living in nonpoor, electrified
households close to the roads. This exception, however,
did not hold true for females. Minor variations in these
patterns occurred across the four districts.
Occupations. As to occupational structure, in
Jamnagar District no major differences were observed in
the pattern between poor and nonpoor households. Farm
owners, both poor and nonpoor, were disproportionately
likely to have electricity. Among households that did not
have access to electricity, a disproportionate share were wage
earners rather than farmers. Poor households in this cat-
egory that were located closer to roads were more likely to
be agricultural laborers, whereas those located farther from
the roads were more likely to be gaining income from
non-agricultural employment. In contrast, nonpoor house-
holds without electricity were more likely to be agricul-
tural laborers, regardless of their distance from the roads.
Bharuch District showed a similar pattern. Farmers,
both poor and nonpoor, were somewhat more likely, and
wage earners less likely, to have electricity. However, in
the case of Bharuch District, households without electric-
ity located far from the roads were more likely to be
involved in agricultural wage work, while households
located near the roads, poor or nonpoor, were more likely
to be involved in nonfarm occupations. The difference
between these two districts may have reflected differences
in the structure of their local labor markets.
The data for the site in Panchmahal District were some-
what different. Among poor households, little variation in
occupational patterns was related to road or electricity
access. Few of the nonpoor farm households had both
good road access and electricity, while nonpoor wage earn-
ers (who were predominantly nonagricultural) were more
likely to have access to both services. Electricity was also
important for households engaged in government or non-
government organization
(NGO) activities, trade, or small
business. Location near the road was also important for
those engaged in business or trade.
In Kuchchh, with its more diversified occupational
distribution, it was more difficult to ascertain the rela-
tionships between occupation and access to roads and elec-
tricity. Among poor households, farmers were more likely
than others to have electricity but be located far from the
main road. Agricultural wage earners were most likely
not to have access either to roads or electricity, while non-
agricultural wage earners were more likely to have both
services. A similar pattern held among nonpoor house-
holds, although the differences between agricultural and
nonagricultural wage earners were less marked. Nongov-
ernment employment and self-employment were also
important in Kuchchh. Both poor and nonpoor house-
holds employed by NGOs were disproportionately more
likely to be electrified and to live closer to a good road.
Poor self-employed households were less likely to have
access to electricity or a good road, while nonpoor self-
employed households were likely to have one service or
the other, but not both.
Very few households reported changes in occupation
due to the provision of transport or electricity. By far the
largest number of such households was reported in
Kuchchh District. Most of these changes took place in
response to the port development. Change affected both
poor and nonpoor households, which shifted from agri-
cultural wage work to nonagricultural wage work, petty
commerce and small business, and NGO employment.
In other districts, the changes were mainly from agricul-
tural wage work to nonagricultural wage work and petty
shopkeeping. Both poor and nonpoor households par-
ticipated in these changes, with the poor slightly more
likely to change in response to energy improvements and
the nonpoor being slightly more likely to change in
response to transport improvements (including the port).
No major differences in the pattern of landholdings
were observed among the four subsamples, nor could much
difference be seen in cropping patterns or livestock own-
ership, except that nonpoor electrified households in
Panchmahal District were less likely than others to own
livestock. This may be because some of them had shifted
to nonagricultural occupations. In line with the findings
India Country Study 157
on occupational structure, agricultural wage income was
a more important source of income than farm sales for
nonelectrified poor households in Jamnagar District and
for all nonelectrified households in Bharuch District. In
Panchmahal and Kuchchh, nonagricultural income was
more important than agricultural wage income, particu-
larly for electrified households, both poor and nonpoor.
Income. Relatively few households in the Jamnagar
sample reported changes in income due to the provision
of access to transport (Table 7.11). In Bharuch, more than
10% of the sample households reported such changes. In
Panchmahal, the proportion was above 15%, and in
Kuchchh it was considerably higher, around 40%. In
Bharuch, households living farther from the road were
more likely to experience income changes as a result of
road improvements, particularly nonpoor households that
also had access to electricity. In contrast, in Kuchchh those
living closer to the road were more likely to see income
benefits. Common factors cited in all locations were
improvements in the village economy, better prices for
farm products, more product sales, better wages, and more
wage-paying jobs both inside and outside the village. In
Kuchchh, major impacts also came from the construction
of Mundra port and related facilities. These changes ben-
efited poor and nonpoor households in approximately
equal proportions.
Transport impacts were recorded both for households
living close to the improved road and for households liv-
ing some distance away, while electricity impacts were
recorded only for electrified households (Table 7.12). Elec-
tricity made relatively little difference in incomes for both
poor and nonpoor households in Jamnagar District. In
Bharuch, electricity had some impact on poor households
and a somewhat greater impact on nonpoor households
far from the improved roads. In Panchmahal, poor house-
holds were more likely to have benefited economically
from electricity than nonpoor households. The greatest
impact of electricity on incomes was noted in Kuchchh
District, where the poor were slightly more likely to have
benefited than the nonpoor. The quality of road access
made little difference in the ability of electrified house-
holds to benefit from electricity.
Health. More than half of all sample households in
each location (except Jamnagar) thought that improved
transport had helped to improve their health, mainly
through improved access to health care facilities (Table
7.13). In Jamnagar District, about 35% of the poor
respondents and 40% of the nonpoor respondents saw posi-
With Electricity Without Electricity
Close to Road Far from Road Close to Road Far from Road
Jamnagar District
Poor 0 4 0 6
Nonpoor 2 0 0 3
Bharuch District
Poor 11 10 3 21
Nonpoor 9 34 4 17
Panchmahal District
Poor 18 20 13 16
Nonpoor 0 22 14 20
Kuchchh District
Poor 39 32 42 31
Nonpoor 50 31 53 43
Entire Sample
Poor 20 21 15 18
Nonpoor 17 16 17 24
Table 7.11. Change in Household Income Due to Transport Improvements
(Percent of households in each group reporting change)
Source: India study team field surveys, 2002.
158 Assessing the Impact of Transport and Energy Infrastructure on Poverty Reduction
With Electricity Without Electricity
Close to Road Far from Road Close to Road Far from Road
Jamnagar District
Poor 14 19 66 44
Nonpoor 36 35 57 53
Bharuch District
Poor 83 90 55 96
Nonpoor 66 98 70 93
Panchmahal District
Poor 52 68 64 76
Nonpoor 57 85 64 78
Kuchchh District
Poor 63 51 58 54
Nonpoor 50 39 45 49
Entire Sample
Poor 50 61 62 72
Nonpoor 45 54 58 66
Table 7.13. Change in Household Health Due to Transport Improvements
(Percent of households in each group reporting change)
Source: India study team field surveys, 2002.
tive health impacts from road improvements. With
better transport services, it became easier to take
patients to clinics or hospitals in nearby towns. Pre-
natal and postnatal care also improved, because the dis-
trict nurse visited the villages more frequently. Poor
households, nonelectrified households, and those living
farther from improved roads were more likely than oth-
ers to recognize such positive impacts on health. These
views, expressed in the village and household interviews,
were reinforced by findings from focus group discus-
sions in the four locations. In the focus groups, partici-
pants consistently ranked health care impacts as the most
important benefits derived from rural transport improve-
ments.
In the case of electricity, more than half of the
sample households in three of the four locations, and
3540% in Bharuch District, saw a positive
impact of electricity on the health of their family mem-
bers (Table 7.14). Positive health impacts due to elec-
tricity were attributed to greater ease in reading, bet-
ter food preservation, and improved health care
facilities, as well as better care of the elderly and chil-
dren. No significant variation was apparent in the
frequency of these impacts depending on whether a
household had direct access to an improved road.
With Electricity
Close to Road Far from Road
Jamnagar District
Poor 0 4
Nonpoor 2 3
Bharuch District
Poor 11 10
Nonpoor 7 20
Panchmahal District
Poor 20 18
Nonpoor 0 15
Kuchchh District
Poor 33 34
Nonpoor 24 20
Entire Sample
Poor 20 20
Nonpoor 9 11
Table 7.12. Change in Household Income Due to
Energy Improvements
(Percent of households in each group reporting change)
Source: India study team field surveys, 2002.
India Country Study 159
These interventions were instead seen as benefiting
the community as a whole.
Education. In the case of education as well, a
majority of respondents in all groups agreed that
transport investments had a positive impact on edu-
cation (Table 7.15). The identified mechanisms of
transport impact were better access to schools, bet-
ter access to news and information, greater avail-
ability of study materials, and better conditions for
girls education (Box 7.3). This last effect is prob-
ably due to improved safety and security of road trans-
port, which came out in the focus group discussions
as an important factor affecting girls access to
schooling. These impacts were reported by both poor
and nonpoor households and varied little across
sample subgroups.
In contrast, relatively few respondents thought
that access to electricity had improved educational
outcomes (Table 7.16). This lack of educational
impact could be attributed to the irregular supply of
electricity. Only in Panchmahal District was there a
strong positive response: there, the impacts of elec-
tricity on education were seen to come mainly from
improved lighting, helping students to complete their
homework, and from better access to news and in-
formation from television and radio. Households living
near and far from the roads differed little in their responses
to these questions.
Information and Communication. Survey
respondents were also asked about the impact of transport
and energy improvements on their access to news and
information (Table 7.17). Practically all of the respon-
dents felt that road improvements had a positive impact.
Road impacts on access to information are largely due to
increased personal travel and to the greater availability of
newspapers and other sources of information. No signifi-
cant differences between poor and nonpoor households
were seen in the effects of transport improvements on
access to information.
With Electricity
Close to Road Far from Road
Jamnagar District
Poor 72 49
Nonpoor 55 35
Bharuch District
Poor 38 41
Nonpoor 36 46
Panchmahal District
Poor 59 55
Nonpoor 61 66
Kuchchh District
Poor 62 58
Nonpoor 40 57
Entire Sample
Poor 63 52
Nonpoor 50 48
Table 7.14. Change in Household Health Due to
Energy Improvements
(Percent of households in each group reporting change)
Source: India study team field surveys, 2002.
Box 7.3. A Boost for Girls Education
Ambitious and smart-looking, Lakshmi, age 12, a resident of Moti Bharad village in Jamjodhpur taluka of Jamnagar district,
studies at a boarding school in a nearby town. She comes from an upper-caste Patel family. Her mothers only aspiration is to make
Lakshmi a doctor. Lakshmi had come home to spend the summer vacation with her family. When the study team visited her village,
she was the only woman in the household who could communicate with the team in Hindi, as the local dialect is different from the
commonly spoken Gujarati.
Lakshmi narrated the story of her sister, about 67 years older than she. Then, the village school had provision for education only
up to 7th standard, so, to complete her education up to 9th standard, her sister, along with a few other village girls, used to walk for
about 45 km to a neighboring, larger town. Every day, the one-way trip took between 40 and 45 minutes. Since the construction of
the approach road to Moti+ Bharad, however, buses have started plying the towns. Now, the girls of this village can commute to school
by bus, and some, like Lakshmi, are attending a boarding school, avoiding the daily commuting and using the bus to return home for
weekends. (Parents like Lakshmis worry that the bus is not safe or reliable.) All this has been made possible by roads. With improved
quality and frequency of transport, the dream of many more Lakshmis can come true.
Source: India study team.