Dust Explosions in the Process Industries Second Edition phần 6 doc
Bạn đang xem bản rút gọn của tài liệu. Xem và tải ngay bản đầy đủ của tài liệu tại đây (3.98 MB, 66 trang )
Propagation
of
flames
in
dust clouds
32
1
Ti
is the ignition temperature
of
the dust cloud
L
is the heat losses, by radiation and conduction
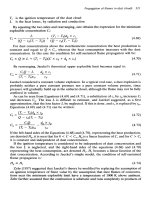
By equating the two sides and rearranging, one obtains the expression for the minimum
explosible concentration
C,:
(4.69)
For dust concentrations above the stoichiometric concentration the heat production is
constant and equal to
Q
x
C,,
whereas the heat consumption increases with the dust
concentration. In this case the condition for self-sustained flame propagation will be:
Cs
X
Q
2
L
+
(Ti
-
To)(C
x
cd
+
dg
x
c,)
By
rearranging, Jaeckel’s theoretical upper explosible limit becomes equal to:
(4.70)
(4.71)
Jaeckel considered a constant volume explosion. In a typical real case, a dust explosion is
probably neither a pure constant pressure nor a pure constant volume process, since
pressure will gradually build up in the unburnt cloud, although the flame may not be fully
confined in volume.
As can be seen from Equations
(4.69)
and
(4.71),
a substitution of
c,
by
cp
increases
CI
and decreases
C,.
The
loss
L
is difficult to estimate, and Jaeckel suggested, as a first
approximation, that the loss factor
L
be neglected. If this is done, and
c,
is replaced by
cp,
Equations
(4.69)
and
(4.71)
can be written:
(4.72)
(4.73)
If the left-hand sides
of
the Equations
(4.68)
and
(4.70),
representing the heat production,
are denoted
Hp,
it is seen that for
0
<
C
<
C,,
Hp
is
a linear function
of
C,
and for
C
>
C,
it is constant and independent
of
dust concentration.
If the ignition temperature is considered to be independent
of
dust concentration and
the
loss
L
is neglected, and the right-hand sides of the equations
(4.68)
and
(4.70)
representing the heat consumption, are denoted
H,, H,
becomes a linear function
of
the
dust concentration. According to Jaeckel’s simple model, the condition
of
self-sustained
flame propagation is:
Hp
3
H,
(4.74)
Zehr
(1957)
suggested that Jaeckel’s theory be modified
by
replacing the assumption
of
an ignition temperature
of
finite value
by
the assumption that dust flames
of
concentra-
tions near the minimum explosible limit have a temperature
of
loo0
K
above ambient.
Zehr further assumed that the combustion is adiabatic and runs completely to products
of
322
Dust Explosions in the Process Industries
the highest degree
of
oxidation, and that the dust particles are
so
small that the dust cloud
can be treated as a premixed gas. The resulting equations for the minimum explosible
concentration in air are:
1000
M
107
m
+
2.966[Qm
-
CAZ]
CI
=
wm31
for constant pressure, and
1OOOM
107
m
+
4.O24[Qm
-
CAU]
c,
=
wm31
(4.75)
(4.76)
for constant volume. Here
M
is the mole weight of the dust and
m
the number of moles
of
O2
required for complete oxidation
of
1
mole of dust.
Q,
is the molar heat
of
combustion
of the dust,
CAI
the enthalpy increase of the combustion products and
CAU
the energy
increase
of
the combustion products.
Schonewald
(1971)
derived a simplified empirical version of Equation
(4.75)
that also
applies to dusts containing a mass fraction
(I
-
a)
of inert substance,
a
being the mass
fraction of combustible dust:
C,/a
c;
=
1
-
2.966(1
-
a)c,CI/a
(4.77)
where the minimum explosible dust concentration without inert dust is
C,
=
-
1.032
+
1.207
X
lO6/Q0,
Qo
being the heat of combustion per unit mass (in J/g), as determined
in a bomb calorimeter.
As
can be seen from Freytag
(1965),
Equations
(4.75)
and
(4.76)
were used in
F.
R.
Germany for estimating minimum explosible dust concentrations, but
in more recent years this method has been replaced by experimental determination.
Table
4.11
gives examples of minimum explosible dust concentrations calculated from
Equations
(4.75)
and
(4.76),
as well as some experimental results for comparison. The
calculated and experimental results for the organic dusts polyethylene, phenol resin and
starch are in good agreement. This would be expected from the assumptions made in
Zehr’s theory. However, the result for graphite clearly demonstrates that Zehr’s assump-
tion of complete combustion
of
any fuel as long as oxygen is available, is inadequate for
other types
of
fuel. The results for bituminous coal and the metals also reflect this
deficiency.
Buksovicz and Wolanski
(1983)
postulated that at the minimum explosible concentration,
flames
of
organic dusts have the same temperature as lower limit flames
of
premixed
hydrocarbon gadair. They then proposed the following simple semi-empirical correlation
between the heat
of
combustion (calorific value)
Q
[KJ/kg] of the dust, and the minimum
explosible concentration
C,
[g/m3] in air at normal pressure and temperature:
CI
=
1.55
x
lo7
x
Q-’.21
(4.78)
The assumptions implied confine the applicability
of
this equation to the same dusts
to
which Zehr’s Equations
(4.75)
and
(4.76)
apply. For starch, Equation
(4.78)
gives
Cl
=
114
g/m3, which is somewhat higher than the value of
70
g/m3 found experimentally
by Proust and Veyssiere
(1988),
but close to that calculated by Zehr for constant pressure.
For polyethylene, Equation
(4.78)
gives
36
g/m3, in close agreement with both exper-
iments and Zehr’s calculations.
Propagation of flames
in
dust
clouds
323
Table
4.11
data published by Freytag
(1
965). Comparison with experimental data
Minimum explosible dust concentrations calculated by the theory
of
Zehr (1957). Most
Dust type
Phenol resin
Maize
starch
explosible dust explosible dust
concentration
Lunn
(1988)
also investigated this group
of
materials and obtained further support for
the hypothesis that the minimum explosible concentration
of
organic dusts that burn more
or
less completely in the propagating flame, is primarily a function
of
the heat
of
combustion
of
the dust.
Shevchuk
et
af.
(1979),
being primarily concerned with metal dusts, advocated the view
that a discrete approach, considering the behaviour and interaction
of
individual particles,
is necessary for producing an adequate theory
for
the minimum explosible dust concentra-
tion. They analysed the distribution
of
a heat wave in a dilute suspension
of
monosized
solid fuel particles in a gas, assuming no relative movement between particles and gas, no
radiative heat transfer, and that the rate
of
heat production
qp
during combustion
of
a
single particle
of
mass
mp
was constant during the entire burning lifetime
fb
of the particle,
and equal to
qp
=
QmP/tp,
where
Q
is the heat
of
combustion
of
the particle material. The
resulting equation
for
the minimum explosible dust concentration, assuming that the
324
Dust Explosions
in
the Process Industries
Powder
type
Aluminium
Magnesium
rmum
Iron
Mawanew
average flame temperature equals the ignition temperature
Ti
of the dust cloud as
determined in a heated-wall furnace, was:
TI
Eqn.
(4.72)
Eqn.
(4.79)
[Kl [g/m3] [glm3]
920 25 51
890 29
62
600 21
44
590 52 107
730
62 129
(4.79)
Here
TO
is the ambient temperature,
cg
and
cd
the heat capacities
of
gas and dust material,
pg
the gas density and
F
a special particle distribution factor resulting from this particular
analysis, and which causes Equation (4.79) to differ from Jaeckel’s Equation (4.72). Using
Ti
data from Jacobson
et
al.
(1964), Shevchuk
et
al.
compared Equations (4.72) and (4.79)
as shown in Table 4.12.
Reliable experimental data for metal dusts are scarce. However, Schlapfer (1951) found
a value of 90 g/m3 for fine aluminium flakes, which indicates that both equations
underestimate the minimum explosible concentration considerably, Equation (4.72) by a
factor
of
nearly four and (4.79) by a factor
of
nearly two. One main reason for this is
probably the use of the ignition temperature
Ti
as a key parameter.
Mitsui and Tanaka (1973) derived a theory for the minimum explosible concentration
using the same basic discrete microscopic approach as adopted later by Nomura and
Tanaka (1978) for modelling laminar flame propagation in dust clouds, and discussed in
Section 4.2.4.4. Working with spherical flame propagation, they defined the minimum
explosible dust concentration in terms
of
the time needed from the moment
of
ignition
of
one particle shell to the moment when the air surrounding the particles in the next shell
has been heated to the ignition temperature of the particles. If this time exceeds the total
burning time
of
a particle, the next shell will never reach the ignition temperature.
Because this heat transfer time increases with the mean interparticle distance, it increases
with decreasing dust concentration. By using some empirical constants, the theory
reproduced the trend of experimental data for the increase of the minimum explosible dust
concentration
of
some synthetic organic materials with mean particle size in the coarse size
range from 100-500 pm particle diameter.
Nomura, Torimoto and Tanaka (1984) used a similar discrete theoretical approach for
predicting the maximum explosible dust concentration. They defined this upper limit as
the dust concentration that just consumed all available oxygen during combustion,
assuming that a finite limited quantity
of
oxygen, much less than required for complete
combustion, was allocated for partial combustion
of
each particle. Assuming that oxygen
diffusion was the rate controlling factor, they calculated the total burning time of a particle
in terms of the time taken for all the oxygen allocated to the particle to diffuse to the
Propagation of flames
in
dust clouds
325
particle surface. In order for the flame to be transmitted to the next particle shell, the
particle burning time has to exceed the heat transfer time for heating the gas surrounding
the next particle shell to the ignition temperature. Equating these two times defines the
maximum explosible dust concentration. Two calculated values were given, namely
1400
g/m3 for terephthalic acid
of
40
pm particle diameter and
4300
g/m3 for aluminium
of
30
pm particle diameter. The ignition temperatures for the two particle types were taken
as
950
K and
10oO
K respectively.
Bradley
et
al.
(1989)
proposed a chemical kinetic theoretical model for propagation
of
flames
of
fine coal dust near the minimum explosible dust concentration. It was assumed
that the combustion occurred in premixed volatiles (essentially methane) and oxidizing
gas, the char particles being essentially chemically passive. The predicted minimum
explosive concentrations were in good agreement with experimental values (about
100
g/m3 for
40%
volatile coal, and
500
g/m3 for
1&15%
volatiles)
4.3
NON-LAMINAR DUST FLAME PROPAGATION PHENOMENA
IN
VERTICAL DUCTS
This section will treat some transitional phenomena that are observed under conditions
where laminar flames could perhaps be expected. This does not include fully turbulent
combustion, which will be discussed in Section
4.4.
Buksowicz
et
al.
(1982)
and Klemens and Wolanski
(1986)
describe experiments with a
lignite dust
of
52%
volatiles,
6%
ash and
<
75
pm particle size, in a
1.2
m long vertical
duct of rectangular cross section of width
88
mm and depth
35
mm. The duct was closed at
the top and open at the bottom. Dust was fed at the top by a calibrated vibratory feeder
yielding the desired dust concentration. The ignition source (an electric spark
of
a few
J
energy or a gas burner flame) was located near the open bottom end. Flame propagation
and flame structure were recorded through a pair
of
opposite
80
mm
X
80
mm glass
windows. Diagnostic methods included Mach-Zehnder interferometry, high-speed fram-
ing photography, and high-frequency response electrical resistance thermometry. Figure
4.31
shows a compensation photograph of a lignite dust/air flame propagating upwards in
the rectangular duct. The heterogeneous structure of the flame, which is typical for dust
flames in general, is a striking feature. This is reflected by the marked temperature
fluctuations recorded at fixed points in the flame during this kind
of
experiments, as shown
in Figure
4.32.
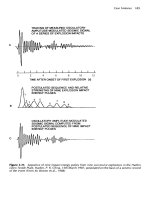
The amplitudes
of
the temperature oscillation with time are substantial, up to
loo0
K.
The very low temperature
of
almost ambient level at about
1.1
s
in Figure
4.32b
shows
that at this location and moment there was probably a pocket
of
cool air or very dilute,
non-combustible dust cloud. Klemens and Wolanski
(1986)
were mainly concerned with
quite low dust concentrations. From quantitative analysis of their data they concluded that
the thickness
of
the flame front was
11-12
mm, whereas the total flame thickness could
reach
0.5
m due to the long burning time (and high settling velocities) of the larger
particles and particle agglomerates. The flame velocities relative to unburnt mixture
of
0.5-0.6
m/s
were generally about twice the velocity for lean methane/air mixtures in the
326
Dust Explosions in the Process Industries
Figure
4.31
Compensation photograph of a
80g/m3 lignite dust/air flame in a vertical rec-
tangular duct of width
88
mm (From Buksowicz,
Klemens and Wolanski,
1982)
same apparatus. This was attributed to the larger flame front area for the dudair mixture,
and to the intensification
of
the heat and mass exchange processes in the dudair flame.
Even for Reynolds’ numbers
of
less than
2000
(calculated as proposed by Zeldovich
et
al.
(1980))
eddies, generated by the non-uniform spatial heat generation rate caused by the
non-uniform dust cloud, could be observed in the flame front.
Gmurczyk and Klemens
(1988)
conducted an experimental and theoretical study
of
the
influence of the non-uniformity
of
the particle size distribution on the aerodynamics
of
the
combustion
of
clouds
of
coal dust in air. It was suggested that the non-homogeneous
particle size, amplified by imperfect dust dispersion, produces a non-homogeneous heat
release process, and leads to the formation
of
vortices.
Propagation of flames in dust clouds
327
Figure
4.32
Temperature variation with time at four fixed
locations in a
103
g/m3 lignite/air dust flame propagating
in a vertical duct of
88
mm
x
35
mm rectangular cross
section. Temperature
probe
locations: a
=
2
mm from
duct wall;
b
=
6
mm from duct wall;
c
=
26
mm from
duct wall; d
=
44
mm from duct wall
(=
duct centre)
(From Klemens and Wolanski,
7
986)
Deng Xufan
et
al.
(1987) and Kong Dehong (1986) studied upwards flame propagation
in airborne clouds of Ca-Si dust and coal dust, in a vertical cylindrical tube of i.d. 150 mm
and length 2 m. The tube was open at the bottom end and closed at the top. The Ca-Si
dust contained 58% Si, 28% Ca, and 14% Fe,
Al,
C etc. and had a mean particle diameter
of
about 10 pm. The Chinese coal dust from Funsun contained 39% volatiles and 14% ash
and had a median particle diameter by mass of
13
pm. The dust clouds were generated by
vibrating a
300
pm aperture sieve, mounted at the top
of
the combustion tube and charged
with the required amount
of
dust, in such a way that a stationary falling dust cloud
of
constant concentration existed in the tube for the required period
of
time. The dust
concentration was measured by trapping a given volume of the dust cloud in the tube
between two parallel horizontal plates that were inserted simultaneously, and weighing
the trapped dust. Ignition was accomplished by means
of
a glowing resistance wire coil at
the tube bottom, after 10-20
s
of vibration
of
the sieve. Upwards flame velocities and
flame thicknesses were determined by means
of
two photodetectors positioned along the
328
Dust Explosions in the Process Industries
tube. For the Ca-Si dust, flame velocities were in the range
1.3-1.8
m/s,
and the total
thickness
of
the luminous flame extended over almost the total
2
m length of the tube. The
net thickness of the reaction zone was not determined. Figure
4.33
shows a photograph
of
a Ca-Si dust flame propagating upwards in the
150
mm diameter vertical tube.
Figure
4.34
gives the average upwards flame velocities in clouds of various concentra-
tions of the Chinese coal dust in air.
On average these flame velocities for coaVair are about half those found for the Ca-Si
under similar conditions. The data in Figure
4.34
indicate a maximum flame velocity at
about
500
g/m3. If conversion of these flame velocities to burning velocities is made by
Figure
4.33
vertical combustion tube (From Deng Xufan
et
at.,
1987)
Photograph of upwards flame propagation in a Ca-Si dust cloud in the
150
mm
i.d.
Propagation of flames in dust clouds 329
assuming some smooth convex flame front shape, the resulting estimates are considerably
higher than the expected laminar values. This agrees with the conclusion
of
Klemens and
Wolanski
(1986)
that this kind
of
dust flames in vertical tubes will easily become
non-laminar due to non-homogeneous dust distribution over the tube volume.
Figure
4.34
Upwards flame velocity versus
con-
centration of dry coal dust in air
in
vertical tube of
i.d. 150 mm, open at bottom and closed at top.
Coal dust from
Funsun
in
P. R.
China, 39% vola-
tiles and
14%
ash. Median particle diameter by
mass
13
prn,
and particle density 2.0-2.5 g/cm3
(Data from Kong Dehong,
1986)
In the initial phase of the experiments
of
Proust and Veyssiere (1988) in the vertical tube
of
0.2 m
x
0.2 m square cross section, non-laminar cellular flames as shown in Figure
4.35 were observed. In these experiments the height
of
the explosion tube was limited
to
2 m. Over the propagation distance explored, the mean flame front velocity was about
0.5
ds,
as for the proper laminar flame, but careful analysis revealed a pulsating flame
movement of about 60 Hz.
A
corresponding 60 Hz pressure oscillation, equal to the
fundamental standing wave frequency for the one-end-open 2 m long duct, was afso
recorded inside the tube. Further, a characteristic sound could be heard during the
propagation
of
the cellular flames. Proust and Veyssiere, referring to Markstein’s (1964)
discussion of cellular gas flames, suggested that the observed cellular flame structure is
closely linked with the 60 Hz acoustic oscillation. However, there seems to be no
straightforward relationship between the cell size and the frequency of oscillation.
It is of interest to relate Proust and Veyssiere’s discussion of the role of acoustic waves
to the maize starch explosion experiments of Eckhoff et
al.
(1987) in a 22 m long vertical
cylindrical steel silo of diameter 3.7 m, vented at the top. Figure 4.36 shows a set of
pressure-versus-time traces resulting from igniting the starcwair cloud in the silo at 13.5 m
above the silo bottom, i.e. somewhat higher up than half-way.
This kind
of
exaggerated oscillatory pressure development occurred only when the
ignition point was in this region. The characteristic frequency
of
4-7 Hz agrees with the
theoretical first harmonic standing wave frequency in a 22 m long one-end-open pipe
(22
m
=
i
wave length). The increase
of
frequency with time reflects the increase
of
the
average gas temperature as combustion proceeds. It is interesting to note that the peak
amplitude occurs at about 2 s after ignition. The pulsating flow probably gradually distorts
the flame front and increases the combustion rate. The oscillatory nature
of
this type
of
explosion could be clearly seen on video recordings. ‘Packets’ of flames were ejected at a
frequency matching exactly that of the pressure trace. Similar oscillations were also
generated in experiments in the 236 m3 silo when the vent was moved from the silo roof
to
the cylindrical silo wall, just below the roof (Eckhoff
et
al.,
1988).
330
Dust Explosions in the Process Industries
Figure
4.35
Photograph
of
a
typical cellular
flame in
150
g/m3
maize starch
in
air,
at
7.5
m
above the ignition point. Upwards propagating
flame in a vertical duct of
0.2 m
x
0.2
m
cross
section (From Proust and Veyssiere,
7
988)
Propagation of flames in dust clouds 33
1
Figure
4.36
Maize starch/air explosion in
a
vertical cylindrical silo of height
22
rn
and diameter 3.7 m
and with an open 5.7
rn2
vent in the roof. Oscillatory pressure development resulting from ignition in
upper half of silo (13.5
rn
above bottorn).Oscillations persisted for about
5
s.
Dust concentration
400-600
g/rn’.
P,,
Pr
and
P3
were located at
3,
9 and 19.5
rn
above silo bottom respectively (From
Eckhoff
et
al., 1987)
Artingstall and Corlett
(1965)
analysed the interaction between a flame propagating
outwards in a one-end-open duct, and reflected shock waves, making the simplifying
assumptions that:
0
The initial shock wave and the flame are immediately formed when the ignition takes
0
The burning velocity, i.e. the speed of flame relative to the unburnt reactants, is
0
Friction can be neglected.
0
The effect of having to disperse the dust can be neglected.
They realized that the three first assumptions are not in accordance with realities in long
ducts, where extensive flame acceleration is observed, but they indicated that their
theoretical analysis can be extended to accelerating flames by using numerical computer
models. It
is
nevertheless interesting to note that the simplified calculations predict the
kind
of
oscillation shown in Figure
4.36.
The calculations in fact showed that before the
flame reached the open end, the air velocity at the open end could become negative, i.e.
the air would flow inwards. Further reflections would cause the flow to reverse again.
Artingstall and Corlett suggested that this theoretical result could help to explain the
pulsating flow observed in some actual dust explosions in experimental coal mine galleries.
place and immediately have constant velocities.
constant.
332
Dust Explosions in
the
Process
lndustries
It is of interest to mention in this context that Samsonov (1984) studied the development
of
a propagating gas flame in an impulsive acceleration field generated by a free falling
explosion chamber being suddenly stopped by a rubber shock absorber. He observed
flame folding phenomena typical
of
those resulting from Taylor instabilities. These
phenomena were also similar to those resulting from passage of a weak shock wave
through a flame.
Essenhigh and Woodhead (1958) used an apparatus similar to that used by Schlapfer
(1951), but of a large scale, for investigating flame propagation in clouds of cork dust in air
in a one-end-open vertical duct. The duct was
5
m long and of diameter either
760
or
510 mm. They studied both upwards and downwards propagating flames, and ignition at
the closed as well as the open end. With ignition at the open end and upwards flame
propagation, constant flame velocities of 0.4-1.0 m/s were measured. For upwards
propagation and the top end open, the maximum flame speeds were about 20 m/s. Some
of this difference was due to the expansion ratio burdunburnt, but some was also
attributed to increased burning rate.
Photographs
of
the flames were similar to Figures 4.31 and 4.33. Total flame thicknesses
were in the range 0.2-1.2 m. The minimum explosible concentration
of
cork dust in air
was found to be
50
k
10
g/m3 independent
of
median particle size by mass in the range
15&250 pm.
Phenomena of the kind discussed in the present section are important for the
explanation of moderate deviations from ideal laminar conditions. However, the substan-
tial deviations giving rise to the very violent explosions that can occur in industry and coal
mines, are due to another mechanism, namely combustion enhancement due to flow-
generated turbulence.
4.4
TURBULENT FLAME PROPAGATION
4.4.1
TURBULENCE AND TURBULENCE MODELS
Before discussing combustion
of
turbulent dust clouds, it is appropriate to include a few
introductory paragraphs to briefly define and explain the concept of turbulence.
A
classical source
of
information is the analysis by Hinze (1975). His basic theoretical
definition
of
turbulent fluid flow is ‘an irregular condition
of
flow in which the various
quantities show a random variation with time and space coordinates,
so
that statistically
distinct average values can be discerned’. Turbulence can be generated by friction forces
at fixed walls (flow through conduits, flow past bodies)
or
by the flow
of
layers of fluids
with different velocities past
or
over one another. There is a distinct difference between
the kinds of turbulence generated in the two ways. Therefore it is convenient to classify
turbulence generated and continuously affected by fixed walls as ‘wall turbulence’ and
turbulence in the absence of walls as ‘free turbulence’.
In the case
of
real viscous fluids, viscosity effects will result in the kinetic energy of flow
being converted into heat. If there is no continual external source of energy for
maintaining the turbulent motion, the motion will decay. Other effects of viscosity are to
Propagation of flames in dust clouds
333
make the turbulence more homogeneous and to make it less dependent on direction. The
turbulence is called isotropic if its statistical features have no preference for any direction,
so
that perfect disorder exists. In this case, which is seldom encountered in practice, no
average shear stress can occur and, consequently, no gradient
of
the mean velocity. The
mean velocity, if any, is constant throughout the field.
In all other cases, where the mean velocity shows a gradient, the turbulence will be
non-isotropic
(or
anisotropic). Since this gradient in mean velocity is associated with the
occurrence
of
an average shear stress, the expression ‘shear-flow turbulence’ is often used
to designate this class
of
flow. Most real turbulent flows, such as wall turbulence and
anisotropic free turbulence fall into this class.
If one compares different turbulent flows, each having its distinct ‘pattern’, one may
observe differences, for instance, in the size of the ‘patterns’. Therefore, in order to
describe a turbulent motion quantitatively, it is necessary to introduce the concept of scale
of
turbulence. There is a certain scale in time and a certain scale in space. The magnitude
of these scales will be determined by the geometry of the environment in which the flow
occurs and the flow velocities. For example, for turbulent flow in a pipe one may expect a
time scale of the order
of
the ratio between pipe diameter and average flow velocity, i.e.
the average time required for a flow to move a length of one pipe diameter, and a space
scale
of
the order
of
magnitude of the diameter of the pipe.
However, it is insufficient to characterize a turbulent motion by its scales alone, because
neither the scales nor the average velocity tell anything about the violence of the motion.
The motion violence is related to the fluctuation of the momentary velocity, not to its
average value. If the momentary velocity is:
v=v+v
(4.80)
where
t
is the average velocity and
v
the momentary deviation,
V
is zero per definition.
However,
i2
will be positive and it is customary to define the violence
of
the turbulent
motion, often called the intensity
of
the turbulence by
(4.81)
The relative turbulence intensity is then defined by the ratio
v’tv.
As discussed by Beer, Chomiak and Smoot
(1984)
in the context of pulverized coal
combustion, it is customary to distinguish between three main domains of turbulence,
namely large-scale, intermediate-scale and small-scale. The large-scale turbulence is
closely linked to the geometry
of
the structure in which the flow exists. Large-scale
turbulence is characterized by strong coherence and high degree of organization
of
the
turbulence structures, reflecting the geometry of the structure. For plane flow the
coherent large-scale structures are essentially two-dimensional vortices with their axes
parallel with the boundary walls.
For
flow in axi-symmetric systems, concentric large-scale
vortex rings are formed. The theoretical description of the three-dimensional large-scale
vortex structures encountered in practice presents a real challenge. Also experimental
investigation
of
such structures is very difficult. According to Beer, Chomiak and Smoot,
the lack of research in this area is the most serious obstacle to further advances in
turbulent combustion theory.
On all scale levels turbulence has to be considered as a collection
of
long-lasting vortex
structures, tangled and folded in the fluid. This picture is quite different from the idealized
hypothetical stochastic fluctuation model
of
isotropic turbulence. Beer, Chomiak and
334 Dust Explosions in the Process Industries
Smoot argue against the common idea that the small-scale structures are randomly
distributed ‘little whirls’. According to these authors it is known that the fine-scale
structures of high Reynolds number turbulence become less and less space filling as the
scale size decreases and the Reynolds number increases.
According to Hinze
(1975)
Kolmogoroff postulated that
if
the Reynolds number is
infinitely large, the energy spectrum of the small-scale turbulence is independent of the
viscosity, and only dependent on the rate of dissipation
of
kinetic energy into heat, per
mass unit
of
fluid,
E.
For this range Kolmogoroff arrived at his well-known energy
spectrum law for high Reynolds numbers:
E(a,t)
=
A
x
eZ3
x
(Y-~‘~
(4.82)
E(a,t)
is called the ‘three-dimensional energy spectrum function
of
turbulence’.
(Y
is the
wave number
27rn/v,
where
n
is the frequency
of
the turbulent fluctuation of the velocity,
and
7
is the mean global flow velocity.
A
is a constant, and
E
is the rate
of
dissipation
of
turbulent kinetic energy into heat per unit mass
of
fluid.
Figure
4.37
illustrates the entire three-dimensional energy spectrum
of
turbulence, from
the largest, primary eddies via those containing most
of
the kinetic energy, to the
low-energy range of very high wavenumbers (or very high frequencies). Figure
4.37
includes the Kolmogoroff law for the universal equilibrium range.
In the range of low Reynolds numbers other theoretical descriptions than Kolmogo-
roff’s law are required.
In
principle the kinetic energy
of
turbulence is identical to the
integral of the energy spectrum curve
E(a,
r)
in Figure
4.37
over all wave numbers.
4.37
Illustration ofthe three-dimensional energy spectrum
E(a,
t)
in the various wave numberranges.
I
is Loitsianskii’s integral,
E
is eddy viscosity,
E
is dissipation of turbulent energy into heat per unit time
and mass, andv is kinematic viscosity.
Re,
is
defined as
v’A$u,
where
v‘
is the turbulence intensity as
defined by Equation (4.81), and
A,
is the lateral spatial dissipation scale of turbulence (Taylor
micro-scale) (From Hinze,
1975)
Propagation
of
flames
in
dust clouds
335
A
formally exact equation for
E
may be derived from the Navier-Stokes equations.
However, the unknown statistical turbulence correlations must be approximated by
known or calculable quantities. Comprehensive calculation requires extensive computa-
tional capacity, and it is not yet a realistic approach for solving practical problems.
Therefore simpler and more approximate approaches are needed. One widely used
approximate theory, assuming isotropic turbulence, is the
k
-
E
model by Jones and
Launder
(1972, 1973),
where
k
is the kinetic energy
of
turbulence, and
E
the rate of
dissipation
of
the kinetic energy of turbulence into heat. The
k
-
E
model contains
Equation
(4.82)
as an implicit assumption. The approximate equations for
k
and
E
proposed by Jones and Launder were:
Here
p
is the fluid density, and
u
and
v
the mean fluid velocities in streamwise and
cross-stream directions respectively.
p
is molecular viscosity and
pT
turbulent viscosity.
‘Tk
and
uE
are turbulent Prandtl numbers for
k
and
E
respectively and
c1
and
c2
are empirical
constants or functions of Reynolds number. Both equations are based on the assumption
that the diffusional transport rate is proportional to the product
of
the turbulent viscosity
and the gradients
of
the diffusing quantity. Jones and Launder
(1973)
emphasized that the
last terms
of
the two equations were included on an empirical basis
to
bring theoretical
predictions in reasonable accordance with experiments in the range of lower Reynolds
numbers, where Equation
(4.82)
is not valid. They foresaw future replacements
of
these
terms by better approximations. The
k
-
E
model has been used for simulating turbulent
combustion
of
gases and turbulent gas explosions. More recently, as will be discussed in
Section
4.4.8,
it has also been adopted for simulating turbulent dust explosions.
Whilst the
k
-
E
theory has gained wide popularity, it should be pointed out that it is
only one
of
several theoretical approaches. Launder and Spalding
(1972)
gave a classical
review
of
mathematical modelling of turbulence, including stress transport models, which
is still relevant.
When the structure
of
turbulent dust clouds is to be described, further problems have to
be addressed. Some of these have been discussed in Chapter
3.
Beer, Chomiak and Smoot
(1984)
pointed out that there are two aspects
of
the turbulence/particle interaction
problem. The first is the influence
of
turbulence on the particles, the second the influence
of
particles on the turbulence. With regard to the influence of turbulence on the particles
in a burning dust cloud, two effects are important, namely mechanical interactions
associated with particle diffusion, deposition, coagulation and acceleration, and convect-
ive interactions associated with heat and mass transfer between gas and particles, which
influence the particle combustion rate. Beer, Chomiak and Smoot
(1984)
discussed
available theory for the various regimes
of
Reynolds number (see Chapter
3)
for the
particle motion in the fluid. They emphasized that turbulence is a rotational phenomenon,
and therefore the motion of the particles will also include a rotational component.
Consequently one can define a relaxation time for the particle rotation
-rPr
as well as one
336
Dust Explosions in the Process Industries
for the translatory particle motion,
T~.
Both relaxation times are proportional to the
square of the particle diameter and hence decrease markedly as the particles get smaller.
is the characteristic Lagrangian time
of
the turbulent motion,
the particle is not convected by the turbulent fluctuations and its motion is fully
determined by the mean flow. However, when
T~
T~,
the particle adjusts to the
instantaneous gas velocity. If the particle follows the turbulent fluctuations, its turbulent
diffusivity
is
equal
to
the gas diffusivity. If the particle does not follow the turbulence, its
diffusivity is practically equal to zero. An interesting but most complicated case occurs
when the characteristic relaxation times and turbulence times are
of
the same order. In
this case, the particle only partially follows the fluid and its motion depends partially on
Lagrangian interaction with the fluid and partially on Eulerian interaction over the
distance which it travels outside the originally surrounding fluid.
The effects
of
particles on the turbulence structure are complex. The simplest effect is
the introduction of additional viscous-like dissipation
of
turbulent energy caused by the
slip between the two phases. This effect is substantial in the range
of
explosible dust
concentrations. Even small changes in dissipation can have a strong influence on the
turbulence level. This is because turbulence energy is the result
of
competition between
two large and almost equal sources
of
production and dissipation.
Beer, Chomiak and Smoot
(1984)
state that the change in turbulence intensity and
structure caused by the increased dissipation will affect the mean flow parameters and in
turn the turbulence production terms,
so
that the outcome
of
the chain
of
changes is
difficult to predict even when the most advanced techniques are used. The difficulties are
enhanced by a lack of reliable experimental data. For example, some experiments
demonstrate dramatic effects
of
even minute admixtures
of
particles on turbulent jet
behaviour. Others demonstrate smaller effects even for high dust concentrations. (See
Section
3.8
in Chapter
3.)
When
T~
s=-
T~,
where
4.4.2
TURBULENT DUST FLAMES. AN INTRODUCTORY OVERVIEW
The literature on turbulent dust flames and explosions is substantial. This is because it has
long been realized that turbulence plays a primary role in deciding the rate with which a
given dust cloud will burn, and because this role
is
not easy to evaluate either
experimentally or theoretically. There are close similarities with turbulent combustion
of
premixed gases, as shown by Bradley
et
a/.
(1
9881,
although the two-phase nature of dust
clouds
adds
to
the complexity of the problem. Hayes
et
a/.
(1983)
mentioned
two
predominant groups of theories of turbulent burning
of
a premixed fluid system
of
a fuel and
an oxidizer:
1.
The
laminar flame continues to be the basic element of flame propagation. The essential
role of turbulence
is
to increase the area of the flame surface that burns simultaneously.
2.
Turbulence alters the nature
of
the basic element of flame propagation
by
increasing
rates of heat and mass transport down to the scale of the ‘elementary flame front’, which
is
no
longer identical with the laminar flame.
In their comprehensive survey Andrews, Bradley and Lwakamba
(7
975)
emphasized the
importance of the turbulent Reynolds number
Rh
=
V’UV
for the turbulent flame propaga-
Propagation
of
flames
in
dust clouds
337
tion, where
v‘
is the turbulence intensity defined by equation (4.81),
A
the Taylor
microscale and
u
the kinematic viscosity. They suggested that for
R,
>
100,
a wrinkled
laminar flame structure is unlikely and that turbulent flame propagation is then associated
with small dissipative eddies. A supplementary formulation is that laminar flamelets can
only exist in a turbulent flow if the laminar flame thickness is smaller than the
Kolmogoroff microscale
of
the turbulence. Bray (1980) gave a comprehensive discussion
of
the two physical conceptions and pointed out that the Kolmogoroff micro-scales and
laminar flame thicknesses are difficult to resolve experimentally in a turbulent flame.
Because
of
the experimental difficulties, the real nature of the fine structure
of
premixed
flames in intense turbulence is still unknown.
Abdel-Gayed
et
al.
(1989) proposed a modified Borghi diagram for classifying various
combustion regimes in turbulent premixed flames, using the original Borghi parameters
L/6,
and
u
‘/uI
as abscissa and ordinate. Here
L
is the integral length scale,
6,
the thickness
of
the laminar flame,
uf
the
rms
turbulent velocity and
ul
the laminar burning velocity.
The diagram identifies regimes of flame propagation and quenching, and the correspond-
ing values
of
the Karlovitz stretch factor, the turbulent Reynolds number, and the ratio of
turbulent to laminar burning velocity.
Spalding (1982) discussed an overall model that contains elements of both
of
the
physical conceptions
1
and
2
of a turbulent flame defined above. An illustration is given in
Figure 4.38. Eddies
of
hot, burnt fluid and cold unburnt fluid interact with the
consequences that both fluids become mutually entrained.
Figure
4.38
unshaded unburnt (From Spalding,
1982)
Postulated micro-structure
oi
burning turbulent fluid. Shaded areas represent burnt iluid,
Entrainment
of
burnt fluid into unburnt and vice versa is the rate controlling factor as
long as the chemistry is fast enough to consume the hot reactants as they appear. In other
words: The instantaneous combustion rate per unit volume of mixture of burnt and
unburnt increases with the total instantaneous interface area between burnt and unburnt
per unit volume
of
the mixture. Spalding introduced the length
1
as a characteristic mean
dimension
of
the entrained ‘particles’
of
either burnt or unburnt fluid, and
I-’
as a measure
of
the corresponding specific interface surface area. He then assumed a differential
equation of the form:
338
Dust Explosions in the Process Industries
d(1-’)
dr
-M+B+A
(4.84)
where
M
represents the influence of mechanical processes such as stretching, breakage,
impact and coalescence.
B
represents the influence
of
the burning, whereas
A
represents
influences
of
other processes such as wrinkling, smoothing and simple interdiffusion.
Spalding indicated tentative equations for
M,
B
and
A,
but emphasized that the
identification of expressions and associated constants that correspond to physical reality
over wide ranges, ‘is a task for the future’.
It is nevertheless clear that the strong enhancing effect of turbulence on the combustion
rate
of
dust clouds and premixed gases, is primarily due to the increase of the specific
interface area between burnt and unburnt fluid by turbulence, induced by mutual
entrainment of the two phases. The circumstances under which the interface itself is a
laminar flame
or
some thinner, elementary flame front, remains to be clarified.
When discussing the specific influence of turbulence on particle combustion mechan-
isms, Beer, Chomiak and Smoot (1984) distinguished between micro-scale effects and
macro-scale effects. On the micro-scale, turbulence directly affects the heat and mass
transfer and therefore the particle combustion rate. They discussed the detailed implica-
tions
of
this for coal particle combustion, assuming that
CO
is the only primary product of
heterogeneous coal oxidation. On the macro-scale there is a competition between the
devolatilization process and turbulent mixing. Concerning modelling of turbulent com-
bustion
of
dust clouds, these authors stressed that three-dimensional microscopic models
are too detailed to allow computer simulation without use
of
excessive computer capacity
and computing time. They therefore suggested alternative methods based on theories like
the
k
-
E
model, adopting the Lagrangian Escimo approach proposed by Spalding and
co-workers (Ma
et
af.
1983),
or
alternative methods developed for accounting for the
primary coherent large-scale turbulence structures (Ghoniem
et
af.,
1981).
Lee (1987) suggested that the length scale that characterizes the reaction zone
of
a
turbulent dust flame is at least an order of magnitude greater than that of a premixed gas
flame. For this reason dust flame propagation should preferably be studied in large-scale
apparatus. It should be emphasized, however, that from a practical standpoint, large
or
full scale is not an unambiguous term.
For
example, a dust extraction duct of diameter
150
mm is full industrial scale, and at the same time of the scale of laboratory equipment.
On the other hand, the important features of an explosion in a large grain silo cell of
diameter 9 m and height 70 m are unlikely to be reproduced in a laboratory silo model
of
150 mm diameter.
It should be mentioned here that Abdel-Gayed
et
al.
(1987) identified generally
applicable correlations in terms of dimensionless groups, enabling prediction of accelera-
tion
of
flames in turbulent premixed gases.
A
similar approach might in some cases offer a
means of scaling even of dust explosions. The role
of
radiative heat transfer in dust flames
then needs to be discussed, as done by Lee (1987). His conclusion was that conductive and
convective heat transfer are probably more important than radiative transfer. This may be
valid for coal and organic dusts, but probably not for metal dusts like silicon and
aluminium.
Amyotte
et
af.
(1989) reviewed more than a hundred publications on various effects
of
turbulence on ignition and propagation
of
dust explosions. They considered the influence
of both initial and explosion induced turbulence on flame propagation in both vented and
Propagation of flames in
dust
clouds
339
fully confined explosions. They suggested two possible approaches towards an improved
understanding. First, concurrent investigations of dust and gas explosions, and secondly
direct measurement of turbulent scales and intensities in real experiments as well as in
industrial plants.
4.4.3
EXPERIMENTAL STUDIES
OF
TURBULENT DUST FLAMES
IN
CLOSED
VESSELS
4.4.3.1
Common features
of
experiments
The majority
of
the published experimental studies
of
turbulent dust explosions in closed
vessels have been conducted in apparatus
of
the type illustrated in Figure 4.39.
Figure
4.39
explosion experiments
Illustration
oi
the type
oi
apparatus commonly used in closed-vessel turbulent dust
The closed explosion vessel
of
volume
VI
and initial pressure
Pj
is equipped with a dust
dispersion system, a pressure sensor and an ignition source. In most equipment the dust
dispersion system consists
of
a compressed-air reservoir of volume
V2
-e
VI,
at an initial
pressure
P2 %PI.
In some apparatuses the dust is initially placed on the high-pressure side
of
the dispersion air valve, as indicated in Figure 4.39, whereas in other apparatus it is
placed downstream
of
the valve. Normally, the mass
of
dispersion air is not negligible
compared with the initial mass
of
air in the main vessel. This causes a significant rise
of
the
pressure in the main vessel once the dispersion air has been discharged into the main
vessel. In some investigations this is compensated for by partial evacuation
of
the main
vessel prior to dispersion
so
that the final pressure after dispersion completion, just prior
to ignition, is atmospheric. This is important if absolute data are required, because the
maximum explosion pressure for a given dust at a given concentration is approximately
proportional to the initial absolute air pressure. Both the absolute sizes
of
Vj
and
V2
and
the ratio between them vary substantially from apparatus to apparatus. The smallest
VI
used are
of
the order
of
1
litre, whereas the largest that has been traced is
250
m3. The
design
of
the dust dispersion system varies considerably from apparatus to apparatus.
A
340
Dust
Explosions in the Process Industries
number
of
different nozzle types have been developed with the aim to break up
agglomerates and ensure homogeneous distribution
of
the dust in the main vessel. The
ignition source has also been a factor
of
considerable variation. In some of the earlier
investigations, continuous sources like electric arcs or trains of electric sparks, and glowing
resistance wire coils were used, but more recently it has become common to use
short-duration sources initiated at a given time interval after opening of the dust
dispersion valve. These sources vary from electric sparks, via exploding wires to various
forms of electrically triggered chemical ignitors.
An important inherent feature
of
all apparatus
of
the type illustrated in Figure
4.39
is
that the dispersion
of
the dust inevitably induces turbulence in the main vessel. The level
of
turbulence will be at maximum during the main phase of dust dispersion. After the flow
of
dispersion air into the main vessel has terminated, the turbulence decays at a rate that
decreases with increasing
VI.
(Compare time scales of Figures
4.41
and
4.42.)
In view of this it is clear that both the strength of the dispersion air blast and the delay
between opening
of
the dust dispersion value and ignition have a strong influence on the
state
of
turbulence in the dust cloud at the moment
of
ignition, and consequently also on
the violence of the explosion. The situation is illustrated in Figure
4.40.
Figure
4.40 Illustration
of
generation and decay of turbulence during and after dispersion of dust in
an apparatus of the type illustrated in Figure
4.39.
Note:
A
common way
of
quantitifying turbulence
intensity
Is
the rms turbulent velocity
4.4.3.2
Experimental investigations
The data from Eckhoff
(1977)
given in Figure
4.41
illustate the influence of the ignition
delay on the explosion development in a cloud
of
lycopodium in air in a
1.2
litre Hartmann
bomb.
As
can be seen there is little difference between the maximum explosion pressure
obtained with a delay
of
40
ms and
of
200
ms, whereas the maximum rate
of
pressure rise
is drastically reduced, from
430
barb
to
50
bar/s, i.e. by a factor of almost ten. There is
little doubt that this is due to the reduced initial turbulence in the dust cloud at the large
Propagation of flames in dust clouds 34
1
ignition delays. With increasing ignition delay beyond
200
ms, the maximum explosion
pressure
is
also reduced as the dust starts to settle out of suspension before the ignition
source is activated.
Figure
4.41
Influence of ignition delay on development of lycopodium/air explosion in a 1.2 litre
Hartmann bomb. Ignition source 4
J
electric spark of discharge time 2-3 ms. Dust concentration
420 g/m3. Initial pressure in
60
cm3 dispersion air reservoir 8 bar@) (From Eckhofc 1977)
As
would be expected, the same kind of influence of ignition delay as shown in Figure
4.41 is in fact found in all experiments of the type illustrated in Figure 4.39. One of the first
researchers to observe this effect was Bartknecht (1971). Some
of
his results for a
1
m3
explosion vessel are given in Figure 4.42.
As
the ignition delay is increased from the lowest
value
of
about 0.3
s
to about
1
s,
there is marked decrease of
(dPldt),,,,
whereas
P,,,
is
comparatively independent of the ignition delay for both dusts. If the ignition delay is
increased further, however, there is a marked decrease even in
P,,,
for the coal. The
1
m3
apparatus used by Bartknecht in 1971 is in fact the prototype
of
the standard test
apparatus specified by the International Organization for Standardization (1985).
In this standard an ignition delay of 0.6 is prescribed.
As
Figure 4.42 shows, this is not
the worst case, because a significantly higher level
of
initial turbulence and resulting rates
of
pressure rise exist at shorter ignition delays, down to
0.3
s.
The delay of
0.6
s
was
chosen as a standard because at approximately this moment the dust dispersion was
completed, i.e. pressure equilibrium between VI and
V2
in Figure 4.39 was established. In
view of this there is no logical argument for claiming that an ignition delay
of
0.6
s
corresponds to ‘worst case’. One can easily envisage situations in industry where dust
injection into the explosion space is continued after ignition.
As
shown by Eckhoff (1976), the data from experiments of Nagy
et
al.
(1971) in
closed-bombs of various volumes confirm the arbitrary nature of
(dPldt),,,
values from
closed-bomb tests. This was re-emphasized by Moore (1979), who conducted further
comparative tests in vessels of different volumes and shapes.
Dahn (1991) studied the influence
of
the speed
of
a stirring propeller on the rate
of
pressure rise, or the derived burning velocity, during lycopodiudair explosions in a
20
litre closed vessel. The purpose
of
the propeller was to induce turbulence in addition to
342
Dust Explosions in the
Process
Industries
Figure
4.42
Ignition source: chemical ignitor
at
vessel centre (Data from Bartknecht,
1971)
that generated by the dust dispersion air blast.
(dPldt),,,
typically increased by a factor
of
2-2.5
when the propeller speed increased from zero to 10
O00
rpm.
The implication
of
the effects illustrated by Figures
4.40-4.42
for predicting explosion
violence in practical situations in industry was neglected for some time. The strong
influence of turbulence on the rate
of
combustion of a dust cloud is also indeed
of
significance in practical explosion situations in industry (see Chapter
6).
In the past sufficient attention was not always paid to the influence of the ignition delay
on the violence
of
experimental closed-bomb dust explosions. Often continuous ignition
sources, like flowing resistance wire coils, were used, as opposed to short-duration sources
being active only for a comparatively short interval
of
time, allowing control
of
the
moment
of
ignition. Some consequences of using a continuous ignition source were
investigated by Eckhoff and Mathisen (1977/78). They disclosed that a correlation
between
(dPldr),,,
and dust moisture content found by Eckhoff (1976) on the basis
of
Hartmann bomb tests, using a glowing resistance wire coil ignition source, was misleading.
The reason is that a dust of a higher moisture content ignites with a longer delay than a
comparatively dry dust. This is because the ignitability
of
a moist dust is lower than for a
dried dust. Therefore ignition
of
the moist dust with a continuous source is not possible
until the turbulence has decayed to a sufficiently low level, below the critical level for
Results from explosions of aluminium/air and coal dusuair
in
a
closed
1
m’ vessel.
Propagation
of
flames in dust clouds
343
ignition
of
the dried dust. In other words: As the moisture content in the dust increases,
the ignition delay also increases. Therefore the strong influence of moisture content on
(dPldt),,,
found earlier, was in fact a combined effect of increasing dust moisture and
decreasing turbulence.
Eckhoff
(1987)
has discussed a number
of
the closed-bomb test apparatuses used for
characterizing the explosion violence of dust clouds in terms of the maximum rate
of
pressure rise. It is clear that the
(dPldt),,
from such tests are bound to be arbitrary as
long as the test result is not associated with a defined state of initial turbulence of the dust
cloud. In view of this the direct measurements
of
the rms (root mean square) turbulence as
a function
of
time after opening the dispersion air valve in a Hartmann bomb, by Amyotte
and Pegg
(1989),
and their comparison
of
the data with the data from Hartmann bomb
explosion experiments by themselves and Eckhoff
(1977),
are
of
considerable interest.
The results
of
Amyotte and Pegg’s Laser-Doppler velocimeter measurements, obtained
without dust in the dispersion system, are shown in Figure
4.43.
It is seen that a decay by a
factor
of
almost ten
of
the turbulence intensity occurs within the same time frame
of
about
40
to
200
ms as a corresponding decay
of
(dPldt),,
in Eckhoffs
(1977)
experiments
(Figure
4.41).
It is also seen that the turbulence intensity increases systematically with the
initial pressure in the dispersing air reservoir, i.e. increasing strength of the air blast, in
accordance with the general picture indicated in Figure
4.40.
Figure
4.43
Variation oirms turbulence velocities within
5
ms
’windows’ in a Hartmann bomb with
time after opening
of
air blast valve, and with initial pressure in dispersion reservoir. Air only, no dust
(From Arnyotte and Pegg,
1989)
Kauffman
et
al.
(1984)
studied the development
of
turbulent dust explosions in the
0.95
m3 spherical explosion bomb illustrated schematically in Figure
4.44.
The bomb is
equipped with six inlet ports and eight exhaust ports, both sets being manifolded and
arranged symmetrically around the bomb shell. Dust and air feed rates were set to give the
desired dust concentration and turbulence level. The turbulence level generated by a given
air flow was measured
by
means
of
a hot-wire anemometer. The turbulence intensity
v’,
344
Dust
Explosions in the Process industries
assuming isotropic turbulence, was determined from the rms (root mean square) and
mean velocities extracted from the hot-wire signal in the absence
of
dust.
As
pointed out
by Semenov
(1965), a hot-wire probe senses all velocities as positive, and therefore a
positive mean velocity will be recorded even if the true mean velocity is zero. In
agreement with the suggestion by Semenov, Kauffman
et
al.
therefore assumed that
VI
=
(1/2)”2
x
[(rms velocity)2
+
(mean ~elocity)~]’”. This essentially is a secondary rms
of
two different mean velocities, namely the primary rms and the arithmetic mean
of
the
hot wire signal.
Figure
4.44
0.95
in’ spherical closed bomb for studying combustion of turbulent dust clouds (From
Kauffman et
ai.,
1984)
Kauffman
et
al.
were aware
of
the complicating influence
of
dust particles on the
turbulence structure
of
the air, but they were not able to account for this. It was found that
the turbulence intensity, in the absence of dust, was reasonably uniform throughout the
1
m3
vessel volume.
When a steady-state dust suspension
of
known concentration had been generated in the
0.95 m3 sphere, all inlet and exhaust openings were closed simultaneously and the dust
cloud ignited at the centre. The rise of explosion pressure with time was recorded and
(dPldt),,,
and P,,, determined. Figures 4.45 and 4.46 show a set of results for maize
starch.
The marked increase
of
(dPldt),,
with turbulence intensity
VI
in Figure 4.45 was
expected and in agreement with the trend in Figures
4.41-4.43. However, as shown in
Figure
4.46,
VI
also had a distinct influence on
P,,.
At the first glance this conflicts with
the findings
of
Eckhoff (1977) and Amyotte and Pegg (1989) in the 1.2 litre Hartmann
bomb, where there was little influence
of
the ignition delay on
P,,,
up to
200
ms delay.
However, Eckhoff
(1976) discussed the effect
of
initial dispersion air pressure on the
development of explosion pressure in the Hartmann bomb. He found a comparatively
steep rise of both
P,,,
and
(dPldt),,
with increasing dispersion pressure, and suggested
that this was probably due to a combined effect of improved dust dispersion and increased
Propagation
of
flames in dust clouds
345
Figure
4.45
closed bomb (From Kauffman
et
al.,
1984)
Effect of turbulence on maximum rate of rise of explosion pressure in
a
0.95
m
’
spherical
Figure
4.46
(From Kauffman
et
al.,
1984)
Effect of turbulence on maximum explosion pressure in
a
0.95
m3
spherical closed bomb
initial turbulence.
A
similar distinct influence on
P,,,
of the intensity of the air blast used
for dispersing the dust was also found by Amyotte and Pegg
(1989).
This could be
interpreted in terms of improved degree of dust dispersion or deagglomeration, rather
than degree of turbulence, being responsible for more effective combustion and thus
higher
P,,,.
Therefore, the primary effect on
P,,,
of increasing
1.”
in Kauffman
et
al.’s
(1984)
experiments could be improved degree of dust dispersion.
The rms turbulence intensities in Amyotte and Pegg’s
(1989)
investigation were
determined by means of a Laser-Doppler velocimeter, whereas Kauffman
et
al.
(1984)
used a hot-wire anemometer. Therefore the two sets of
v’
values may not be directly