Dust Explosions in the Process Industries Second Edition phần 7 potx
Bạn đang xem bản rút gọn của tài liệu. Xem và tải ngay bản đầy đủ của tài liệu tại đây (3.8 MB, 66 trang )
Propagation
of
flames
in
dust clouds
387
Industrial and Engineering Chemistry.
Process Design and Developm.
6
pp. 74-84
International Standardization Organization (1985) Explosion Protection Systems. Part
I:
Determi-
nation
of
Explosion Indices
of
Combustible Dusts in Air.
IS0
618411,
ISO,
Geneva
Ishihama, W. (1961) Studies on the Critical Explosion Density
of
Coal Dust Clouds.
Proc.
of
Ilth
Internat. Conf. of Directors
of
Safety in Mines Research,
(Oct.) Warsaw
Ishihama, W., Enomoto,
H.,
and Sekimoto,
Y.
(1982) Upper Explosion Limits of Coal Dust/
Methane/Air Mixtures.
Journal of the Association of the Japanese Mining Industry
(in Japanese)
pp. 13-17
Ishii,
R.
(1983) Shock Waves in Gas-Particle Mixtures.
Faculty
of
Engineering Memoirs
45
Kyoto
University pp. 1-16.
Jacobson, M., Cooper, A. R., and Nagy, J. (1964) Explosibility of Metal Powders. Rep. Inv. 6516,
US Bureau
of
Mines, Washington
Jaeckel, G. (1924) Die Staubexplosionen.
Zeitschrift fiir technische Physik
pp. 67-78
Jarosinski, J. (1984) The Thickness
of
Laminar Flames.
Combustion and Flame
56
pp. 337-342
Jarosinski, J., Lee, J.
H.
S.,
Knystautas, R.,
et ai.
(1987) Quenching Distance
of
Self-propagating
Dust/Air Flames.
Archivum Combustionis
7
pp. 267-278
Johnson, G. R., Murdoch, P., and Williams, A. (1988)
A
Study
of
the Mechanism of the Rapid
Pyrolysis of Single Particles
of
Coal.
Fuel
67
pp. 834-842
Jones, W. P., and Launder, B. E. (1972) The Prediction of Laminarization with a Two-Equation
Model of Turbulence.
Int.
J.
Heat Mass Transfer
15
pp. 301-314
Jones, W. P., and Launder, B. E. (1972) The Calculation of Low-Reynolds-Number Phenomena
with a Two-Equation Model of Turbulence.
Int.
J.
Heat Mass Transfer
16
pp. 11191130
Jouguet, M. (1905) Sur la propagation des reactions chimiques dans les gaz. Chapitre
I
et
11.
Journal
de Mathematiques pura et appliqutes
1
Series 61, pp. 347-425
Jouguet,
M.
(1906) Sur la propagation des reactions chimiques dans les gaz. Chapitre
111.
Journal de
Mathematiques pures et appliquees
2
Series 61, pp. 5-86
Kaesche-Krischer, B., and Zehr, J. (1958) Untersuchungen an StaublLuft-Flammen.
Zeitschrift fiir
Physikalische Chemie Neue Folge
14
5/6
Kaesche-Krischer, B. (1959) Untersuchungen an vorgemischten, laminar Staubkuft-Flammen.
Staub
19
pp. 200-203
Kauffman, C. W., Ural,
E.,
Nichols, J. A.
et al.
(1982) Detonation Waves in Confined Dust
Clouds.
Proc. of 3rd Internat. School of Explosibility
of
Dusts,
(5-7 Nov.), Turawa, Poland
Kauffman, C. W., Srinath,
S.
R., Tezok,
F.
I.,
et al.
(1984) Turbulent and Accelerating Dust
Flames.
Proc. of 20th Symp. (Internat.) Combustion.
The Combustion Institute pp. 1701-1708
Kauffman, C. W., Wolanski, P., Arisoy,
A.,
et al.
(1984a) Dust, Hybrid and Dusty Detonations.
Progress in Astronautics and Aeronautics
94
pp. 221-240
Kawakami, T., Okajima,
S.,
and Tinuma, K. (1988) Measurement of slow burning velocity by
zero-gravity method.
Proc. 22nd Symp. (Int.)
on
Combustion,
The Comb. Inst. pp. 16091613
Khaikin,
B.
I.,
Bloshenko,
V.
N., and Merzhanov,
A.
G. (1970)
Fizika Goreniya
i
Vzryva
5
No. 4
Kjaldman, L. (1987) Numerical Simulation of Peat Dust Explosions. Research Report No. 469,
Technical Research Centre
of
Finland, Espoo
Kjaldman,
L.
(1989) Modelling
of
peat dust combustion.
Proc.
of
3rd Internat. PHOENICS User
Conference.
(Aug./Sept
.)
Dubrovnik
Klemens,
R.,
and Wolanski,
P.
(1986) Flame Structure in Dust/Air and Hybrid/Air Mixtures near
Lean Flammability Limits.
Progr. Astronautics and Aeronautics
105
pp. 169-183
Klemens, R., Kotelecki, M., Malanovski, P.,
et al.
(1988) An Investigation
of
the Mechanism
of
Turbulent Dust Combustion. Private communication to Eckhoff
Kong Dehong (1986) Study
of
Flame Propagation in a Laminar Dust Cloud. M. Eng. Thesis. Dept.
of Metallurgical and Physical Chemistry, Northeast University of Technology, Shenyang,
P. R. China
Krazinski, J.
L.,
Backius,
R.
O.,
and Krier, H. (1977) Modelling Coal-Dust/Air Flames with
388
Dust Explosions in the Process Industries
Radiative Tansport.
Proc. Spring Meeting Central States Section.
(March) The Combustion
Institute, Cleveland, Ohio
Krazinski, J. L., Backius, R.
O.,
and Krier, H. (1978) A Model
for
Flame Propagation in Low
Volatile Coal-Dust/Air Mixtures.
J.
Heat Transfer
100
pp. 105-111
Kuchta, J. M. (1985)
Investigation of Fire and Explosion Accidents in the Chemical, Mining and
Fuel-Related Industries
-
A Manual.
Bulletin 680, US Bureau of Mines, Washington
Kulikovskii, V. A. (1987) Existence of convergent Chapman-Jouguet Detonation Waves in
Dust-Laden Gas.
Fizika Goreniya
i
Vzryva
23
pp. 3541 (Translated by Plenum Publishing
Corporation)
Launder,
B.
E., and Spalding, D. B. (1972)
Mathematical Models of Turbulence.
Academic Press
Lee,
J.
H.
S.
(1987) Dust Explosions: An Overview.
Proc. Internat. Symp. Shock Tubes and Waves,
Lee, J. H.
S.,
Yi Kang Pu, and Knystautas,
R.
(1987) Influence
of
Turbulence in Closed Volume
Lee, J. H.
S.
(1988) Dust Explosion Parameters, their Measurement and Use.
VDZ-Berichte
701
Leuschke, G. (1965) Beitrage zur Erforschung des Mechanismus der Flammenausbreitung in
Staubwolken.
Staub
25
pp. 180-186
Levendis,
Y.
A., Flagan, R. C., and Gavals, G. R. (1989) Oxidation Kinetics
of
Monodisperse
Spherical Carbonaceous Particles
of
Variable Properties.
Combustion and Flame
76
pp. 221-241
Lewis,
B.,
and von Elbe, G. (1961)
Combustion, Flames and Explosion of Gases.
2nd Ed.,
Academic Press
Liebman, I., Cony, J., and Perlee, H.
E.
(1972) Ignition and Incendivity
of
Laser Irradiated Single
Micron-Size Magnesium Particles.
Combustion Science and Technology
5
pp. 21-30
Lindstedt, R. P., and Michels, H. J. (1989) Deflagration to Detonation Transitions and Strong
Deflagrations in Alkane and AlkaneIAir Mixtures.
Combustion and Flame
76
pp. 169-181
Ma, A.
S.
C., Spalding, D. B., and Sun, L. T. (1982) Application
of
‘Escimo’ to Turbulent
HydrogedAir Diffusion flame.
Proc.
of
19th Symp. (Internat.)
on
Combustion.
The Combustion
Institute pp. 393402
Magnussen, B. F., and Hjertager, B. H. (1976) On Mathematical Modelling
of
Turbulent Com-
bustion with Special Emphasis on Soot Formation and Combustion.
Proc. of 16th Symp.
(Internat.)
on
Combustion.
The Combustion Institute, Pittsburgh pp. 719-729
Mallard, E., and le Chatelier, H.
L.
(1883) Recherches Experimentales et Theoretiques sur la
Combustion des MClanges Gazeux Explosifs.
Annales des Mines
4
p. 379
Malte, P. C., and Dorri,
B.
(1981) The Behaviour
of
Fuel Particles in Wood-Waste Furnaces.
Proc.
of
Spring Meeting, Western States Section,
(April), Combustion Institute, Washington State
University
Mason,
W.
E.,
and Wilson, M. J. G. (1967) Laminar Flames
of
Lycopodium Dust in Air.
Combustion and Flame
11
pp. 195-200
Matalon, M. (1982) The Steady Burning
of
a Solid Particle.
SIAM
J.
Appl. Math.
42
pp. 787-803
Mitsui, R., and Tanaka,
T.
(1973) Simple Models
of
Dust Explosion. Predicting Ignition
Temperature and Minimum Explosive Limit in Terms
of
Particle Size.
Ind. Eng. Chem. Process
Des. Develop.
12
pp. 384-389
Moen, I., Lee, J. H.
S.,
and Hjertager, B. H. (1982) Pressure Development due to Turbulent
Flame Propagation in Large-Scale MethaneIAir Explosions.
Combustion and Flame
47
pp. 31-52
Moore, P. E. (1979) Characterization
of
Dust Explosibility: Comparative Study of Test Methods.
Chemistry and Industry
7
p. 430
Nagy, J., Seiler, E. C., Conn, J. W.,
et al.
(1971) Explosion Development in Closed Vessels. Rep.
Inv. No. 7507,
US
Bureau
of
Mines, Washington
Nagy, J., Conn,
J.
W., and Verakis, H. C. (1969) Explosion Development in a Spherical Vessel.
Rep. Inv. 7279, US Bureau of Mines, US Dept. Interior, Washington
Aachen, F. R. Germany, 16: pp. 21-38
Explosion
of
Dust/Air Mixtures.
Archivum Combustionis
7
pp. 279-297
pp. 113-122
Propagation of flames in
dust
clouds
389
Nagy, J., and Verakis, H. C. (1983)
Development and Control
of
Dust Explosions.
Marcel Dekker,
Nelson, L.
S.,
and Richardson, N. L. (1964) The Use
of
Flash Heating to Study the Combustion
of
Nelson,
L.
S.
(1965) Combustion
of
Zirconium Droplets Ignited by Flash Heating.
Pyrodynamics
3
Nettleton, M. A. (1987)
Gaseous Detonations: Their Nature, Effects and Control,
Chapman and
Hall, London
Neumann, J. von (1942) Progress Report on the Theory
of
Detonation Waves. Report No. 549,
OSRD
Nomura,
S I.,
and Tanaka,
T.
(1978) Theoretical Discussion
of
the Flame Propagation Velocity
of
a Dust Explosion. The Case
of
Uniform Dispersion
of
Monosized Particles. Heat Transfer.
Japanese Research
7
pp. 79-86
Nomura,
S I.,
and Tanaka,
T.
(1980) Prediction
of
Maximum Rate
of
Pressure Rise due to Dust
Explosion in Closed Spherical and Non-Spherical Vessels.
Ind. Eng. Chem. Process Des. Dev.
19
pp. 451459
Nomura,
S I.,
Torimoto, M., and Tanaka,
T.
(1984) Theoretical Upper Limit
of
Dust Explosions in
Relation to Oxygen Concentration.
Ind. Eng. Chem. Process Des. Dev.
23
pp. 42W23
Nordtest (1989) Dust Clouds: Minimum Explosible Dust Concentration.
NT
Fire
011,
Nordtest,
Helsinki
Nusselt
,
W. (1924) Der Verbrennungsvorgang in der Kohlenstaubfeuerung.
Zeitschrift Ver.
Deutscher Ingenieure
68
pp. 124-128
Ogle, R. A., Beddow,
J.
K., and Vetter, A.
F.
(1983) Numerical Modelling
of
Dust Explosions:
The Influence
of
Particle Shape on Explosion Intensity. Powder and Bulk Solids Handling and
Processing, Technol. Progr., Internat. Powder Science Institute
Ogle, R. A., Beddow, J.
K.,
Vetter, A. F. (1984) A Thermal Theory
of
Laminar Premixed Dust
Flame Propagation.
Combustion and Flame
58
pp. 77-79
Ogle, R. A., Beddow,
J.
K., Chen, L. D. (1988) An Investigation
of
Aluminium Dust Explosions.
Combustion Science and Technology
61
pp. 75-99
Palmer,
K.
N., and Tonkin, P.
S.
(1971) Coal Dust Explosions in a Large-Scale Vertical Tube
Apparatus.
Combustion and Flame
17
pp. 159-170
Pineau,
J.
P., and Ronchail, G. (1982) Propagation
of
Dust Explosions in Ducts.
Proc.
of
International Symposium: The Control and Prevention
of
Dust Explosions,
(November) Orga-
nized by Oyes/IBC, Bade
Pineau,
J.
P. (1987) Dust Explosions in Pipes, Ducts and Galleries. A State-of-the-Art Report with
Criteria for Industrial Design.
Proceedings
of
Shenyang International Symposium
on
Dust
Explosions,
Sept. 14-16, NEUT, Shenyang, P. R. China
Prentice,
J.
L.
(1970) Combustion
of
Pulse-Heated Single Particles
of
Aluminium and Beryllium
Cornbustion Science and Technology
1
pp. 385-398
Proust, C., and Veyssiere,
B.
(1988) Fundamental Properties
of
Flames Propagating in Starch
DustlAir Mixtures.
Combustion Science and Technology
62
pp. 149-172
Radandt,
S.
(1989) Explosionsablaufe in Abhangigkeit von Betriebsparametern.
VDZ-Berichte
701,
Volume 2. VDI-Verlag, Dusseldorf pp. 801-817
Rae, D. (1971) Coal Dust Explosions in Large Tubes.
Proc.
of
8th International Shock Tube
Symposium,
(July), London
Razdobreev, A. A., Skorik, A.
I.,
and Frolov, Yu.V. (1976) Ignition and Combustion Mechanism
of
Aluminium Particles.
Fizika Goreniya i Vzryva
12
No.
2 pp. 203-208 (Translated by Plenum
Publishing Corporation)
Richmond, J. K., and Liebman, I. (1975) A Physical Description
of
Coal Mine Explosions.
Proc.
of
15th Symp. (Internat.)
on
Combustion.
The Combustion Institute, Pittsburgh, USA pp. 115-126
Richmond,
J.
K.,
Liebman,
I.,
Bruszak, A. E.,
et al.
(1978) A Physical Description
of
Coal Mine
Inc.
Liquid Metal Droplets.
The Journal
of
Physical Chemistry
68
No. 5 pp. 1269-1270
pp. 121-134
390
Dust
Explosions in
the
Process
Industries
Explosions. Part
11.
Proc.
of
17th Symp. (Internat.)
on
Combustion.
The Combustion Institute,
Pittsburgh, USA pp. 1257-1268
Samsonov, V. P. (1984) Flame Propagation in an Impulsive Acceleration Field.
Fizika Goreniya
i
Vzryva
20
No. 6 pp. 58-61 (Translated by Plenum Publishing Corporation)
Schlapfer, P. (1951) Ueber Staubflammen und Staubexplosionen.
Schweiz. Verein von
Gas-
und
Wasserfachmannern Monatsbulletin
No. 3,
31
pp. 69-82
Scholl, E. W. (1981) Brenn- und Explosionsverhalten von Kohlenstaub.
Zement-Kalk-Gips
No.
5
Schuber, G. (1988)
Zunddurchschlagverhalten
von Staub-Luft-Gemischen und Hybriden-
Gemischen. Publication Series:
Humanisierung des Arbeitslebens,
Vol.
72
VDI-Verlag,
Dusseldorf
Schuber, G. (1989) Ignition Breakthrough Behaviour of Dust/Air and Hybrid Mixtures through
Narrow Gaps.
Proc. of 6th Internat. Symp.
Loss
Prev. Safety Prom. Proc. Ind.,
Oslo
Schonewald,
I.
(1971) Vereinfachte Methode zur Berechnung der unteren Zundgrenze von
StaubLuft-Gemischen.
Staub-Reinhalt.
Luft
31
pp. 376-378
Selle, H., and Zehr, J. (1957)
Experimentaluntersuchungen
von
Staubverbrannungsvorgangen
und
ihre Betrachtung von reaktionsdynamischen Standpunkt.
VDZ-Berichte
19
pp. 73-87
Semenov,
E.
S.
(1965) Measurement
of
Turbulence Characteristics in a Closed Volume with
Artificial Turbulence.
Combustion, Explosion and Shock Waves
1
No. 2 pp. 57-62
Semenov, N. N. (1951) Tech. Memo. No. 1282, NACA
Shevchuk, V. G., Kondrat’ev, E. N., Zolotko, A. N.,
et al.
(1979) Effect
of
the Structure
of
a Gas
Suspension
on
the Process of Flame Propagation.
Fizika Goreniya
i
Vzryva
15
No. 6 pp. 4145
(Translated by Plenum Publishing Corporation)
Shevchuk, V. G., Bezrodnykh, A.
K.,
Kondrat’ev,
E.
N.,
et al.
(1986) Combustion of Airborne
Aluminium Particles in Free Space.
Fizika Goreniya
i
Vzryva
22
No.
5 pp. 40-43 (Translated by
Plenum Publishing Corporation)
Siwek, R. (1977) 20 Liter Laborapparatur fur die Bestimmung der Explosionskennzahlen brenn-
barer Staube. MSc. Thesis, Winterthur Engineering College, Wintherthur
Slezak,
S.
E.,
Buckius, R.
O.,
and Krier, H. (1986) Evidence of the Rich Flammability Limit for
Pulverized Pittsburgh Seam CoaYAir Mixtures.
Combustion and Flame
63
pp. 209-215
Smith, I. W. (1971) Kinetics
of
Combustion
of
Size-Graded Pulverized Fuels in the Temperature
Range 1200-2270 K.
Combustion and Flame
17
pp.
303-4
Smoot, L. D., and Horton, M. D. (1977) Propagation of Laminar Coal-Air Flames.
Progr. Energy
Combust. Sci.
3
pp. 235-258
Smoot, L. D., Horton, M.
D.,
and Williams, G. A. (1977) Propagation
of
Laminar Pulverized
Coal-Air Flames.
Proc.
of
16th Symp. (Internat.)
on
Combustion.
The Combustion Institute,
pp. 375-387
Spalding, D. B. (1957) Predicting the Laminar Flame Speed in Gases with Temperature-explicit
Reaction Rates.
Combustion and Flame
1
pp. 287-295
Spalding, D.
B.,
Stephenson, P. L., and Taylor, R.
G.
(1971)
A
Calculation Procedure for the
Prediction
of
Laminar Flame Speeds.
Combustion and Flame
17
p.
55
Spalding, D. B. (1982) Representations of Combustion in Computer Models of Spark Ignition.
Report CFD/82/18, Computational Fluid Dynamic Unit, Imperial College
of
Science and
Technology, London
Specht,
E.,
and Jeschar, R. (1987) Ermittlung der
geschwindigkeitsbestimmenden
Mechanismen bei
der Verbrennung von dichten Kohleteilchen.
VDZ-Berichte
645
pp. 45-56
Srinath,
R.
S.,
Kauffman, C. W., Nicholls,
J.
A.,
et
al.
Flame Propagation due to Layered
Combustible Dusts.
Proc.
of
10th International Colloquium
on
Dynamics
of
Explosions and
Reactive Systems,
(August), Berkeley, USA
Taffanel,
M.
J. (1907) Premiers Essais sur 1’InflammabilitC des Poussieres, Rapport publique par la
ComitC Central des Houill2res de France, Aout
Tai, C.
S.,
Kauffman, C. W., Sichel, M.,
et al.
(1988) Turbulent Dust Combustion in a Jet-Stirred
pp. 227-233
Propagation
of
flames in dust clouds
39
1
Reactor.
Progress in Astronautics and Aeronautics,
113
pp. 62-86
Tamanini,
F.
(1983) Dust Explosion Propagation in Simulated Grain Conveyor Galleries, Technical
Report FMRC J.I. OFIW.RK, (July), Prepared for National Grain and Feed Association,
Washington DC
Tamanini,
F.
(1989) Turbulence Effects on Dust Explosion Venting.
Proc.
of
AZChF
LOSS
Prevention Symposium,
(April 24), Session
8,
Plant Layout, Houston
Tamanini, F., and Chaffee, J.
L.
(1989) Large-Scale Vented Dust Explosions
-
Effect
of
Turbu-
lence on Explosion Severity. Technical Report FMRC J.I. OQ2E2.RK, (April), Factory Mutual
Research
Tanford, C., and Pease, R. N. (1947) Theory
of
Burning Velocity. 11. The Square Root Law for
Burning Velocity.
J.
Chemical Physics
15
pp. 861-865
Tulis, A. J., and Selman, J. R. (1984) Unconfined Aluminium Particle Two-Phase Detonation in
Air.
Progress in Astronautics and Aeronautics
94
pp. 277-292
Tulis, A. J. (1984) Initiation and Propagation
of
Detonation in Unconfined Clouds
of
Aluminium
Powder in Air.
Proc.
of
9th Int. Semin. Pyrotechnics
Ubhayakar,
S.
K., and Williams,
F.
A. (1976) Burning and Extinction of a Laser-Ignited Carbon
Particle in Quiescent Mixtures
of
Oxygen and Nitrogen.
Journ. Electrochem. Society
123
Vareide, D., and Sonju,
0.
K. (1987) Theoretical Predictions of Char Burn-Off. Report No. STF15
A87044
SINTEF, Trondheim, Norway
Wagner, R., Schulte, A., Miihlen, H J.,
et al.
(1987)
Laboratoriumsuntersuchungen
zum Zunden
und Abbrandgeschwindigkeit bei der Verbrennung einzelner Kohlekorner.
VDZ-Berichte
645
Weber, R.
0.
(1989) Thermal Theory for Determining the Burning Velocity of a Laminar Flame,
Using the Inflection Point in the Temperature Profile.
Combust. Sci. and Tech.
64
pp. 135-139
Weckman, H. (1986) Safe Production and Use of Domestic Fuels. Part 4. Fire and Explosion
Properties of Peat. Research Report No.
448.
Technical Research Centre
of
Finland, Espoo
Wolanski, P. (1977) Numerical Analysis of the Coal Dust/Air Mixtures Combustion.
Archivum
Termodynamiki
i
Spalania
8
pp. 451458
Wolanski, P., Lee, D., Sichel, M.,
et al.
(1984) The Structure
of
Dust Detonations.
Progress in
Astronautics and Aeronautics
94
pp. 242-263
Wolanski, P. (1987) Detonation in Dust Mixtures,
Proc. Shenyang Internat. Symp. Dust Expl.
NEUT, Shenyang, P. R. China, pp. 568-598
Wolanski, P. (1988) Oral Statement made at
3rd Internat.
Coll.
on
Dust Explosions,
(Oct. 24-28)
Szczyrk, Poland
Yi Kang Pu: (1988) Fundamental Characteristics
of
Laminar and Turbulent Flames in Cornstarch
Dust/Air Mixtures. (January), Ph.D. Thesis, Dept. Mech. Eng., McGill University
Yi Kang Pu, Mazurkiewicz, J., Jarosinski, J.
et al.
(1988) Comparative Study of the Influence of
Obstacles on the Propagation
of
Dust and Gas Flames.
Proc. 22nd Symp. (Znt.)
on
Combustion
The Combustion Institute pp. 1789-1797 Pittsburgh, USA
Zabetakis, M. G. (1965)
Flammability Characteristics
of
Combustible Gases and Vapors.
Bulletin
627, US Bureau
of
Mines, Washington
Zehr,
J.
(1957) Anleitung zu den Berechnungen uber die Ziindgrenzwerte und die maximalen
Explosionsdriicke.
VDI-Berichte
19
pp. 63-68
Zehr,
J.
(1959) Die Experimentelle Bestimmung der oberen Ziindgrenze von StaubLuft-
Gemischen als Beitrag zur Beurteilung der
Staubexplosionsgefahren.
Staub
19
pp. 204-214
Zeldovich, Ya.B. (1940) On the Theory
of
the Propagation
of
Detonation in Gaseous Systems.
J.
Exp. Theor. Phys.
USSR
10
p. 524. (Translation: NACA Tech. Memo No. 1261, (1950) pp.
1-50)
Zeldovich, Ya.B., Istratov, A. G., Kidin, N.
I.,
et al.
(1980) Flame Propagation in Tubes:
Hydrodynamics and Stability.
Combustion Science and Technology
24
pp. 1-13
pp. 747-756
pp. 33-43
Chapter
5
Ignition of
dust
clouds
and
dust
deposits:
further
consideration of some selected
aspects
5.1
WHAT
IS
IGNITION?
The word ‘ignition’ is only meaningful when applied to substances that are able to
propagate a self-sustained combustion or exothermal decomposition wave. Ignition may
then be defined as the process by which such propagation is initiated.
Ignition occurs when the heat generation rate in some volume
of
the substance exceeds
the rate
of
heat dissipation from the volume and continues to do
so
as the temperature
rises further. Eventually a temperature is reached at which diffusion of reactants controls
the rate
of
heat generation, and a characteristic stable state of combustion or decomposi-
tion is established.
The characteristic dimension
of
the volume within which ignitionho ignition is decided,
is of the order of the thickness of the front of a self-sustained flame though the mixture.
This is because self-sustained flame propagation can be regarded as a continuing ignition
wave exposing progressively new parts of the cloud to conditions where the heat
generation rate exceeds the rate of heat dissipation. A similar line of thought applies to
propagation
of
smouldering fires in powder deposits and layers, as discussed in Section
5.2.2.4.
In the ignition process the concepts of stability and instability play a key role. Thorne
(1985)
gave an instructive simplified outline of some basic features
of
the instability theory
of
ignition, which will be rendered in the following. In most situations diffusion, molecular
as well as convective, plays a decisive role in the ignition process. Systems that can ignite,
may be characterized by a dimensionless number
D,,
the Damkohler number, which is the
ratio of the rate
of
heat production within the system due to exothermic chemical
reactions, to the rate of heat
loss
from the system by conduction, convection and
radiation. Often
D,
is expressed as the ratio
of
two characteristic time constants, one for
the heat
loss
and one for the heat generation:
D,
=
TLITG
(5.1)
The influence of temperature on the rate of chemical reactions is normally described by
the exponential Arrhenius law:
k
=
fexp(-
EIRT)
(5.2)
where
k
is the rate constant,
f
the pre-exponential factor or frequency factor,
E
the
activation energy,
R
the gas constant and
T
the absolute temperature.
Ignition
of
dust clouds and dust deposits
393
In general the chemical rate
of
a combustion reaction may be written:
Rc
=
kCf C%R
(5.3)
where
p
+
q
=
m
is the order of the reaction, and
Cf
and
COR
the concentration of fuel
and oxygen in the reaction zone. In the case where the fuel is non-depleting and
q
=
1,
one gets:
Rc
=
kCoR
(5.4)
RD
=
D(C0S
-
COR)
(5.5)
The rate
of
diffusion of oxygen from the surroundings into the reaction zone is:
where
D
is the thermal diffusion rate constant and
Cos
the oxygen concentration in the
surroundings.
As
the temperature in the reaction zone increases, the thermal reaction rate increases
according to Equations
(5.2)
and
(5.4),
and a point is reached where the rate is ccntrolled
by the diffusional supply
of
oxygen to the reaction zone. Then
Rc
=
RD
and the
right-hand sides of Equations
(5.4)
and
(5.5)
are equal.
kCOR
=
D(cOS
-
COR)
=
p
(5-6)
p
=
kD/(k
+
0)
(5.7)
where
is called the Frank-Kamenetskii's overall rate constant, and
k
is as defined in Equation
(5.2).
By introducing the heat of reaction Q, the rate of heat generation can, according to
Equation
(5.6),
be expressed as:
RG
=
Q
X
cos
X
(5.8)
By inserting Equation
(5.2)
into
(5.7)
and substituting for
p
in
(5.8),
one gets:
The general expression for the heat loss from the system considered is:
RL
=
U(T
-
To)",
n
2
1
(5.10)
where
U
and
n
are characteristic constants for the system,
T
the temperature in the
reaction zone and
TO
the ambient temperature.
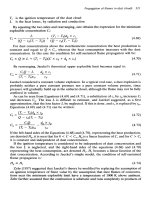
Figure
5.1
illustrates the stability/instability conditions in a system that behaves
according to Equations
(5.9)
and
(5.10).
Figure
5.1
reveals three intersections between the
S-shaped
RG
curve and the heat loss curve
RL.
In the figure,
RL
is a straight line,
corresponding
to
n
=
1,
which applies to heat loss by conduction only. For convection,
n
is
514
and
for
radiation
4.
The upper
(3)
and lower
(1)
intersections are stable, whereas the
intermediate one
(2)
is unstable.
A
perturbation in Tat this point either leads to cooling to
the lower intersection
(l),
or
to a temperature rise to the upper intersection
(3).
If the heat
loss
decreases due
to
changes
of
the constants in Equation
(5.10),
the heat loss curve
RL
shifts to the right, and the intersection points
(1)
and
(2)
approach each other and finally
merge at the critical point
of
tangency
(4).
At the same time intersection point
(3),
which
determines the stable state
of
combustion, moves to higher temperatures.
394 Dust Explosions in the Process Industries
Figure
5.1
Heat generation and heat
loss
as
functions of temperature in the reaction zone.
Explanation of the various features
(lH5)
are
given
in
the text (From Thorne, 1985)
If
U
in Equation (5.10) increases, another critical point
of
tangency (5) is reached. If
U
increases further, ignition becomes impossible.
If the temperature rise
AT
of
the system described by Figure 5.1 is plotted as a function
of
the Damkohler number as defined in Equation (5.1), a stabilityhstability diagram as
illustrated in Figure 5.2 is obtained. The intersection and tangency points (1) to (5) in
Figure 5.1 are indicated.
The lower branch in Figure 5.2 is stable and corresponds to a slow, non-flaming
reaction. The upper branch is also stable and corresponds to steady propagation
of
the
combustion or decomposition wave. The intermediate branch is unstable. The system
temperature can be raised from ambient temperature without significant increase in the
reaction rate until the ignition point (2) has been passed. Then the system jumps to the
Figure
5.2
Stability/instability diagram for a com-
bustible system. The features
of
the points
(lH5)
are explained in the text (From Thorne, 1985)
Ignition
of
dust clouds and dust deposits
395
upper stable flame propagation branch. Upon cooling, i.e. increasing
U
or
n
or both in
Equation (5.10), the rate
of
reaction is reduced. However, the reaction continues right
down to (5) in Figure 5.2, from which the system temperature drops to a stable condition
in the extinguished regime.
The scheme illustrated in Figures 5.1 and 5.2 is quite general and applicable to different
types of systems. More extensive treatments
of
general
ignitiodcombustion-stability
theory were given for example by Gray and Lee (1967), Gray and Sherrington (1977) and
Bowes (1981). The classical basis for this type of analysis was established by Semenov
(1959) and Frank-Kamenetzkii (1969). The book by Bowes (1984) provides a unique,
comprehensive overview of the field
of
self-heating and ignition, not least in solid
materials including dust layers and heaps.
Although the basic considerations implied in Figures 5.1 and 5.2 to some extent provide
a satisfactory general definition of ignition, the precise theoretical definition has remained
a topic
of
scientific discussion. One example is the dialogue between Lermant and Yip
(1984, 1986) and Essenhigh (1986).
5.2
SELF-HEATING AND SELF-IGNITION IN POWDER DEPOSITS
5.2.1
OVERVIEWS
Bowes (1984) gave the state
of
the art of experimental evidence and theory up to the
beginning of the 1980s. Considerable information was available, and theory for predicting
self-heating properties
of
powders and dusts under various conditions of storage had been
developed.
There were nevertheless some gaps in the quantitative knowledge, one of which is
biological heating. In vegetable and animal materials such as feed stuffs and natural fibres,
self-heating may be initiated by biological activity, in particular if the volume of material is
large, its moisture content high and the period
of
storage long. However, because the
micro organisms responsible for the biological activity cannot survive at temperatures
above about
75"C,
biological heating terminates at this temperature level. Further heating
to ignition, therefore, must be due to non-biological exothermic oxidation, for which
theory exists. It is possible, however, that the long-term biological activity in a real
industrial situation may generate chemically different starting conditions for further
self-heating than the conditions established in laboratory test samples heated artificially to
75°C
by supply
of
heat from the outside. Further research seems required in this area.
Starting with the extensive account by Bowes (1984), Beever (1988) highlighted the
theoretical developments that she considered most useful for assessing the self-heating and
ignition hazards in industrial situations. In spite of many simplifying assumptions, the
models available appeared to agree well with experimental evidence. However, extrapo-
lating over orders
of
magnitude, from laboratory scale data to industrial scale, was
not recommended. Biological activity was not involved in the self-heating processes
considered.
396
Dust Explosions in the Process Industries
5.2.2
SOME
EX
PE
RI
MENTAL
I
NVESTl GAT1
ON
S
5.2.2.1
lsoperibolic experiments
In the isoperibolic configuration, the outside
of
the dust deposits is kept at a constant
temperature while the temperature development at one
or
more points inside the deposit
is monitored. The dust sample may either be mechanically sealed from the surroundings,
or air may be allowed to penetrate it, driven by the buoyancy of heated gases inside the
dust sample
or
by external over-pressure or suction.
Leuschke (1980, 1981) conducted extensive experimental studies
of
the critical para-
meters for ignition of deposits
of
various combustible dusts under isoperibolic conditions,
with natural air draught through the sample, driven by buoyancy. Figure
5.3
shows a plot
of the minimum ambient air temperature for self-ignition
of
deposits of cork dust samples
of various shapes and sizes as a function
of
the volume-to-surface ratio of the sample.
This correlation can be interpreted in terms
of
the critical Frank-Kamenetzkii para-
meter for self-ignition (Equation (5.11) below), which was discussed extensively by Bowes
(1984). Note that the abscissa scale in Figure
5.3
is linear with the logarithm of the
Figure
5.3
and shapes
as
a
function of the volume/surface area ratio (From Leuschke,
1981)
Minimum ambient air temperature for self-ignition of cork dust deposits of various sizes
Ignition of dust clouds and dust deposits
397
volume-ro-surface area, whereas the ordinate axis is linear with the reciprocal
of
the
temperature [K].
Some further experimental results produced by Leuschke (1980,1981) are mentioned in
Section
5.2.3.2.
Hensel (1987), continuing the line of research initiated by Leuschke, investigated the
influence of the particle size of coal on the minimum self-ignition temperature. Some
of
his results are given in Figure
5.4.
Figure
5.4
Influence of particle size of coal of
28
wt%
volatiles and
6.4
wt%
ash on the minimum
self-ignition temperature in a heated chamber for various sample volumes (From Hensel,
1987)
The abscissa axis is linear with the reciprocal of the absolute temperature, which means
that
UTmin
=
A
X
log (sample volume)
+
B,
where
A
and
B
are constants depending on
the particle size.
As
shown by Hensel(1987), these data also gave linear Arrhenius plots,
from which apparent activation energies could be extracted, using the Frank-Kamenetzkii
parameter:
6
=
Er2Qpfexp(
-
ElRT,)/RTz
A
(5.11)
as the theoretical basis. Here
E
is the activation energy,
R
the universal gas constant,
f
the
pre-exponential factor,
r
the characteristic linear dimension of the dust sample,
T,
the
ambient temperature (temperature
of
the air surrounding the dust sample in the furnace),
Q
heat of reaction per unit mass,
p
bulk density
of
the dust sample, and
A
the thermal
conductivity
of
the dust sample.
In a further contribution Hensel(l989) confirmed that data
of
the type shown in Figure
5.3,
for various sample shapes, could in fact be correlated with a good fit using the
Frank-Kamenetzkii parameter (Equation
(5.11)).
The linear dimension
r
was defined as
the shortest distance from the centre of the powder sample to its surface.
Heinrich (1981), being primarily concerned with self-ignition in coal dust deposits,
produced a nomograph from which the minimum ambient air temperature for self-ignition
in the deposit could be derived from measured values for the same dust and bulk density at
two different known volume-to-surface ratios. Although attractive from the practical point
398
Dust Explosions in the Process Industries
of
view, however, extrapolating laboratory-scale data to large industrial scale may, as
pointed out by Beever (1988), yield misleading results.
Guthke and Loffler (1989) nevertheless proposed that reliable prediction
of
induction
times to ignition in large scale can be obtained from activation energies derived from
laboratory-scale self-heating experiments under adiabatic conditions.
5.2.2.2
Dust deposit
on
hot
surface at constant temperature
Miron and Lazzara (1988) determined minimum ignition temperatures for dust layers on a
hot surface, for several dust types, using the method recommended by the International
Electrotechnical Commission, and described in Chapter 7. The materials tested included
dusts of coal and three oil shales, lycopodium spores, maize starch, grain dust and brass
powder. For a few of the dusts the effects of particle size and layer thickness on the
minimum ignition temperatures were examined. The minimum hot-surface ignition
temperatures of 12.7 mm thick layers
of
these dusts, except grain dust and maize starch,
ranged from 160°C for brass to 190°C for
oil
shale. Flaming combustion was observed only
with the brass powder. The minimum ignition temperatures decreased with thicker layers
and with smaller particle sizes. Some difficulties were encountered with the maize starch
and grain dusts. During heating, the starch charred and expanded, whereas the grain dust
swelled and distorted. The test was found acceptable for the purpose of determining the
minimum layer ignition temperature of a variety
of
dusts.
Tyler and Henderson (1987) conducted a laboratory-scale study in which the minimum
hot-plate temperatures for inducing self-ignition in
540
mm thick layers
of
sodium
dithionitehnert mixtures were determined. The kinetic parameters for the various mixing
ratios were determined independently using differential scanning calorimetry (DSC) in
both scanning and isothermal modes, and by isothermal decomposition tests. This allowed
measured minimum hot-plate temperatures for ignition to be compared with correspond-
ing values calculated from theory, using a modified version of the TylerIJones computer
simulation code. The code did not require any approximation of the temperature
dependence, and reactant consumption was accounted for assuming first order kinetics.
Tyler and Henderson found that the minimum hot-plate temperatures for ignition were
significantly affected by the air flow conditions at the upper boundary, as predicted by
theory. This must be allowed for when interpreting or extrapolating experimental data. It
was further found that the simple model
of
Thomas and Bowes can be used to interpret
experimental results even when appreciable reactant consumption occurs.
Henderson and Tyler (1988) observed that for certain types of dust different experi-
mental routes for the determination of the minimum ignition temperature of a dust layer
can lead to widely differing experimental values. For sodium dithionite, experiments
starting at a high temperature and working down led to an apparent minimum ignition
temperature of nearly 400°C compared to a value
of
about 190°C when experiments
started at a low temperature, working up. The cause of this behaviour was the two stage
decomposition
of
sodium dithionite, and the problems with preparing the dust layer on the
hot-plate fast enough for the first stage temperature rise
to
be observable at high plate
temperatures in the range 350400°C. Similar behaviour may be expected from some other
materials.
Ignition
of dust
clouds
and dust deposits
399
5.2.2.3
Constant heat flux ignition source in dust deposit
As
pointed out by Beever (1984) situations may arise in industry where hot suriaces on
which dust accumulates should be described as constant heat flux surfaces rather than as
surfaces at constant temperature. Beever mentioned casings
of
electric motors, high-
power electric cables and light bulbs that have become buried in powder
or
dust, as
examples. Practical situations where the temperature of the hot surface is not influenced
by the thermal insulation properties
of
dust accumulations may, in fact, be comparatively
rare.
In her constant heat flux ignition experiments, Beever (1984) used samples of wood
flour contained in a cylindrical stainless steel wire mesh basket of 0.8 m length and 0.1 m
diameter. The ignition source was an electrically heated metal wire coinciding with the
axis of the basket. In order to generate different ratios
of
the radius of the central
cylindrical hot surface and the thickness
of
the cylindrical dust-sample, the heating wire
was enveloped by ceramic tubes
of
different diameters. Some essential properties
of
the
wood flour are given in Table
5.1.
Table
5.1
Properties
of
wood flour used in self-ignition experiments reported
by
Beever
(1984).
Here
E
is the activation energy of the exothermic chemical reaction,
R
the gas constant,
Q
the heat of reaction, and
f
the pre-exponential frequency factor.
Figure
5.5
shows some
of
Beever’s experimental results for a hollow cylindrical wood
flour deposit surrounding a cylindrical hot-surface ignition source.
A
curve predicted from
an approximate theory is also shown. The agreement
of
the theoretical predictions, using a
step function approximation, with the experimental results is reasonable, except when the
radius
of
the hot-surface is very small in relation to the thickness
of
the dust layer.
5.2.2.4
Ignition
of
dust layers by
a
small electrically heated wire coil source:
propagation
of
smouldering combustion in dust layers
Leisch, Kauffman and Sichel (1984) studied ignition and smouldering combustion
propagation of dust layers in a wind tunnel where the top surface of the dust layer could be
subjected to a controlled air flow.
The ignition source was a coil
of
0.33 mm diameter platinum wire on a ceramic support.
A
constant power P was dissipated in the coil for a given period
of
time At, the dissipated
energy being PAt. Both P and
At
were varied systematically and the minimum dissipated
energy for ignition was determined as a function
of
dissipated power per unit area of the
400
Dust Explosions in the Process Industries
Figure
5.5
deposit (From Beever,
1984)
Minimum heat flux for ignition of a centrally heated infinitely long cylindrical wood flour
dust envelope in contact with the ignition source. Some results are shown in Figure
5.6.
The points in Figure
5.6
are experimental results, whereas the dotted curve is the expected
trend in the low power end. The vertical dashed line indicates the value of powedarea at
which the rate
of
energy input is equal to the rate
of
heat loss from the layer. The
experimental data in Figure
5.6
indicate that for the higher values
of
powedarea, more
energy was needed to ignite the dust layer than in the lower range. According to Leisch,
Kauffman and Sichel, this is because at the higher values of powedarea, the combustion
rate was oxygen diffusion limited and therefore much of the heat transferred to the layer
was lost by dissipation into the surroundings. At very low values
of
powedarea,
represented by the expected dotted curve, much
of
the energy furnished to the layer was
conducted away before the reaction rate had increased significantly.
Leisch, Kauffman and Sichel
(1984)
also studied the propagation of smouldering
combustion in layers
of
wood and grain dust. The studies revealed that the smouldering
combustion wave had a definite structure, and could be divided into four distinct regions.
The initial part of the wave was characterized by discoloration
of
the unburnt material due
to pyrolysis. Pyrolysis occurred when the temperature
of
the unburnt material reached a
minimum value characteristic
of
that particular material. The pyrolysis products were
gaseous volatiles and solid char. The volatiles escaped to the surroundings while the char
remained in the layer, forming the second region
of
the combustion wave, the combustion
zone. Oxygen from the atmosphere diffused into this zone, oxidizing the hot char, thereby
releasing heat. In the case
of
forced air flow over the dust layer surface, the combustion
zone could contain a visibly glowing subregion. The products of the combustion reaction
were
CO,
C02,
H20 vapour, and solid ash. If the combustion was incomplete, some
unburnt char would also remain. The ash and any unburnt char would then form the third
region
of
the combustion wave. The final region
of
the combustion wave was termed the
‘cavity’. Only gases (air plus combustion products) were present in this region. However,
Ignition of dust clouds and dust deposits
40
1
Figure
5.6
Influence of dissipated power in a hot platinum wire coil, embedded in a layer of grain
dust, per unit area of the dust in contact with the coil, on the minimum dissipated energy required for
initiating smouldering combustion in the dust layer. Thickness of dust layer
102
mm.
Ignition source
located
12.7
mm
below dust surface.
No
forced air flow past the dust surface (From Leisch, Kauffman
and Sichel,
7984)
it was shown to constitute an important part of the wave structure in the presence of forced
air flow.
Some results from the experiments by Leisch, Kauffman and Sichel are given in
Table
5.2
together with values predicted by using a numerical model developed by the
same authors.
Table
5.2
(pine) layers,
with
results from experiments (From Leisch, Kauffman and Sichel,
1984)
Comparison of results from numerical modelling
of
smouldering combustion in
wood
dust
The data in Table
5.2
refer to experiments with no forced air flow past the surface
of
the
dust layer. With an air flow
of
4
m/s
the combustion wave velocity was in the range
0.02
to
0.07
mds,
i.e. about
a
factor
of
two higher than without forced air flow. For grain dust
402
Dust
Explosions in
the Process
Industries
Browncoal 1.16“
layers the combustion wave velocity was 0.0035 to
0.008
mm/s without forced air flow and
two to two and one half times higher for
4
m/s
air flow. These values are lower than those
for wood dust by a factor of three or four.
0.39 74
5.2.2.5
Heat conductivity
of
dust/powder deposits
As
Figure 5.1 illustrates, the rate
of
heat
loss
plays an important role as to whether
self-heating will result in self-ignition. The heat conductivity of the powder deposit is a
central parameter in the heat loss process. It is
of
interest, therefore, to consider this
property more closely. Table 5.3 gives some thermal data for dust/powders published by
Selle (1957).
Table
5.3
powdered form (Data from Selle,
1957)
Specific heats and heat conductivities
of
some combustible materials in solid and
Substance
0.31
2.1 0.67
1.6 0.65
Powder
porosity
[VOl.Xl
0
0
88.5
67.5
59
1
Wood
I
0.55’
I
0.15
I
90
I
Speclflc
[JWI
heat
-
1
.o
4.2
0.88
0.75
1.25
2.5
2.5
1.05
)epedng’
Heat
condualvlty
[k
Jlm hK]
0.230
0.50
1.25
0.059
0.033
1
onemation
of
fibres
The heat conductivities in Table
5.3
for the powders, except for aluminium, are very
low, and in fact lower than for air. Selle did not describe the method of measurement and
further analysis
of
his data is not possible.
However, in recent years, John and Hensel (1989) developed a hot wire cell allowing
more accurate measurement
of
the heat conductivity of powder and dust deposits. The cell
was a vertical cylinder of diameter about
50
mm and height about 200 mm. The heat
source was a straight electrically heated resistance wire coinciding with the cell axis, and
generating a constant power. The temperature was measured as a function of time at a
point in the powder midway between the hot wire and the cell wall. John and Hensel used
the Fourier-type equation:
(5.12)
for calculating the heat conductivity
of
the powder from two measured temperatures
TI
and
T2
at times
fl
and
t2.
Here
A
is the heat conductivity and
q
the heat generated by the
Ignition
of
dust clouds and dust deposits
403
hot wire per unit time and wire length. This is a valid approach as
long
as the two
measured temperatures are within a range where the temperature is a linear function of
the logarithm of time.
A
set of data from measurements with this cell are given in Table
5.4.
Table
5.4
Heat conductivities
of
deposits
of
some combustible powders and dusts determined
from measurements in
a
hot wire cell, using Equation
(5.1
2)
(From John and Hensel,
1989)
Faveri
et
al.
(1989) presented a theory for the heat conduction in coal piles, using the
following expression for the heat conductivity
A
in a powder, developed for porous oxides
by Ford and Ford (1984):
A
=
A,(l
-
(1
-
aA$A,)E)/(l
+
(a
-
1)~) (5.13)
where
3AS
a=
2A,
i-
A,
and
A,
and
A,
are the heat conductivity for the solid and gas respectively and
E
is the
porosity of the powder deposit (see Chapter 3).
As
long as
A,
9
A,,
Equation (5.13)
reduces to:
A
=
A,(1
-
~)/(1
+
d2)
(5.14)
If this equation is applied to Selle's data in Table 5.3 for powdered sugar, the heat
conductivity becomes 0.70 kJ/mhK, and for aluminium and sulphur 58 and 0.23 kJ/mhK
respectively. All these values are considerably higher than those given by Selle. For cork
dust of porosity 0.95, assuming a value
of
2.2 kJ/mhK for
A,
(same as for sugar), Equation
(5.14)
yields the value 0.074 kJ/mhK, which is lower than for air and therefore must be
wrong. The reason is that the simplified Equation (5.14) yields
A
=
0
for
E
=
1,
whereas
according
to
physical reality
A
=
A,.
This requirement is satisfied by the more compre-
hensive Equation (5.13), which, when applied to the cork data, yields a value of
0.16 kJ/mhK. This differs only by a factor of two from the experimental value reported for
cork dust by John and Hensel (Table
5.4).
If John and Hensel worked with a significantly
lower porosity than 0.95, this could explain the difference.
Liang and Tanaka (1987a) used the following formula to account for the influence of
temperature on the heat conductivity of cork dust:
A
=
6.45
x
lo-'
T
+
0.1589 [kJ/mhK]
(5.15)
404
Dust Explosions in the Process Industries
For
T
=
300 K, this gives
A
=
0.35 kJ/mhK, which is close to the experimental value in
Table
5.4.
For
T
=
500
K,
Equation (5.15) gives
A
=
0.48 kJ/mhK.
Duncan
et
af.
(1988) reviewed various theories for the heat conductivity
of
beds
of
spherical particles, and compared predicted values with their own experimental results for
2.38 mm diameter spheres. They found that none of the theories tested were fully
adequate. In particular, the experiments revealed that gas conduction in the pores
between the particles had a significant and predictable effect on the bed conductivity. For
a loosely packed bed
of
aluminium spheres the experimental heat conductivity was
20
and
9 kJ/mhK in nitrogen at atmospheric pressure, and in vacuum respectively. For aluminium
and a porosity
E
of
0.35,
Equation
(5.14)
yields a bed conductivity
of
about 400 kJ/mhK,
which exceeds the experimental values substantially.
Duncan
et
af.
found that the heat conductivity of beds
of
aluminium spheres in nitrogen
increased by a factor
of
1.5-2.0 when the bed was exposed to a compacting pressure
of
about
1
MPa. This effect, which was practically absent in beds of spheres
of
non-ductile
materials, is probably due to enlargement
of
the contact areas between the particles in the
bed by plastic deformation.
It seems that a generally applicable theory for reliable estimation of heat conductivities
of
powder deposits does not exist. Therefore one must rely on experimental determina-
tion, e.g. by the method developed by John and Hensel (1989).
5.2.3
FURTHER THEORETICAL WORK
5.2.3.1
The
Biot
number
The dimensionless Biot number is an important parameter in the theory
of
self-heating
and self-ignition
of
dust deposits. It is defined as
Bi
=
hr/A
(5.16)
where
h
is the heat transfer coefficient at the boundary between the dust deposit and its
environment,
r
is half the thickness, or the radius of the dust deposit, and
A
its thermal
conductivity. The Biot number expresses the ease with which heat flows through the
interface between the powder deposit and its surroundings, in relation to the ease with
which heat is conducted through the powder.
A
Biot number
of
zero means that the heat
conductivity in the powder is infinite and the temperature distribution uniform at any
time.
Bi
=
m
implies that the resistance to heat flow across the boundary is negligible
compared to the conductive resistance within the powder.
As
pointed out
by
Bowes (1981) and Hensel (1989), the classical work
of
Semenov
(1935) rests on the assumption that
Bi
=
0,
whereas Frank-Kamenetzkii assumed
Bi
=
m.
Thomas (1958) derived steady-state solutions
of
the basic partial differential heat balance
equation for finite plane slabs, cylinders and spheres from which the Frank-Kamenetzkii
parameter (Equation (5.11)) could be calculated for Biot numbers
0
<
Bi
<
m.
Liang and Tanaka (1987) found that the fairly complex approximate relationships
between the critical condition for ignition and the Biot number originally proposed by
Thomas, could be replaced by much simpler formulae based on the Frank-Kamenetzkii
Ignition
of
dust clouds and dust deposits
405
approximate steady-state theory. Improved accuracy was obtained by adjusting the
formulae to closer agreement with the more exact general numerical solutions for
non-steady state.
5.2.3.2
Further theoretical analysis of self-ignition processes: computer simulation models
Liang and Tanaka (1987a, 1988) used the experimental results of Leuschke (1980, 1981)
from ignition
of
cylindrical cork dust samples under
isoperibolic conditions
as a reference
for comprehensive computer simulation
of
the self-heating process in such a system. They
assumed that heat did not flow in the axial direction, only radially, and arrived at the
following partial differential equation for the heat balance, considering heat generation by
zero-order chemical reaction and heat dissipation by radial conduction:
EIR
T
(5.17)
where
r
=
radial distance in cylindrical coordinates [m]
p
=
density of the sample [kg m-3]
C
=
specific heat
of
the sample
[J
kg-' K-'1
8
=
storage time [h]
Q
=
heat
of
reaction
[J
kg-'1
f
=
frequency factor
of
chemical reaction rate [kg mP3 h-'1
E
=
activation energy
[J
mol-']
R
=
universal gas constant
[J
mol-'
K-'1
T
=
temperature [K]
In order to compare predictions by Equation (5.17) with the data from Leuschke (1980,
1981) for cork dust, the appropriate boundary conditions had to be specified, including a
combined heat transfer coefficient of heat dissipation by natural convection and radiation
from the cylindrical wall
of
the cork dust sample. Temperature profiles
of
cylindrical cork
dust samples at any time could then be calculated at various ambient temperatures by
solving Equation
(5.17)
using the finite element method. The predicted radial temperature
distributions at any time, the minimum self-ignition temperature, as well as the induction
time to ignition, for various sample sizes, agreed well with the experimental data reported
by Leuschke (1981), except at extremely high ambient temperatures.
Figure
5.7
gives a set of predicted temperature profiles for cork dust samples
of
0.16 m
diameter, at three different ambient air temperatures. The predictions were in good
agreement with the corresponding experimental data reported by Leuschke (1980, 1981).
At very low ambient air temperatures, close to the minimum for ignition (about 412
K
for the 0.16 m diameter sample), ignition starts at the sample axis, whereas at high
temperatures it starts at the periphery. This is also in complete agreement with the
experimental findings
of
Leuschke (1980).
Figure
5.8
shows the minimum self-ignition temperature as a function
of
sample volume
for cylindrical cork dust samples, as determined experimentally by Leuschke (1981) and
by computer simulation by Liang and Tanaka (1987a, 1988).
A
=
thermal conductivity
of
the sample
[J
m-' h-'
K-'
1
406
Dust Explosions in the Process Industries
Figure
5.7
Temperature distributions in a cylindrical cork dust sample of diameter
0.16
m just before
ignition (solid lines) and just after (dotted lines), for three different ambient air temperatures
T,.
Theoretical predictions by Liang and Tanaka
(I
987a)
Figure
5.8
Dependence of minimum self-ignition temperature for cylindrical cork dust samples on
sample volume. Experimental data from Leuschke (198
1)
and computer simulation results from Liang
and Tanaka
(I
987a, 1988)
Figure 5.9 shows the increase of the induction time to ignition, i.e. the time from
introducing the dust sample into air of temperature
Tu
to ignition
of
the sample, with
increasing sample volume and decreasing
Tu.
Leuschke
(1981)
did not provide data for cork dust corresponding to the simulation
results in Figure
5.9.
However, he gave a set
of
experimental data for another natural
organic dust, which exhibit trends that are very close to those
of
the results in Figure
5.9.
The induction time to ignition is an important parameter from the point
of
view
of
industrial safety, because it specifies a time frame within which precautions may be taken
to prevent self-ignition. This in particular applies to large volumes at comparatively low
ambient temperatures, for which the induction times may be very long.
Ignition of dust clouds and dust deposits
407
Figure
5.9
Influence of dust sample volume and ambient air temperature on the induction time to
self-ignition of cylindrical deposits of cork dust.
T,,,,,
is the minimum ambient air temperature for
self-ignition. Computer Simulation results (From Liang and Tanaka,
(I
987a)
The finite element computer simulation approach offers a possibility for analysing
self-ignition hazards in a wide range of other geometrical configurations than cylinders.
Dik (1987) proposed the use of the thermal impedance method for numerical prediction
of
critical conditions for self-ignition for various boundary conditions.
Adomeit and Henriksen (1988) developed a computer model addressing the same
problem as the model used by Tyler and Henderson (1987), i.e. simulation
of
self-ignition
in dust layers on hot surfaces. It was assumed that the combustion was mainly controlled
by homogeneous gas phase reactions, following an initial step of pyrolysis of the solid fuel.
The system described by the model is composed of three zones as illustrated schematically
in Figure 5.10.
The model implied the following overall picture of the various steps in the ignition
process:
1. Formation of a thin gas layer close to the hot surface due to initial pyrolysis of the dust.
Reduction of temperature of dust closest to the hot surface due to thermal insulation by
the gas.
2.
At a given minimum gas layer thickness a homogeneous gas phase reaction starts in a
rich premixed zone close to the hot surface.
3.
Formation
of
a second diffusion flame zone between the burning premixed zone and
the hot surface, receiving fuel via further pyrolysis caused by the rich primary burning
zone.
4.
Extinction
of
diffusion flame due
to
lack
of
oxidizer. Drop in pyrolysis rate due to
cooling by extinguishing gas.
5.
Stabilization
of
premixed flame close to dudgas interface.
408
Dust Explosions in the Process industries
Figure
5.1
0
Schematical illustration of system described by computer simulation model for self-
ignition of dust layers on hot surfaces.
Y,
and
YBr
are the mass fractions of fuel and oxidizer in the gas
phase,
T
the gas temperature,
6
the thickness of the gas layer and
x
the distance from the
dusvgas
interface (From Adomeit and Henriksen,
1988)
This model seems to address the case of comparatively high hot-surface temperatures
and thin dust layers. Self-ignition in comparatively thick dust layers resting on hot surfaces
of
quite low temperatures often occurs inside the layer rather than at the hot surface.
Beever
(1984)
applied the classical self-ignition theory to a dust deposit exposed to a hot
surface at constant heat flux boundary conditions. She adopted the step-function
approximation devised by Zaturska
(1978)
and found good agreement between values
of
the critical Frank-Kamenetzkii parameter for ignition calculated by the approximate
theory and values obtained analytically by Bowes, for self-heating in a plane dust slab with
constant heat flux on one face.
As
shown in Section
5.2.2.3,
Beever also found good
agreement between the predicted minimum heat flux for ignition and experimental results
for cylindrical dust deposits heated by an internal concentric cylindrical constant flux heat
source.
Leisch, Kauffman and Sichel
(1984)
were primarily interested in the propagation of a
one-dimensional smouldering combustion wave in a dust layer. They obtained a numerical
solution
of
the conservation equations for this process in good agreement with experi-
mental results. (See Section
5.2.2.4).
The theoretical model also gave temperature and
density profiles within the combustion wave similar to those observed experimentally.
5.2.4
APPLICATIONS TO DIFFERENT POWDEWDUST TYPES:
A
BRIEF
LITERATURE SURVEY
5.2.4.1
Coal
dust
Elder
el
al.
(1945)
studied the relative self-heating tendencies of
46
different coal samples
of
particle sizes finer than
6
mm, using an adiabatic calorimeter and a rate-of-oxygen-
consumption meter. It was found that:
ignition
of
dust
clouds
and dust deposits
409
0
The self-heating tendency increased with decreasing coal rank.
0
The self-heating tendency increased with storage temperature.
0
The self-heating tendency decreased with increasing pre-oxidation of the coal prior to
0
The rate
of
heat generation due to oxidation was proportional to the
vel.%
oxygen in
The rate
of
heat generation due to oxidation was proportional to the cube root of the
0
Increasing the ash content in the coal, decreased the self-heating tendency.
0
An appreciable moisture content in the coal decreased the self-heating tendency.
Guney and Hodges (1969) reviewed the various experimental methods used up to that
time for determining the relative self-heating tendencies of coals. They concluded that
only isothermal and adiabatic methods would give consistent results. Shea and Hsu (1972)
used an adiabatic method for studying self-heating of various dried coals and petroleum
cokes at 70°C in atmospheres of oxygen or nitrogen saturated with water vapour, or in dry
oxygen. In a completely dry system there was no appreciable self-heating, even in pure
oxygen. The absorption
of
water from humid atmospheres by dry carbonaceous materials
was the major origin of the primary temperature rise from 70 to 90°C.
Chamberlain and Hall (1973) discussed the various chemical and physical properties
of
coals that influence their oxidizability
.
Continuous measurement of gases produced during
the oxidation process showed that carbon monoxide gives the earliest indication
of
spontaneous heating.
Heinrich (1981) provided a nomograph from which minimum ambient air temperatures
for self-ignition in coal dust deposits may be determined from laboratory-scale measure-
ments
of
the minimum self-ignition temperatures for two powder samples
of
different
volume to surface ratios. (See also Section 5.2.2.1.)
Heemskerk (1984), using both isothermal and adiabatic test methods, investigated the
relationship between the rate
of
self-heating in coal piles and the oxygen content in the
atmosphere in the range 0-20
vel.%
oxygen. A systematic decrease of the self-heating rate
with decreasing oxygen content was found. Addition of sulphuric acid and iron salts to
coal piles stimulated self-heating. Smith
ef
al.
(1988) investigated the effectiveness
of
ten
different additives, applied as solutions in water, to inhibit self-heating in deposits
of
a
coal of high self-ignition potential, using an adiabatic heating oven. Sodium nitrate,
sodium chloride and calcium carbonate were found to be the most effective inhibitors,
whereas sodium formate and sodium phosphate stimulated the self-heating process.
Enemoto
et
al.
(1987) studied the process leading to a fire in a new bag house installed
with a cyclone separator in a pneumatic transport system for pulverized coal. By using
classical Frank-Kamenetzkii type theory and appropriate values for the thermal conductiv-
ity of the very fine coal dust (2.3 pm) and for the kinetic parameters, it was confirmed that
the fire was most probably caused by self-ignition in a dust deposit in the bag house.
Bigg and Street (1988) developed a mathematical computer model for simulation of
spontaneous ignition and combustion
of
a bed
of
activated carbon granules through which
heated air was passed. The model simulated the temporal development of temperature
and gas species concentration. The model was validated against the experimental data
of
Hardman
et
al.
(1983) and good agreement was found.
Brooks
et
al.
(1988) formulated a mathematical model for evaluating the risk of
spontaneous combustion in coal stock piles, using a personal computer. The model
the test.
the air in contact with the coal, raised to the power
of
213.
specific surface area
of
the coal.
4
10
Dust Explosions in
the
Process
Industries
predicts expected trends with change in various parameters, but comprehensive validation
against experiments was not reported.
Tognotti
er
al.
(1988) studied self-ignition in beds of coal particles experimentally, using
various cylindrical-shaped beds of diameters 17-160 mm and heights
10-80
mm. Theoret-
ical thermal ignition models were used for interpreting and extrapolating the data from the
small-scale experiments. Results from additional isothermal experiments were compared
with the small-scale ignition tests. The boundary conditions (Biot number) played an
important part in deciding whether ignition would occur.
Takahashi
et
al.
(1989) simulated the temperature rise with time in a coal deposit due to
spontaneous oxidation, using a numerical computer model. The maximum temperature
occurred at the centre
of
the bed when the oxygen concentration inside the bed was not
reduced due to the oxidation reaction, whereas it occurred near the bed surface when the
oxygen concentration in the bed decreased due to the consumption. The rate
of
temperature rise was significantly affected by the activation energy and frequency factor
of
the coal oxidation. Measurement of the moisture absorbed on the oxidized coal samples
showed that the
loss
in mass due to oxidation increased markedly at temperatures above
120°C. By assuming that the limiting temperature for significant self-heating in coal
storage is 120"C, a maximum permissible size of stored coal deposit to prevent self-ignition
was estimated for various types of coal.
Hensel (1988) was concerned with a similar problem, namely predicting maximum
permissible storage periods for large coal piles. He extrapolated empirical laboratory-scale
correlations between the volume/surface area ratio of the dust deposit and the induction
time to ignition. An induction time of 10 years was predicted for some 20-year-old, large
coal piles in Berlin, in which self-ignition had been observed repeatedly over the last
years. By extrapolating the laboratory-scale data, Hensel also confirmed that the size of
the actual coal piles was larger than the maximum permissible size for preventing
self-ignition at average ambient air temperatures in the Berlin region.
5.2.4.2
Natural
organic
materia
Is
Raemy and Loliger (1982) used a heat flow calorimeter for studying the thermal behaviour
of cereals above 20°C. When the samples were heated in sealed measuring cells, strong
exothermic reactions were observed at about 170°C. These reactions were attributed
mainly to carbonization
of
the carbohydrates in the cereals. Raemy and Lambelet (1982)
conducted a similar heat flow calorimetric study
of
self-heating in coffee and chicory above
20°C.
In a study
of
the thermal behaviour of milk powders, Raemy, Hurrell and Loliger (1983)
used both heat
flow
calorimetry and differential thermal analysis. They found that four
main types of reactions are involved in the thermal degradation
of
milk powders. In order
of increasing temperature they are crystallization of amorphous lactose, Maillard reac-
tions, fat oxidation and lactose decomposition.
Self-ignition properties of fish meals were studied by Alfert and co-workers at CMI,
Bergen, Norway, by storing the samples, supported by metal gauze baskets, in air at
constant temperatures in the range 100-250°C. Some results were reported by Hostmark
(1989). For
1-
and 2-litre samples the minimum ambient air temperatures for self-ignition
were 140 and 130°C respectively. The corresponding induction times to ignition were
5-6
Ignition
of
dust
clouds
and dust
deposits
4
1
1
and
8
hours. At ambient air temperatures exceeding
2W240"C,
the dust samples ignited
close to the surface after induction times of the order
of
2
hours. (See trend in Figure 5.7.)
5.2.4.3
Corrosion of direct-reduced iron
Birks and Alabi (1986, 1987, 1988) were concerned with the special problem of
self-ignition in piles
of
direct-reduced iron when exposed to water. The problem arose
because direct-reduced iron is stored and transported in charges
of
considerable size, and
it had been observed that the bulk material has a tendency to oxidize to an extent leading
to self-ignition. Birks and Alabi investigated the various chemical reactions operating
when direct-reduced iron reacts with water and the oxygen in the air.
5.2.4.4
Self-ignition in dust deposits in
bag
filters in steel works
This problem was studied by Marchand (1988).
Two
specific cases were discussed to
illustrate how hot-spots and smouldering combustion can develop in fabric filter plants in
steel works. The cause
of
accumulation of deposits
of
very fine dust fractions in the clean
section
of
some filters, and the various possibilities
of
ignition were analysed. The dusts in
question contained a large fraction
of
combustible material, including carbon, various
organic compounds and metallic iron. The typical ignition sources were burning metal
droplets expelled from the molten metal and conveyed to the filter.
5.3
IGNITION
OF
DUST CLOUDS
BY
ELECTRIC
SPARK
DISCHARGES BETWEEN TWO
METAL
ELECTRODES
5.3.1
H
I
STORl
CA
L
B
AC
KG
RO
U
N
D
Holtzwart and von Meyer
(1
89
1)
were probably the first scientists
to
demonstrate that dust
clouds could
be
ignited by electric sparks. They studied the explosibility
of
brown coal
dusts in a small glass explosion vessel
of
50
cm3 capacity, fitted with a pair
of
platinum
electrodes, between which an inductive spark could pass.
A few years later Stockmeier (1899), who investigated various factors affecting the rate
of
oxidation
of
aluminium powder, was able to demonstrate that aluminium dust, shaken
up in a glass bottle, ignited in the presence
of
an electric spark.
Since the publication
of
these pioneering papers, numerous contributions to the
published literature on the spark ignition
of
dust clouds have been produced. Indeed they
have confirmed that ignition
of
dust clouds by electric discharges is a real possibility and
the cause
of
many severe dust explosions during the years, in mines as well as in industrial
plants.