Dust Explosions in the Process Industries Second Edition phần 8 docx
Bạn đang xem bản rút gọn của tài liệu. Xem và tải ngay bản đầy đủ của tài liệu tại đây (3.45 MB, 66 trang )
Sizing
of
dust explosion vents
453
Similar cyclone explosion experiments were conducted in Japan more recently by
Hayashi and Matsuda
(1988).
Their apparatus is illustrated in Figure 6.13.
The volume
of
the cyclone vessel was 0.32 m3, its total height
1.8
m and the diameter of
the upper cylindrical part 0.6 m. Dust clouds were blown into the cyclone through a
150 mm diameter duct. The desired dust concentration was acquired by independent
control
of
the air flow through the duct (suction fan at downstream end of system), and the
dust feeding rate into the air flow. The dust trapped in the cyclone dropped into a 0.15 m3
dust collecting chamber bolted to the bottom outlet. The exhaust duct
of
0.032 m2 cross
section and
3
m length ended in a 0.73 m3 cubical quenching box fitted with two vents of
0.3
m2 and 0.1 m2 respectively. The venting
of
the cyclone itself was through the 0.032 m2
Figure
6.1
3
industrial conditions (From Hayashi and Matsuda,
1988)
Experimental cyclone plant for studying dust explosion development under realistic
exhaust duct and the almost 10 m long
0.008
m2 dust feeding duct. During explosion
experiments two water spraying nozzles for flame quenching were in operation in the
exhaust duct in order to protect the fan just outside the quenching box. The ignition source
was a
5
kJ chemical igniter located in the dust feeding duct about 2
m
upstream of the
cyclone. Two different polymer dusts were used in the experiments, namely an
ABS
resin
dust of median particle size 180 pm, and an ethylene-vinyl acetate copolymer dust
(EVA)
of
median particle size 40 pm.
In addition to the realistic ‘dynamic’ explosion experiments, Hayashi and Matsuda
(1988) conducted a series
of
experiments with the same two dusts, using an artificial ‘static’
454
Dust Explosions in the Process industries
dust cloud generation method, very similar to that used in the experiments being the basis
of the
VDI
3673 (1979 edition).
As
illustrated in Figure 6.14, the dust feeding duct was
then blocked at the entrance to the cyclone, which reduced the effective vent area slightly,
to 0.032 m2.
Figure
6.1
4
0.32
m3
cyclone modified for gen-
eration
of
dust clouds by high-pressure injection
through perforated dust dispersion tubes (From
Hayashi and Matsuda,
1988)
A
system
of
two pressurized dust reservoirs and perforated tube dispersion nozzles were
employed for generating the dust clouds. The
5
kJ ignition source was located inside the
cyclone, half way up on the axis (indicated by X2). The ignition source was activated about
100 ms after onset of dust dispersion.
Envelopes embracing the results
of
both series
of
experiments are given in Figure 6.15.
As
can be seen, the artificial ‘static’ method of dust dispersion gave considerably higher
maximum explosion pressures in the cyclone, than the realistic ‘dynamic’ method. This is
in accordance with the results of the earlier realistic cyclone experiments
of
Tonkin and
Berlemont (1972). It is of interest to compare the ‘static’ results in Figure 6.15 with
predictions by
VDI
3673 (1979 edition).
A
slight extrapolation of the nomographs to
0.32 m2 vent area, assuming St
1
dusts, gives an expected maximum overpressure of about
2.5 bar(g), which is of the same order as the highest pressures of 1.5 bar(g) measured for
Sizing
of
dust explosion vents
455
Figure
6.1
5
Results from vented dust explosions in a
0.32
rn3
cyclone using
two
different polymer dusts
and
two
different methods of dust cloud generation.
0.03-0.04m2 open vents with ducts. Data from
Hayashi and Matsuda
(I
988)
(From Eckhoff,
1990)
the artificial ‘static’ dust dispersion method, and much higher than the pressures measured
in the realistic experiments.
The
NFPA
68 (1988 edition) includes an alternative nomograph which covers all St
1
dusts that do not yield higher
P,,
in standard closed bomb tests than 9 bar(g). This
nomograph gives much lower
Pred
values than the standard nomograph, in particular for
small volumes. In the case
of
the 0.32 m3 cyclone with a 0.032 m2 vent, the alternative
nomograph gives
Pred
equal to 0.50 bar(g), which in fact is close to the realistic
experimental values. This alternative nomograph originates from Bartknecht (1987), and
represents a considerable liberalization, by a factor of two or
so,
of the vent area
requirements for most St
1
and St 2 dusts. However, the scientific and technical basis for
this liberalization does not seem to have been fully disclosed in the open literature.
6.2.5
REALISTIC EXPERIMENTS
IN
BAG FILTERS
6.2.5.1
Vented explosions
in
a
6.7
m3
industrial
bag
filter unit in
UK
Lunn and Cairns (1985) reported on a series
of
dust explosion experiments in a
6.7
m3
industrial bag filter unit. The experiments were conducted during normal operation
of
the
filter, which was
of
the pulsed-air, self-cleaning type. Four different dusts were used, and
their
Ks,
values were determined according to
IS0
(1985) (see Chapter
7).
The ignition
source was located in the hopper below the filter bag section. In the experiments of main
interest here, the vent was in the
roof
of
the filter housing. Hence, in order
to
get
to
the
456 Dust Explosions in the Process Industries
vent, the flame had to propagate all the way up from the hopper and through the
congested filter bag section. The results from the experiments are summarized in Figure
6.16, together with the corresponding VDI 3673 (1979 edition) predictions.
Figure 6.16 first shows that the
Pred
in the actual filter explosions were mostly
considerably lower than the corresponding VDI 3673 predictions and close to the
theoretical minimum value
0.1
bar(g) at which the vent cover ruptured. Secondly, there is
no sensible correlation between the VDI 3673 ranking
of
expected pressures according to
the
Ks,
values, and the ranking actually found.
Figure
6.16
Maximum explosion pressures
Prd
measured in dust explosions in an industrial 6.7 m3
bag filter unit in normal operation.
P,,,
=
0.1
bar(g).
Data from Lunn and Cairns (1985). Comparison
with VDI 3673
(7
979 edition) (From Eckhoff, 1990)
Lunn and Cairns (1985) also reported on a series of dust explosion experiments in a
generously vented 8.6 m3 empty horizontal cylindrical vessel
of
LID
=
6. The same dusts
were used as in the filter experiments, but the dust clouds were generated ‘artificially’ by
injection from pressurized reservoirs as in the standard VDI 3673 method. In spite
of
the
similarity between the dust dispersion method used and the VDI 3673 dispersion method,
there was no correlation between
Pred
and
Ksr.
6.2.5.2
Vented explosions in
a
5.8
m3
bag filter in
Norway
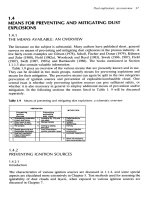
These experiments were reported in detail by Eckhoff, Alfert and Fuhre (1989). A
perspective drawing
of
the experimental filter is shown in Figure 6.17 and a photograph
of
a vented maize starch explosion in the filter in Figure 6.18.
Dust explosions were initiated in the filter during normal operation. A practical
worst-case situation was realized by blowing dust suspensions
of
the most explosible
concentration into the filter at 35
m/s
and igniting the cloud in the filter during injection.
Four dusts were used, namely, maize starch and peat dust, both having
Ksr
=
115 bar m/s,
and polypropylene and silicon dusts, both having
Kst
=
125 bar
m/s.
Considerable effort
was made to identify worst-case conditions of dust concentration, and ignition-timing. At
these conditions, experimental correlations
of
vent area and
Pred
were determined for
each dust.
Sizing of dust explosion vents 457
Figure
6.17
5.8
m3
experimental bag filter in Norway (from Eckhoff, Alfert and Fuhre,
19891
Figure
6.18
Maize starch explosion in 5.8
m3
experimental bag filter unit in Norway. Vent area
0.16 m2. Static opening pressure
of
vent cover
0.10
bar(@. Maximum explosion pressure 0.15 bar@).
for
a
much clearer picture see colour plate
8
458
Dust Explosions in the Process Industries
As
shown in Figure 6.19, the peat dust gave significantly lower explosion pressures than
those predicted by VDI 3673 (1979), even if the predictions were based on the volume of
the dusty filter section (3.8 m3) only.
Figure
6.19
Results from vented peat dust
explosions in
a
5.8
m3 filter at
P,,,
=
0.1
bar(@.
Comparison with VDI 3673
(I
979 edition) and
vent sizing method used in Norway (Eckhoff
(1
988)). Injected dust concentration 600
g/m3.
e
=
dusty section of filter,
0
=
clean section of
filter (From Eckhoff, 1990)
Figure 6.20 summarizes the results for all the four dusts.
As
can be seen, the explosion
pressures measured were generally considerably lower than those predicted by VDI 3673
(1979 edition) for all the four dusts as long as the ignition source was a nitrocellulose
flame. However, the singular result obtained for silicon dust ignited by a silicon dust flame
emphasizes the different nature
of
initiation and propagation of metal dust flames, as
compared with flames
of
organic dusts. (See discussion by Eckhoff, Alfert and Fuhre
(1989), and Chapter
4.)
As
illustrated by Figure 6.19,
Pred
scattered considerably, even when the nominal
experimental conditions were identical. This again illustrates the risk-analytical aspect of
the vent sizing problem (see Section 6.6). Figure 6.19 suggests that
VDI
3673 is quite
conservative, whereas the method used in Norway is quite liberal, in agreement with the
picture in Figure 6.3.
In Figures 6.20 and 6.21 the
5.8
rn3
filter results for all four dusts are plotted as functions
of
Ksr
from
1
m3 IS0 standard tests, and
(dPldt),,,
from Hartmann bomb tests. (See
Chapter 7.)
Predictions by various vent sizing methods have also been included for comparison. The
data in Figure 6.20 show poor correlation between the maximum explosion pressures
measured in the filter at a given vent area, and the maximum rates of pressure rise
determined in standard laboratory tests. Although the
Kst
values of the four dusts were
very similar, ranging from 115 to 125 bar
ds,
the
Pred
(nitrocellulose flame ignition) for
the four dusts varied by a factor of two to three.
In the case
of
the Hartmann bomb Figure 6.21 indicates a weak positive correlation
between
Pred
and
(dPldt),,,
for nitrocellulose ignition, but it is by no means convincing.
Figure 6.21 also gives the corresponding correlations predicted by three different vent
sizing methods based on Hartmann bomb tests. Both the Swedish and the Norwegian
methods are quite liberal. The Rust method oversizes the vents for the organic dusts
excessively for
(dPldt),,,
>
150
bark There
is,
however, fair agreement with the data for
silicon dust ignited by a silicon dust flame.
Sizing of dust explosion vents 459
Figure
6.20
Maximum explosion pressures for four
dusts in a vented 5.8
m3
filter
at
two
vent areas,
as
functions
of
KS,
determined by the
20
litre Siwek
sphere.
=
0.2
m2
vent area
0
=
0.3
m2
vent area
+
=
silicon dust flame ignition of silicon dust
P,,,,
=
0.1
bar(@
Comparison with
VDI
(1979 edition) predictions for
3.8
m3
volume (dusty section of filter)
(From
Eckhofc
1990)
nitrocellulose flame ignition
I
Figure
6.21
Maximum explosion pressures for four
different dusts in a vented
5.8
m3
filter
at
two
vent
areas, as functions of
(dP/dt),,,
determined by the
Hartmann bomb.
=
0.2
m2
vent area
0
=
0.3
m2
vent area
+
=
silicon dust flame ignition of silicon dust
P,,,
=
0.1
bar@)
Cornparison with maximum explosion pressures pre-
dicted for
3.8
m3 volume (dusty section of filter) by
three different methods
(From
Eckhoff, 1990)
nitrocellulose flame ignition
I
The use
of
closed-bomb tests for predicting the violence
of
accidental dust explosions in
industrial plants was discussed by Eckhoff (1984/85). (See also Chapter
7.)
6.2.6
OTHER LARGE-SCALE EXPERIMENTS RELEVANT TO INDUSTRIAL
PRACTICE
Some quite early work that is still of considerable interest and practical value deserves
attention. The pioneering work
of
Greenwald and Wheeler (1925) on venting of coal dust
explosions in long galleries is discussed in Section 4.4.7 in Chapter 4.
460
Dust
Explosions in the
Process
Industries
A
set of results from the comprehensive investigation by Brown and Hanson (1933) on
venting
of
dust explosions in volumes typical of the process industry were reproduced in
Figure 6.1. The paper by Brown and Hanson describes a number of interesting
observations and considerations including the effect
of
the location and distribution
of
the
vents and the influence
of
the size and type of ignition source.
Brown (1951) studied the venting of dust explosions in a 1.2 m diameter, 17 m long
horizontal tube with and without internal obstructions. The tube was either closed at one
end and vented at the other, or vents were provided at both ends. In some experiments an
additional vent was also provided in the tube wall midway between the two ends. The
location
of
the ignition point was varied.
Brown and Wilde (1955) extended the work
of
Brown (1951) by investigating the
performance
of
a special hinged vent cover design on the explosion pressure development
in a 0.76 m diameter, 15 m long tube with one or more vents at the tube ends and/or in the
tube wall.
Pineau, Giltaire and Dangreaux (1974, 1976), using geometrically similar vented vessels
of
LID
about 3.5 and volumes 1,10 and
100
m3, investigated the validity of the vent area
scaling law
A2
=
AI (V21V1)2/3.
They concluded that this law, which implies geometrical
similarity even of vent areas, was not fully supported by the experiments. However, as
long as the dust clouds were generated in similar ways in all three vessel sizes, and the
ignition points were at the vessel centres, the experiments were in agreement with the law
A2
=
A1 (V2/V1)0.52.
Pineau, Giltaire and Dangreaux (1978) presented a series of experimentally based
correlations for various dusts between vent area and vessel volume for open and covered
vents, with and without vent ducts. Both bursting membranes and spring-loaded and
hinged vent covers were used in the experiments.
Zeeuwen and van Laar (1985) and van Wingerden and Pasman (1988) studied the
influence of the initial size of the exploding dust cloud in a given vented enclosure, on the
maximum pressure developed during the vented explosion.
The investigation showed that the pressure rise caused by the explosion of a dust cloud
filling only part
of
a vented enclosure is higher than would perhaps be intuitively expected.
Even if the dust cloud is considerably smaller than the enclosure volume, it is usually
necessary to size the vent as if the entire volume of the enclosure were filled with
explosible cloud.
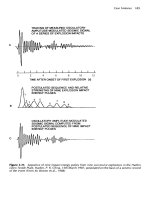
Gerhold and Hattwig (1989) studied the pressure development during dust explosions in
a vented steel silo of rectangular cross section. The length-to-equivalent-diameter ratio
could be varied between two and six. The explosion pressure and flame front propagation
histories were measured using a measurement system similar to that illustrated in Figure
6.6. The influence of the key parameters of industrial pneumatic dust injection systems on
the explosion development was investigated, in particular injection pipe diameter, air flow
and dust-to-air ratio. The general conclusion was that the maximum pressures generated
with realistic pneumatic injection were substantially lower than those predicted by the
VDI
3673 (1979 edition) guideline.
Sizing
of
dust
explosion
vents
46
1
6.3
VENT SIZING PROCEDURES FOR THE PRESENT AND NEAR
FUTURE
6.3.1
BASIC APPROACH AND LIMITATIONS
As
shown in Section 6.2, realistic vented dust explosion experiments, mostly conducted
during the 1980s, have demonstrated that none
of
the vent sizing codes in use up to 1990
are fully adequate. It is proposed, therefore, that for the present and near future, sizing of
dust explosion vents be primarily based on the total evidence from realistic experiments
that
is
available at any time.
The following suggestions presuppose that the initial pressure in the enclosure to be
vented is atmospheric. Furthermore, the vent covers must open completely within times
comparable to the opening times of standard calibrated rupture diaphragms. In the case
of
heavier, and reversible, vent covers such as hinged doors with counterweights,
or
spring-loaded covers, additional considerations are required. The same applies to the use
of
vent ducts and the new, promising vent closure concept that relieves the pressure, but
retains the dust and flame, thus rendering vent ducts superfluous. (See Section 1.4.6 in
Chapter 1.)
6.3.2
LARGE EMPTY ENCLOSURES
OF
VD
<
4
As
shown in Figure 6.3, a large empty enclosure of volume 500 m3 and
LID
=
4, in the
absence of excessive dust cloud turbulence, requires considerably smaller vents than those
specified by VDI 3673 (1979 edition)
or
NFPA
68 (1988 edition). This also applies to the
more liberal St
1
nomograph for constant-volume pressures
P,,,
<
9
bar(g), proposed by
Bartknecht (1987). (Not included in Figure 6.3.)
As
shown in Figure 6.12, even more
dramatic reductions in vent area requirements were found in a 250 m3 spherical vessel. In
this case the vent area actually needed was only one-eighth
of
that specified by VDI 3673
(1979 edition).
When sizing vents for large enclosures
of
LID
d
4, the exact vent area reduction factor
as compared with VDI 3673 (1979 edition), has to be decided in each case, but it should
certainly not be greater than
0.5.
In some cases it may
be
as small as 0.2 to 0.1. The new
edition
of
VDI 3673 (draft probably 1991) is likely to take this into account.
6.3.3
LARGE,
SLENDER
ENCLOSURES
(SILOS)
OF
VD
>
4
The only investigation
of
vented dust explosions in vertical silos
of
LID
>
4 and
volumes
>
100
m3
that has been traced, is that described in Section 6.2.2. The strong
influence
of
the location
of
the ignition source on the explosion violence, as illustrated in
462
Dust
Explosions
in
the
Process industries
Figure 6.9, is a major problem. It is necessary, in each specific case, to analyse carefully
what kind
of
ignition sources are likely
to
occur, and at what locations within the silo
volume ignition has a significant probability (Eckhoff (1987)). For example, if the
explosion in the silo cell can be assumed to be a secondary event, initiated by an explosion
elsewhere in the plant, ignition will probably occur in the upper part
of
the silo by flame
transmission through dust extraction ducts
or
other openings near the silo top. In this case
a vent
of
moderate size will serve the purpose even if
LID
of
the silo is large. However, the
analysis might reveal that ignition in the lower part of the silo is also probable, for example
because the dust has a great tendency to burn
or
smoulder. In this case even the entire silo
roof may in some situations be insufficient for venting, and more sophisticated measures
may have to be taken in order to control possible dust explosions in the silo.
6.3.4
SMALLER,
SLENDER
ENCLOSURES
OF
VD
>
4
The data
of
Bartknecht (1988) and Radandt (1985, 1989) from experiments in the 20
m3
silo constitute one useful reference point. Further data for a
8.7
m3 vessel
of
LID
=
6
is
found in the paper by Lunn and Cairns (1985). However, it is necessary to pay adequate
attention to the way in which the dust clouds are generated in the various experiments and
select experimental conditions that are as close as possible to the conditions prevailing in
the actual industrial enclosure (see Figure 6.11). Depending
on
the way in which the dust
cloud is generated in practice, vent area reduction factors, with reference to VDI 3673
(1979), may vary between
1.0
and 0.1.
6.3.5
INTERMEDIATE (10-25
m3)
ENCLOSURES
OF
SMALL
VD
The experimental basis is that of the VDI 3673 guideline (1979 edition) with highly
homogeneous, well-dispersed and turbulent dust clouds, and the more recent results for
much less homogeneous and less well-dispersed clouds (Figure 6.12). The vent area
requirements identified by these two sets of experiments differ by a factor of up to
5.
Adequate vent sizing therefore requires that the conditions
of
turbulence, dust dispersion
and level and homogeneity of dust concentration for the actual enclosure be evaluated in
each specific case.
6.3.6
CYCLONES
Two realistic investigations have been traced (Tonkin and Berlemont (1972) and Hayashi
and Matsuda (1988)), and both suggest a significant vent area reduction in relation to VDI
3673 (1979 edition). The early investigation by Tonkin and Berlemont using a cyclone
of
1.2 m3, indicates an area reduction factor of 0.2. The more recent investigation by
Hayashi and Matsuda, using a smaller cyclone
of
0.32 m3, indicates a factor
of
about
0.5.
Sizing
of
dust
explosion vents
463
Hence, for organic St
1
dusts
(Ks,
d
200 bar
ds)
there seems to be room for vent area
reductions with reference to the VDI 3673 (1979 edition), by factors in the range 0.5-0.2.
However, for metal dusts such as silicon, although there is no direct evidence from cyclone
explosions with such dusts, the VDI 3673 (1979 edition) requirements should probably be
followed as in the case
of
filters (see Section 6.3.7).
6.3.7
BAG FILTERS
The experimental basis is the evidence in Figures 6.16 and 6.19 to 6.21, produced by Lunn
and Cairns (1985) and Eckhoff, Alfert and Fuhre (1989). If ignition inside the filter itself is
the most probable scenario (no strong flame jet entering the filter nor any significant
pressure piling prior to ignition), the vent area requirements of VDI 3673 (1979 edition)
for St
1
dusts can be reduced by at least a factor
of
0.5.
If the dust concentration in the
feeding duct to the filter is lower than the minimum explosive concentration, the vent area
may be reduced even more.
However, in the case
of
some metal dusts such as silicon, primary ignition in the filter
itself may be less probable and ignition will be accomplished by a flame jet entering the
filter from elsewhere. In this case it is recommended that the vent area requirements of
VDI 3673 (1979 edition) be followed.
6.3.8
MILLS
The level
of
turbulence and degree of dust dispersion in mills vary with the type of mill.
The most severe states
of
turbulence and dust dispersion probably occur in air jet mills.
The experimental technique for dust cloud generation used in the experiments on which
VDI 3673 (1979 edition) is based, is likely to generate dust clouds similar to those in an air
jet mill.
For
this reason it seems reasonable that VDI 3673 (1979 edition) be used without
modifications for sizing vents for this type
of
mills. In the case of mills generating dust
clouds that are less turbulent and less well dispersed, it should be possible to ease the vent
area requirements, depending on the actual circumstances.
6.3.9
ELONGATED ENCLOSURES
OF
VERY LARGE
VD
This enclosure group includes galleries in large buildings, pneumatic transport pipes, dust
extraction ducts, bucket elevators, etc. In such enclosures severe flame acceleration can
take place because of the turbulence produced by expansion-generated flow in the dust
cloud ahead
of
the flame. In extreme cases, transition to detonation can occur. (See
Chapter
4.)
The generally accepted main principles for venting
of
such systems should be
followed. Either the enclosure must be made sufficiently strong to be able to sustain even
a detonation, and furnished with vents at one
or
both ends,
or
a sufficient number of vents
464
Dust Explosions in the Process Industries
have to be installed along the length
of
the enclosure to prevent severe flame acceleration.
Chapter
8
of
National Fire Protection Association (1988) provides useful more detailed
advice. Further evidence
of
how dust explosions propagate in long ducts under realistic
process conditions was presented by Radandt (1989a), as discussed in Chapter
4.
6.3.1
0
SCALING
OF
VENT AREAS
TO
OTHER ENCLOSURE VOLUMES AND
SHAPES, AND TO OTHER
Pred
AND DUSTS
The number of reported realistic vented dust explosion experiments is still limited. It may
therefore be difficult to find an experiment described in the literature that corresponds
sufficiently closely to the case wanted. A procedure for scaling is therefore needed.
National Fire Protection Association (1988) suggests the following simple equation
intended for scaling of vent areas for weak structures
of
Pred
d
0.1 bar(g):
C
x
A,
A
=-
p0.5
red
Here
A
is the vent area,
A,
is the internal surface area
of
the enclosure and
Pred
is the
maximum pressure (gauge) in the vented explosion.
C
is an empirical constant expressing
the explosion violence, based on experimental evidence. By using the internal surface area
as the scaling parameter for the enclosure ‘size’, the enclosure shape is accounted for such
that an elongated enclosure
of
a given volume gets a larger vent than a sphere of the same
volume.
Equation
(6.4)
was originally intended for the low-pressure regime only, but its form
presents no such limitations. Therefore, this equation may be adopted even for
Pred
>
0.1 bar(g) and used for first approximation scaling of vent areas from any specific
realistic experiment, to other enclosure sizes and shapes, other
Pred
and other dusts. At
the outset the constant
C
should be derived from the result
of
the closest realistic
experiment, from which data are available. Subsequent adjustment of
C
should be based
on additional evidencehndications concerning influence
of
dust type, turbulence, etc.
Most often this approach will imply extrapolation
of
experimental results, which is
always associated with uncertainty. Therefore the efforts to conduct further realistic
experiments should be continued.
6.3.1
1
CONCLUDING REMARK
Over the last decade our understanding
of
the dust explosion venting process has
increased considerably. Unfortunately, however, this has not provided us with a simple,
coherent picture.
On
the contrary, new experimental evidence gradually forces us to
accept that dust explosion venting is a very complex process. What may happen with a
given dust under one set of practical circumstances may be far apart from what will happen
in others. Therefore the general plant engineer may no longer be able to apply some
simple rule
of
thumb and design a vent in five minutes. This may look like a step
Sizing
of
dust explosion vents
465
backwards, but in reality it is how things have developed in most fields of engineering and
technology. Increasing insight and knowledge has revealed that apparently simple matters
were in fact complex, and needed the attention
of
somebody who could make them their
specialities and from whom others could get advice and assistance.
On the other hand, some qualitative rules
of
thumb may be indicated on a general basis.
One example is Figure
6.22,
which shows how, for a given type
of
dust, the violence
of
the
dust explosion,
or
the burning rate
of
the dust cloud, depends on the geometry
of
the
enclosure in which the dust cloud burns. Turbulence and dust dispersion induced by flow is
a key mechanism for increasing the dust cloud burning rate.
Figure
6.22
Qualitative illustration
of
correlation
between degree of dust dispersion, level of dust
cloud turbulence and presence of homogeneous
explosible dust concentration for a given dust in
various industrial situations, and the burning rate
of the dust cloud
6.4
INFLUENCE OF ACTUAL TURBULENCE INTENSITY OF THE
BURNING DUST CLOUD ON THE MAXIMUM PRESSURE IN
A
VENTED DUST EXPLOSION
This problem was studied specifically by Tamanini
(1989)
who conducted vented dust
explosion experiments in a
64
m3 rectangular enclosure of base
4.6
m
X
4.6
m and height
3.0
m. The vent was a
5.6
m2 square opening in one of the four
14
m2 walls
of
the
enclosure. Details
of
the experiments were given by Tamanini and Chaffee
(1989).
The dust injection system essentially was of the same type as illustrated in Figure
4.39
and discussed in Section
4.4.3.1
in Chapter
4.
It consisted
of
four pressurized-air
containers, each
of
0.33
m3 capacity and
8.3
bar(g) initial pressure and being connected to
four perforated dust dispersion nozzles. Two nozzle sets, i.e. eight nozzles, were mounted
on each
of
two opposite walls inside the chamber. The dust was placed in four canisters,
one for each
of
the pressurized air containers, located in the lines between the pressurized
466
Dust
Explosions in the Process Industries
containers and the dispersion nozzles. On activation of high-speed valves, the pressurized
air was released from the containers, entrained the dust and dispersed it into a cloud in the
64
m3 chamber via the
16
nozzles. The high-speed valves were closed again when the
pressure in the pressurized containers had dropped to a preset value of
1.4
bar(g).
As
illustrated in Figures
4.40, 4.41
and
4.42
in Chapter
4,
this type of experiment
generates transient dust clouds characterized by a comparatively high turbulence intensity
during the early stages of dust dispersion, and subsequent marked fall-off
of
the
turbulence intensity with increasing time from the start
of
the dispersion. This means that
the turbulence level
of
such a dust cloud at the moment
of
ignition can be controlled by
controlling the delay between start of dust dispersion and activation
of
the ignition source.
Tamanini
(1989)
and Tamanini and Chaffee
(1989)
used this effect to study the
influence of the turbulence intensity at the moment of ignition on the maximum pressure
generated by explosion of a given dust at a given concentration in their
64
m3 vented
chamber. The actual turbulence intensity in the large-scale dust cloud at any given time
was measured by a bi-directional fast-response gas velocity probe, in terms of the RMS
(root-mean-square)
of
the instantaneous velocity.
However, Tamanini and Chaffee
(1989)
also found that during the dispersion air
injection into the
64
m3 chamber, a strong mean flow accompanied the turbulent
fluctuations, at least in certain regions
of
the chamber. Furthermore, despite the injection
of
the air charge through a large number of distributed points, the flow field in the
chamber was highly non-uniform, with the non-uniformity continuing during the decay
part of the transient turbulence when the discharge
of
the air containers was complete.
However, it was pointed out that the observed deviation of the flow field from uniformity
is probably representative
of
the situation in actual process equipment, and complicates
the application
of
flame velocity data obtained in homogeneous turbulence, to practical
situations in industry. It also complicates the correlation of turbulence data with overall
flame propagation characteristics.
In order to characterize the turbulence intensity in the
64
m3 enclosure for a given small
time interval by a single figure, the RMS-values found for that time interval at a large
number of probe locations were averaged.
Figure
6.23
gives a set
of
data showing a clear correlation between the maximum
pressure in the vented explosion and the average RMS of the instantaneous fluctuating
turbulence velocity as measured by the pressure probes.
Figure
6.23 Influence of turbulence intensity of burning dust cloud on maximum pressure in vented
maize starch explosion in
64
m3
rectangular chamber. Starch concentration
250
g/m’
.
Vent size
5.6
m2.
Ignition source
5
1
chemical igniter at the chamber centre (From Tamanini,
7989)
Sizing
of
dust
explosion
vents
467
The contribution of Tamanini and co-workers is particularly valuable because it suggests
that a quantitative link between systematic venting experiments, in which the turbulence is
quantified, and the real industrial explosion hazard may be obtained via measurement of
characteristic turbulence levels in dust clouds in industrial process equipment.
Tamanini and Chaffee (1989) encountered problems when trying to correlate maximum
rates of pressure rise from 20 litre sphere tests with the maximum pressures in large-scale
vented explosions. This is in agreement with the findings illustrated in Figures 6.20 and
6.21.
6.5
THEORIES
OF
DUST EXPLOSION VENTING
6.5.1
INTRODUCTORY OUTLINE
As
described in Section 1.4.6.1 in Chapter 1, the maximum explosion pressure in a vented
explosion,
Pred,
is the result of two competing processes:
0
Burning
of
the dust cloud, which develops heat and increases the pressure.
Flow
of
unburnt, burning and burnt dust cloud through the vent, which relieves the
pressure.
In most cases the two processes are coupled via expansion-induced flow of the dust
cloud ahead
of
the flame, which increases the turbulence
of
the unburnt dust cloud and
hence its burning rate. In a comprehensive theory of dust explosion venting it will be
necessary to include a mathematical description of this complex coupling.
As
discussed in
Chapter 4, this has to some extent been possible in advanced modelling
of
gas explosions
in complex geometries, where the turbulence is generated by flow past comparatively
large geometrical obstacles. It is to be expected that the current rapid progress in gas and
dust explosion modelling will soon result in comprehensive theories and computer
simulation codes for conventional venting configurations in the process industry.
However, in the meantime several less comprehensive, more approximate theories are
in use, in which it is assumed that the burning
of
the dust cloud and the flow out
of
the vent
can be regarded as independent processes. In all the theories traced, it is assumed that the
burning rate of the dust cloud in the vented enclosure can in some way
or
other be derived
from the burning rate of the same dust in a standard closed-bomb test. The theories vary
somewhat in the way in which this derivation is performed, but in general none of the
existing venting theories seem to handle the complex burning rate problem satisfactorily.
As
Table 4.13 in Chapter 4 shows,
Ks,
values from dust explosions with the same dust in
closed bombs of various volumes and design can vary substantially, depending on dust
concentration, degree of dust dispersion and dust cloud turbulence.
When using a given
Ks,
value,
or
a maximum-rate-of-pressure-rise value, as input to the
various existing theories, the relevance
of
the laboratory test conditions yielding the value,
in relation to the dust cloud state in the actual industrial situation to be simulated, must be
evaluated.
The second part
of
the venting theories, describing the flow out
of
the vent, is generally
based on the classical, well-established theory
for
flow
of
gases through orifices.
468
Dust Explosions in the Process Industries
A third common feature
of
existing theories is the use
of
the fact that at the maximum
explosion pressure,
Pred,
in the vented enclosure, the first derivative
of
pressure versus
time is zero. This means that the rate
of
expansion
of
the dust cloud inside the enclosure
due to the combustion equals the rate
of
flow through the vent. An alternative formulation
is that the incremental pressure rise due to combustion equals the incremental pressure
drop due to venting.
In the general gas dynamics theory for venting of pressure vessels, one must distinguish
between the two cases sub-sonic and sonic flow. If the ratio
of
internal to external pressure
exceeds a certain critical value, the flow is governed by the upstream conditions only,
whereas at lower pressure ratios the pressure drop across the orifice plays a main role. For
a vent
of
small diameter compared with the vessel size (e.g. as in Figure 6.18), and
neglecting friction losses, the critical pressure ratio equals
where
y
is the ratio of the specific heat of the gas at constant pressure and volume.
For
air
and most combustion gases generated in dust explosions in air this value is about 1.8-1.9,
which corresponds to a pressure inside the vessel
of
0.8-0.9 bar(g) at normal atmospheric
ambient pressure.
For
most conventional process equipment the maximum permissible
explosion pressure in the vented vessel will be lower than 0.8-0.9 bar(g), and in such cases
the flow out
of
the vent is sub-sonic. However, in the case
of
quite strong process units,
such as certain types
of
mills, the pressure ratio
PJPo
during the first part
of
the venting
process may exceed the critical value, and the sonic flow theory will apply.
In the following sections only venting theories that were developed specifically for dust
explosions are included. However, as long as the dust cloud is regarded as a combustible
continuum, there is little difference between the theoretical treatment
of
a dust and a gas
explosion, apart from the dust dispersion and initial turbulence problem. Therefore
reference should be made at this point to some central publications on gas explosion
venting, including Yao (1974), Anthony (1977/78), Bradley and Mitcheson (1978, 1978a),
McCann, Thomas and Edwards (1985), Epstein, Swift and Fauske (1986) and Swift and
Epstein (1987).
6.5.2
THEORY
BY
MAISEY
An early attempt to develop a partial theory of dust explosion venting was made by
Maisey (1965). As a starting point he used a simple theory
for
laminar gas explosion
development in a closed spherical vessel, with ignition at the centre. The radial laminar
flame front speed was, as a first approximation, assumed to be a constant for a given fuel.
For dusts it was estimated from Hartmann bomb test data (see Chapter 7). A central
assumption was that the maximum pressure in a closed-bomb test is proportional to the
laminar radial flame speed. However, Maisey fully appreciated the fact that in the
Hartmann bomb test, as in any closed-bomb dust explosion test, the dust cloud is
turbulent, and that turbulence increases the flame speed. He suggested that Hartmann
Sizing
of
dust
explosion vents
469
bomb test data be converted to equivalent turbulent flame speeds, corresponding to the
turbulence level in the test. However, because this turbulence level is probably higher
than in dust clouds in most industrial plant, Maisey recommended a reduction of this
equivalent Hartmann bomb flame speed, according to the actual industrial situation.
The second main part of the venting problem, the flow
of
gas and dust out
of
the vent
opening, was not treated theoretically by Maisey
,
who instead used various experimental
results to derive semi-empirical correlations between maximum vented explosion pressure
and vent area for various enclosure volumes and closed-bomb flame speeds.
6.5.3
THEORY
BY
HEINRICH
AND
KOWALL
Heinrich and Kowall (1971), following the philosophy outlined in 6.5.1, and considering
sub-sonic flow, arrived at the following expression for the pressure equilibrium at the
maximum pressure
Pred:
where the left-hand side expresses the rate
of
rise
of
explosion pressure in the enclosure at
the pressure
Pred,
had the vent been closed for an infinitely small interval
of
time, and
A
is
the vent area [m']
V
is the volume of the vented enclosure [m3]
R
is the universal gas constant
=
8.31
J/(K
mol)
T is
the temperature [K]
M
is the average molecular weight of the gas to be vented [kg]
Pred
is the maximum explosion pressure in vented enclosure [bar(abs)]
Po
is the ambient (normally atmospheric) pressure [bar(abs)]
a
is the vent coefficient [-I, equal to
0.8
for sharp-edged vents
By rearranging Equation (6.6), the vent area
A
can be expressed as a function of the
other parameters, including the hypothetical rate
of
pressure rise at
Pred,
had the vent
been closed.
Heinrich and Kowall discussed the problems in quantifying the latter key parameter for
dust explosions. They correlated results from actual dust explosion venting experiments,
using vessel volumes up to
5
m3, with maximum rate
of
pressure rise values from the
1.2
litre Hartmann bomb (see Chapter 7).
It was then assumed that the 'cube root law' (see Section
4.4.3.3
in Chapter
4)
could be
applied:
It was concluded that the Hartmann bomb data could be correlated with the large-scale
data via Equations (6.6) and (6.7) using correction factors in the range 0.5-1.0. However,
Heinrich and Kowall encouraged the development
of
a new closed-bomb test method that
would yield maximum rates
of
pressure rise closer to industrial reality.
470
Dust
Explosions
in
the Process industries
In a subsequent investigation, Heinrich and Kowall (1972) discussed the influence on
Pred
of replacing the point ignition source normally used in the large-scale experiments, by
a turbulent flame
jet.
Whereas flame-jet ignition caused a considerable increase
of
(dPldt),,,
in closed vessel experiments, the increase of
Pred
in vented experiments was
comparatively small.
As
discussed in Section 1.4.4 1 in Chapter 1, and illustrated in
Figure 1.78, this conclusion can by no means be extended to flame jet ignition in general.
In some cases, e.g. with strong jets from long ducts, appreciably higher
Pred
values than
with point source ignition must be expected.
In his further studies, Heinrich (1974) incorporated experimental data from other
workers and proposed a set of nomographs for calculating vent areas, using maximum
rates of pressure rise from the
1
m3 closed Bartknecht-vessel (subsequently made an
ISO-standard) for identifying the combustion rate. The underlying assumption was a
positive, monotonic correlation between
(dPe,ldt)pce,
in the vented explosion and
(dP,,l
dt),,,
in the closed bomb, which was indicated by some experimental data.
Heinrich’s nomographs formed an essential part of the basis
of
the
VDI
3673 (from
1979) and NFPA 68 (from 1988).
Heinrich (1980) subsequently gave a useful analysis
of
the theory of the flow of a
compressed gas from a container into the surrounding atmosphere after a sudden
provision
of
a vent opening. Both the adiabatic and the isothermal cases were considered.
The gas dynamic analysis was also extended to two and three vessels coupled by ducting.
Good agreement with experiments was demonstrated.
Lunn
et
al.
(1988) and Lunn (1989) applied the Heinrich-Kowall theory for extending
the Nomograph method for vent sizing to the region
of
low maximum explosion pressures.
6.5.4
THEORY BY RUST
Rust (1979) based his theory on considerations very similar to those
of
Heinrich and
Kowall, using maximum rates of pressure rise from closed-bomb tests for assessing an
average burning velocity in the vented explosion via the cube root law. The weakest point
in Rust’s theory, as in all theories
of
this category, is the assessment
of
the burning velocity
of the dust cloud.
6.5.5
THEORY BY NOMURA AND TANAKA
The process studied theoretically by Nomura and Tanaka (1980), being identical with that
considered by Yao (1974) for gases, is illustrated in Figure 6.24. They envisaged a
boundary surface
x
-
x
that was sufficiently close to the vent for essentially all the gas in
the vessel being to the left
of
the surface, and sufficiently apart from the vent for the gas
velocity through the surface
to
be negligible. They then formulated a macroscopic energy
balance equation for the flow system describing the venting process, assuming that all the
pressure and heat energy was located to the left of the x
-
x line in Figure 6.24, and all the
kinetic energy to the right.
Sizing
of
dust explosion vents
47
1
Although the approach taken by Nomura and Tanaka is somewhat different from those
of Heinrich and Kowall, and Rust, the basic features are similar and in accordance with
what has been said in Section 6.5.1. It may appear as if Nomura and Tanaka were not
aware
of
the fact that Heinrich and Kowall (1971) used Equation (6.7) for estimating the
rate
of
pressure rise in the vented enclosure from standard closed-bomb test data.
Figure
6.24
Conceptual model
of
explosion venting
(From Nomura and Tanaka,
1980)
Nomura and Tanaka correlated their theoretical predictions with experimental data
from various workers and found that the calculated vent areas were about three times the
experimental ones. Their analysis confirmed that
AIVU3
=
constant seems to be a sensible
scaling law for enclosures
of
length-to-diameter not much larger than unity.
6.5.6
THEORETICAL ANALYSIS BY NAGY AND VERAKIS
Nagy and Verakis (1983) first gave a comprehensive analysis of the physical process
of
venting
of
a vessel containing compressed air, applying classical gas dynamics theory, as
also done by Heinrich (1980). Both the sonic and subsonic regimes were explored. They
then formulated the theory
of
the thermodynamics of the combustion process, and finally
discussed the combustion rate in more qualitative terms. The combustion part
of
the
theory was of the same nature as that
of
closed vessel explosions reviewed in Section
4.2.5.1 in Chapter 4.
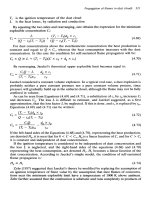
Nagy and Verakis first developed a one-dimensional theory for unrestricted sub-sonic
venting
of
a dust explosion in a long cylinder with the vent at one end. Three cases were
considered, namely ignition at the closed cylinder end, at the vent and at the centre.
Turbulence generation due to flow
of
unburnt cloud towards the vent was not considered.
The one-dimensional theory was then extended to the spherical configuration illustrated in
Figure 6.24. The corresponding theory
for
sonic venting was also formulated.
The treatment by Nagy and Verakis provides a basis for formulating various equations
connecting maximum pressure and vent area, assuming that
dPldt
=
0
at the maximum
pressure, using vessel shape, ignition point and flow regime as parameters.
472
Dust
Explosions in the
Process
Industries
However, Nagy and Verakis were not able to formulate a comprehensive burning rate
theory. They applied the simplified 2-zone model of combustion, assuming a very thin
flame and a burning velocity
Sua,
where
S,
is the laminar burning velocity and
a
>
1
a
turbulence enhancement factor. The product
Sua
was estimated from closed-bomb
experiments with the dust of interest.
Nagy and Verakis also extended their theory to the case where the bursting pressure
of
the vent cover is significantly higher than the ambient pressure. Theoretical predictions
were compared with experimental data from dust explosions in a
1.8
m3 vented vessel.
6.5.7
THEORY
BY
GRUBER
ET
AL.
In their study, Gruber
et
al.
(1987)
applied the same basic gas dynamics considerations as
previous workers to analyse the flow through the vent. The influence of the turbulence on
the combustion rate was accounted for by multiplying the laminar burning velocity with a
turbulence factor, as done by Nagy and Verakis
(1983).
Gruber
et
al.
included a useful
discussion of the nature and magnitude of the turbulence factor, by referring to more
recent work by several workers. In particular, attempts at correlating empirical turbulence
factors with the Reynolds number
of
the flow of the burning cloud were evaluated.
6.5.8
THEORY
BY
SWIFT
Swift
(1988)
proposed a venting equation implying that the maximum pressure in the
vented vessel is proportional to the square of the burning velocity of the dust cloud.
A
turbulence factor, obtained from correlation with experimental data, was incorporated in
the burning velocity, as in the case of Nagy and Verakis.
6.5.9
THEORY
BY
URAL
The special feature of this theory compared with those outlined above, is the assumption
that the pressure rise in the unvented explosion can be described by the simple function
shown in Figure
6.25.
This implies that the maximum rate of pressure rise in the unvented explosion equals:
Sizing
of
dust explosion vents
473
Figure
6.25
explosion used in the venting theory by Ural(7989)
Mathematical approximation for the shape
of
the pressure rise curve for the unvented
where
P,,,
and
Po
are the maximum and initial pressures and
tmax
is the time from ignition
to when the maximum pressure has been reached. The explosion rate is then essentially
characterized by the single parameter
tmax.
By means of the generalized form of Equation
(6.7),
experimental values of
(dP/dt),=
from closed-bomb tests may be converted to
(dPldt),,,
for the actual enclosure, without venting, and then to the corresponding
tmax
using Equation
(6.8),
which may be used in the venting theory for predicting maximum
vented explosion pressures,
Pred.
It is then assumed that the rate of heat release in the
vented explosion versus time is the same as in the unvented explosion.
As
for the other theories discussed, a central requirement for obtaining reasonable
predictions is that the state of the dust cloud in the closed-bomb test used for predicting
the explosion violence corresponds to the state of the dust cloud in the vented explosion of
concern.
6.5.1
0
CONCLUDING
REMARK
In all the theories outlined above, the modelling of the burning rate of the dust cloud is
incomplete. The situation may be improved by making use of systematic correlations of
burning rates and initial dust cloud turbulence intensities determined experimentally in
controlled explosion experiments, and measurements of typical turbulence intensities in
various industrial plants. The studies of Tamanini and co-workers, discussed in Section
6.4,
constitute a valuable step in this direction. The approach for the future is probably
further development of the type of more comprehensive theories discussed in Section
4.4.8
in Chapter
4.
474
Dust
Explosions
in
the
Process
Industries
6.6
PROBABILISTIC
NATURE
OF
THE
PRACTICAL VENT SIZING
PROBLEM
6.6.1
BASIC
PHILOSOPHY
This aspect of the venting problem was treated by Eckhoff (1986). Section 1.5.1 in
Chapter
1
gives a general overview
of
the probabilistic element in designing for dust
explosion prevention and mitigation.
Consider a specific process unit being part of a specific industrial plant in which one
or
more specific combustible materials are produced andor handled in powdered
or
granular
form. The process unit can be a mill, a fluidized bed, a bucket elevator, a cyclone, a
storage silo
or
any other enclosure in which explosible dust clouds may occur.
Assume that the plant can be operated for one million years from now, with no
systematic changes in technology, operating and maintenance procedures, knowledge and
attitudes of personnel, or in any other factor that might influence the distribution of ways
in
which dust clouds are generated and ignited. One can then envisage that a certain finite
number
of
explosion incidents will occur during the one-million-year period. Some
of
these will only be weak ‘puffs’, whereas others will be more severe. Some may be quite
violent. Because it is assumed that ‘status-quo’ conditions are re-established after each
incident, the incidents will be distributed at random along the time axis from now on and a
million years ahead.
The enclosure considered is equipped with a vent opening. The expected maximum
pressure
P,,,
generated in vented explosions in the enclosure, will by and large decrease
with increasing vent size. This is illustrated in Figure 6.26. If the vent area is unnecessarily
large, as AI, the distribution
of
expected explosion pressures will be well below the
maximum permissible pressure
Pred.
On the other hand,
if
the vent is very small, as A3, a
considerable fraction of all explosions will generate pressures exceeding the maximum
permissible one. (Note that the A2 and A3 cases in Figure 6.26 illustrate the pressures that
would have been generated had the enclosure been sufficiently strong to withstand even
In the case
of
A2,
the vent size is capable of keeping a clear majority of all explosion
pressures below
Pred.
If the fraction
of
the explosions that generates
P,,,
>
Pred
represents a reasonable risk, A2 will constitute an adequate vent size for the case in
question. However, the decision as to whether the fraction
of
expected destructive
explosions is acceptable, depends on several considerations. The first is the expected total
number of incidents of ignition
of
a dust cloud in the enclosure in the one-million-year
period. This number is strongly influenced both by the standard obtained with respect to
elimination of potential ignition sources and the standard
of
housekeeping. If these
standards are comparatively low, the overall chance
of
cloud ignitions will be compara-
tively high. Consequently, it will be necessary to require that the fraction of all expected
explosions that will not be taken care of by a vent, be comparatively small to ensure that
the expected number
of
destructive explosions is kept at an acceptable level. On the other
hand,
if
the probability
of
dust cloud ignition is low, one can rely on a smaller vent than
if
the standard of housekeeping and the efforts to eliminate ignition sources are inadequate.
This is illustrated in Figure 6.27.
prnax
>
Pred.)
Sizing of dust explosion vents
475
Figure
6.26
Distributions of.maximum explosion pressures generated in
a
given process unit, fitted
with vents of different sizes, by the same one-million-year population of explosions. The unit of
explosion frequency is number of explosions per million years per unit ofpressure. The areas under the
frequency curves then give the total number of explosions in one million years and are thus the same
for the three cases
Risk is often defined as the product
of
the expected number
of
a specific type of
undesired event in a given reference period, and the consequence per event. When
specifying the maximum acceptable number
N
of destructive explosions in the one-
million-year period, i.e. the maximum acceptable number
of
explosions
of
P,,,
>
Pred,
it
is therefore necessary to take into account the expected consequences
of
the destructive
explosions. This comprises both possible threats to human life and health and possible
damage to property.
In principle, the standard of explosion prevention can be
so
high that the total number
of expected explosions in the one-million-year period is
of
the same order as the
acceptable number of destructive explosions. In such cases it is questionable whether
installing a vent would be advisable at all.
Figure
6.26
illustrates the ‘random’ variation of the expected combustion rate for a
specific process unit in a specific plant handling a specific dust. However,
if
the dust
chemistry or the particle size distribution is significantly changed, the distributions
of
P,,,
will also change. For example, if the particle size is increased and a systematic reduction
of
combustion rate results, all three distributions in Figure
6.26
will be shifted towards lower
P,,,
values.
The
small vent area A3 may then turn out to be sufficient. Alternatively, the
average running conditions of the process could be altered in such a way that a significant
systematic change in the dust cloud turbulence or concentration within the process unit
476
Dust Explosions in the Process Industries
Figure
6.27
Illustration
of
the reduction
of
necessary vent area resulting from reduction
of
the overall
probability
of
dust cloud ignitions.
N
is
the maximum acceptable number
of
destructive explosions per
one million years
would result. This would also cause the distributions in Figure
6.26
to change, rendering
the original vent size either too small or unnecessarily large.
A
general illustration
of
the consequence of any significant systematic change
of
this
kind is given in Figure
6.28.
If the system is altered in such a way that the dust cloud combustion rates would
generally be reduced (Modification
I
in Figure
6.28),
the original vent size
A
would be
unnecessarily large. On the other hand, if the alteration would generally lead to increased
explosion violence (Modification
I1
in Figure
6.28),
the original vent area might turn out
to
be too small.
Sizing of dust explosion vents
477
Figure
6.28
distribution of
P,,,
Illustration of the influence of modifying dust properties
or
process design on the
6.6.2
THE ’WORST CREDIBLE EXPLOSION’
The discussion in Section
6.6.1
has exposed a central problem in prescribing an adequate
vent size for a given purpose: Identification
of
the ‘worst-case’ explosion to be designed
for. In some venting cases and guidelines, the choice
of
‘worst case’ is rather conservative,
both with respect to dust concentration, turbulence level and degree of dust dispersion. In
defence
of
this approach, it has been argued that the venting code ensures safe venting
under all circumstances encountered in practice. However, extreme conservatism may not
be the optimal solution. Excessive overdesign
of
vents quite often imposes significant,
unnecessary practical problems and costs both in finding a suitable vent location that does
not conflict with other design criteria, and in designing excessive vent cover arrangements.
Furthermore, providing a large vent opening may significantly reduce the strength of the
process unit to be vented, necessitating complicating reinforcement for maintaining the
original strength.
Conservative, rigid venting requirements may cause industry to conclude that venting is
not applicable to their problem at all, and no vents are provided. This situation has been
quite common in the case
of
large storage silos in the grain, feed and flour industry. The
alternative venting philosophy outlined in Section
6.6.1
implies that even a modestly sized
vent may add significantly to the safety standard of the plant by being capable
of
providing
adequate relief for the majority
of
the expected explosions.
Results from realistic experiments
of
the kind discussed in Section
6.2,
combined with
proper knowledge about the actual industrial process and plant, constitute the existing
basis for assessing the ‘worst credible explosion’. In the future, systematic studies
of
different selected representative scenarios can probably be conducted by using compre-
hensive computer simulation models.