Báo cáo khoa học: "Estimating stand biomass in the Tamaulipan thornscrub of northeastern Mexico" pdf
Bạn đang xem bản rút gọn của tài liệu. Xem và tải ngay bản đầy đủ của tài liệu tại đây (221.14 KB, 9 trang )
J. Návar et al.Stand biomass in Tamaulipan thornscrub of northeastern Mexico
Original article
Estimating stand biomass in the Tamaulipan thornscrub
of northeastern Mexico
José Návar
a*
, Eduardo Méndez
a
and Virginia Dale
b
a
Facultad de Ciencias Forestales, UANL, Km 145 Carretera Nacional Linares, N.L. 67700, Mexico
b
Environmental Science Division, Oak Ridge National Laboratory, Oak Ridge, TN, USA
(Received 28 January 2002; accepted 27 June 2002)
Abstract – This paper presents information on below and aboveground standing biomass measurements and estimates using quadrat attributes
in the Tamaulipan thornscrub of northeastern Mexico. Biomass components (i.e., leaves, branches, stem, and roots) were measured in 55 (5 m ×
5 m) quadrats across northeastern Mexico. Total aboveground standing biomass wasestimatedona per ha basis using six equations from two ad
-
ditive procedures, and contrasted against two conventional sets of equations. The results indicated that total standing weighted biomass averages
60.31 ± 12.24 Mg ha
–1
, composed of leaf (2.51 ± 0.47 Mg ha
–1
), branch (24.44 ± 4.88 Mg ha
–1
), stem (9.80 ± 2.62 Mg ha
–1
), and root
(23.56 ± 4.25 Mg ha
–1
) biomass. The additive equations developed in seemingly unrelated linear regression that use quadrat attributes provided
unbiased biomass estimates within the range of precision reported by conventional procedures. The additive equations are recommended for use
in estimating total stand biomass for several land management issues.
seemingly unrelated linear regressions
Résumé – Estimation de la biomasse sur pied de buissons épineux dans la région de Tamaulipan au nord-est du Mexique. Cet article pré-
sente des informations provenant de mesures et d’estimations de biomasses aériennes et souterraines sur pied des buissons épineux de la région
du Tamaulipan, au nord-est du Mexique. Les composantes de ces biomasses furent mesurées sur 55 placeaux carrés répartis dans le nord-est du
Mexique. Au niveau de chaque placeau, la biomasse totale sur pied fut estimée au moyen de six équations basées sur deux procédures additives,
comparées à deux autres ensembles conventionnels d’équations appliqués à toutes les espèces arbustives présentes sur les placeaux observés.
Les résultats ont montré que la biomasse totale sur pied est en moyenne égale à 60,31 ± 12,24 Mg ha
–1
, composée de la biomasse des feuilles
(2,51 ± 0,47 Mg ha
–1
), des branches (24,44 ± 4,88 Mg ha
–1
), des tiges (9,80 ± 2,62 Mg ha
–1
) et des racines (23,56 ± 4,25 Mg ha
–1
). Les équa
-
tions additives ont été développées au moyen de la méthode des régressions linéaires paraissant non liées. Elles ont été établies sur les caractéris
-
tiques des placeaux et ont donné des estimations non biaisées dans l’intervalle de la précision estimée, basée sur des procédures conventionelles.
Ces équations sont donc recommandées pour estimer la biomasse totale sur pied des placettes dans différents cadres d’aménagement.
régressions linéaires apparemment non liées
1. INTRODUCTION
Accurate estimates of stand biomass are important for the
balance of energy and elements such as carbon and nitrogen
in forest ecosystems. The conventional procedure of estimat
-
ing stand biomass uses allometric equations to predict indi
-
vidual tree biomass and sums these quantities to obtain total
biomass per area [31]. Biomass prediction equations are
built upon simple, inexpensive, and easily measured tree
characteristics such as diameter at breast height (Dbh) or
basal diameter (D), top height, canopy cover, or a combina
-
tion thereof [2, 12, 15, 28, 29, 31]. When quantifying above
-
ground biomass of forest ecosystems with multiple species,
the use of allometric equations for each species becomes a te
-
dious task and requires data on all species present. Therefore,
single equations that use individual tree parameters have
been developed for tropical forests [3], temperate forests of
the eastern United States [20], and semi-arid subtropical
shrubs of northeastern Mexico [29].
Ann. For. Sci. 59 (2002) 813–821 813
© INRA, EDP Sciences, 2002
DOI: 10.1051/forest:2002079
* Correspondence and reprints
Tel.: 821 24895; e-mail:
Foresters frequently inventory trees to report above
-
ground stand biomass based on allometric equations. This ap
-
proach is currently a common practice around the world. For
example, Brown et al. [3] and Fang et al. [11] used previously
developed allometric equations of biomass measurements,
coupled with conventional forest inventory data to quantify
aboveground biomass of tropical and Chinese forests. Other
procedures of stand biomass estimation use stand volume and
weighted wood density parameters, but these estimates can
be biased by a factor ranging from 0.3 [11] to 2.0 [19]. How
-
ever, biomass equations that use stand attributes to inventory
aboveground standing biomass are scarce. Fang et al. [11] re
-
ported stand biomass-volume relationships for Chinese for
-
ests and calculated the carbon stock in standing aboveground
biomass.
Conventional techniques to predict biomass at the level of
species or groups of species are classified as additive and
non-additive equations, and they can be developed using
stand or quadrat attributes as well. Clutter et al. [5] reported
several non-additive techniques of allometric equations for
single tree species. Cunnia and Brigs [7, 8] and Parresol [31]
described three procedures of biomass estimation that meet
the additivity requirements, where total biomass is estimated
by (a) adding the best regressions for each biomass compo-
nent, (b) using the same independent variables to estimate all
biomass components, and (c) seemingly unrelated regression
by setting constraints on the regression coefficients. The last
procedure has been used extensively in the development of
biomass tables for single species [7, 8, 14, 31]. The potential
sources of error in using these procedures have been widely
discussed [7, 29, 31]. Navar et al. [29] use these techniques
for biomass estimation for single species and all species of
the Tamaulipan thornscrub of northeastern Mexico. How
-
ever, there is scarce information on the development of addi
-
tive equations that predict aboveground biomass components
using quadrat characteristics and how they compare with the
conventional procedures of biomass inventory. In this paper
we (i) develop equations that use quadrat parameters for bio
-
mass inventory and (ii) contrasted these equations that use
quadrat attributes with (a) a single equation for each species
that uses tree attributes and (b) a single equation for all spe
-
cies that uses tree attributes. The last two sets of equations
were previously reported by Navar et al. [29].
2. MATERIALS AND METHODS
2.1. Site description
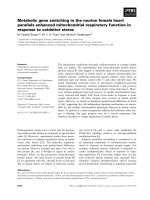
The Tamaulipan thornscrub covers approximately 200 000 km
2
in northeastern Mexico and Southern Texas [10,13]. In northeastern
Mexico, it occurs in Coahuila (1 452 800 ha), Nuevo Leon
(900 150 ha), and Tamaulipas (864 500 ha), covering a total area of
3 218 800 ha [30] (figure 1). This ecosystem is limited to the north
-
west by the Chihuahuan Desert, to the west by the Sierra Madre Ori
-
ental mountain range, and to the south by the tropical rainforest of
the Sierra Azul mountain range in south-central Tamaulipas. It has
been extensively used as pastureland for the last 350 years [16] and
is currently used for fuel, timber, food, and drugs [35].
The Tamaulipan thornscrub is quite dense and diverse, which
makes it difficult to use a single biomass equation for all species in a
stand. Romero [36] and Manzano and Návar [23] recorded on aver
-
age 22 shrub species in 0.1 ha plots and more than 5000 shrubs
per ha in 0.025 ha plots. Medium and small shrubs are common life
forms, and tall individuals are disappearing because of land-use
changes and selective harvesting for fuel wood and timber. The
understory is composed of annual and perennial herbs and grasses,
but it is inconspicuous under the high density canopy cover of
shrubs. The dominant shrub species of this biome are reported in
table I [6, 34].
The study area encompasses four locations within the
Tamaulipan thornscrub ecosystem in the northeastern region of
Mexico: (a) the northwestern portion, covering the northern part of
the states of Coahuila, Nuevo Leon, and Tamaulipas (NW); (b) the
south-central region of Nuevo Leon (SC); (c) the piedmont of the
eastern Sierra Madre mountain range in the state of Nuevo Leon
(SM1); and (d) the piedmont of the eastern Sierra Madre mountain
range of western Tamaulipas (SM2). The southern part of the region
814 J. Návar et al.
Figure 1. The distribution of the Tamaulipan thornscrub of northeast-
ern Mexico and sampling locations (NW = northwestern; SC = south
central; SM1 = Sierra Madre 1; and SM2 = Sierra Madre 2) in the
Mexican States of Tamaulipas, Coahuila, and Nuevo Leon.
is characterized by a moist, subtropical climate typical of southeast
-
ern Nuevo Leon and western Tamaulipas, while the northern border-
ing region is characterized by a semi-arid climate. Average annual
precipitation is 400–500 mm in the northern part of the three-bor-
dering Mexican states, 1000–1200 mm at the piedmont, and
1600 mm in the higher elevations of the first range of mountains of
the Sierra Madre [24]. Convective storms are common. Most rain-
falls are of short duration, high intensity, and small depth, and only
storms of intensity > 20 mm h
–1
are capable of producing surface
runoff and soil erosion [27]. Cold front systems generate most of the
winter rainfall, although accounts for less than 10% of the long-term
annual average [26]. Pan evaporation is less variable than annual
precipitation and approximates 2000 mm in the plains of the north-
ern Gulf of Mexico [25].
Soils characterized as litosols and rendzins dominate the hilly
slopes of the eastern Sierra Madre mountain range and the smaller
mesetas on the plains of the northern Gulf of Mexico. Yermosols
and xerosols are distributed most frequently in the arid western and
northwestern region, and vertisols dominate the lowlands of the
plains of the northern Gulf of Mexico.
The Tamaulipan thornscrub forests and its different low forest
formations dominate land use, occupying 65% of the Rio San Juan
Watershed, a basin located in northeastern Mexico, within the three
bordering states. Shifting cultivation is common in the commu
-
nity-based land tenure system, ejido, which is rapidly reducing the
area of the thornscrub forests. Other land cover includes coniferous
and broadleaf forests, covering 6.37% of the total area; irrigated and
dry land agriculture, covering 18% of the region; and reservoirs, ur
-
ban area, grasslands, and secondary native scrub forests, which
cover the remaining area [1].
2.2. Data collection
Within the study locations 55 quadrats, each 5 m × 5 m, were de
-
lineated. Quadrats were systematically placed at each location to
represent all potential sources of variation in the physical character
-
istics of the environment. Quadrats were placed at least 10 m away
from roads, and in areas representing typical environmental charac
-
teristics with the least disturbance by selective logging and grazing.
Eleven quadrats were located at NW, 14 at SC, 12 at SM1, and 18 at
SM2. Prosopis glandulosa, a widely distributed species within the
Chihuahuan Desert, dominates plant cover at NW. Cordia boissieri,
Pithecellobium pallens, Pithecellobium ebano, and Acacia spp
dominate plant cover at SC, SM1, and SM2. All woody shrubs were
measured for basal diameter (d), top height (h), horizontal projec-
tion of canopy cover (ct), species (s), and biomass components (leaf,
branch, stem). These data were collected within each quadrat. For
the multi-stemmed species (P. pallens, A. rigidula, and B.
myricaefolia) only an average diameter and top height were re-
corded. Basal diameter, instead of diameter at breast height (Dbh)
was measured to include all shrub size. Thus basal area was deter-
mined from basal diameter. Individual shrub canopy cover was esti-
mated by measuring the four canopy radial sections of each shrub
and calculating the circular area. These data provided information to
estimate mean diameter (D), mean height (H), basal area (BA), spe
-
cies richness (S), and density (N) for each quadrat. In each quadrat,
shrubs were felled and separated into leaves, branches, and main
stem. For the multi-stemmed species, biomass components of all
stems were measured, weighed fresh, and approximately 10% of
each component was taken to the laboratory for ovendry analysis.
Root biomass contains a high proportion of forest biomass and
methods to evaluate it vary greatly [39]. We used excavation meth
-
ods conventionally applied in a random sample design to incorpo
-
rate the large spatial variation associated with root distribution [18,
39]. The root biomass component was measured in three pits ran
-
domly placed within each of 34 selected quadrats of the SC, SM1,
and SM2. Pits with dimensions of 1 m × 1m× soil depth of the A and
B horizons (approximately 0.50 m) were excavated. All roots>1cm
in diameter were isolated, weighed fresh, and oven-dried. In shallow
soils, soil depth was excavated to less than 0.5 m because of the pres
-
ence of the C-horizon. In addition, three soil samples of 1 kg were
collected from each pit, air-dried, and pulverized, and fine roots
were screened and isolated for ovendry weighting analysis. Biomass
data were collected between January and July of 2001.
At the individual species scale, root biomass has been statisti
-
cally related to tree characteristics [40]. In this study, root biomass
was predicted by testing several relationships including the ratio of
root/total aboveground biomass vs. average basal diameter, average
Stand biomass in Tamaulipan thornscrub of northeastern Mexico 815
Table I. Common shrub species of the Tamaulipan thornscrub of northeastern Mexico.
Common subtropical shrub species of southeastern Nuevo Leon
Acacia berlandieri Benth. Forestieria angustifolia Torr.
A. farnesiana (L.) Wild. Fraxinus greggii A. Gray
A. rigidula Benth. Gochnatia hypoleuca DC.
Calliandra conferta Gray Helietta parvifolia (Gray) Benth.
Celtis pallida Torr. Leucophyllum texanum (Teran & Berl.) I.M. Johnst
Condalia hookeri M.C. Johnst. Malpighi glabra L.
Cordia boissieri DC. Mimosa biuncifera
Diospyros palmeri Scheele Pithecellobium pallens (Benth.) Standtl.
Diospyros texana Scheele Pithecellobium ebano (Berl.) Muller
Ehretia anacua (Terán & Berl.) I.M. Johnst. Prosopis laevigata (Willd.) M.C. Johnst.
Eysenhardtia polystachya (Ort.) Sarg. Schaefferia cuneifolia Gray
Eysenhardtia texana Scheele Zanthoxylum fagara (L.) Sarg.
Common semiarid shrub species of northern Tamaulipas, Nuevo Leon, and Coahuila
Acacia rigidula Prosopis glandulosa
Porliera Angustifolia Zizifus obtusifolia
top height, average canopy cover, and interactions of these vari
-
ables. The statistical relationship developed for the first quadrats
was used to estimate root biomass for the remaining 21 quadrats.
2.3. Data analysis
Estimates of total aboveground and root biomass were computed
on per hectare basis for the distribution area of the Tamaulipan
thornscrub. First an analysis of variance was conducted on the bio
-
mass component by using the locations as the main source of varia
-
tion. Latter biomass estimates were weighted by assuming that the
Tamaulipn thornscrub distributes 50% in the semiarid and 50% in
the subtropical region of northeastern Mexico.
Two additive regression procedures were used for developing
the quadrat biomass component equations based on average quadrat
characteristics including average basal diameter (cm), average top
height (m), basal area (m
2
ha
–1
), stand density (n ha
–1
), species rich
-
ness (n in 5 m × 5 m), the combined variable D
2
H (cm
2
m
–1
), and the
logarithmic equivalents for each variable LD, , LD
2
H. In the first
additive procedure, when developing regression relationships for
each biomass component (leaf, branch, and stem at the quadrat
scale) four different equations were tested: multiple linear (MSLin;
equation (1)); multiple log-transformed (MSLog; equation (2)); lin
-
ear covariance (CovLin; equation (3)); and log-transformed
covariance (CovLog; equation (4)). Covariance analysis is a statisti-
cal procedure to estimate parameters of single equations for each
biomass component. The quadrat attributes basal area, mean basal
diameter, mean top height, stocking, species richness, and their log
transformation are the covariables. The parameters of these equa-
tions were estimated in multiple linear regression using stepwise
procedures. The stepwise procedure helps in the selection of appro-
priate independent variables. The first two regressions can be found
in the literature of allometric equations for single tree species [5].
The last two equations have not been previously reported for single
species neither at the stand scale, although Cunia and Briggs [9]
tested a similar procedure called harmonization in a linear form for
single species.
In the second additive procedure two regressions were tested: the
seemingly unrelated linear regression procedure (SurLin), and the
seemingly unrelated log-transformed regression (SurLog). Cunia
and Briggs [7], Parresol [31], and Navar et al. [29] have discussed
the advantages of the SurLin procedure for individual temperate for
-
est species of eastern United States and subtropical shrubs of north
-
eastern Mexico. The seemingly unrelated regressions were derived
with the resulting independent variables of the MSLin and MSLog
procedures, respectively. The constraints force the coefficients of
each biomass components to be equal to the coefficients of total bio
-
mass. SurLin and SurLog methods were run in syslin procedures in
SAS. In total, six different methods of estimating biomass compo
-
nents were tested. The Sur equations are not described below be
-
cause they have similar independent variables to MSLin and
MSLog. However, the coefficients are different because they were
restricted to compute total biomass by adding the coefficients of
similar independent variables.
$
y
leaf
=b
10
+b
11
(D
2
H)+ +b
1k
(H)+b
12
(LD
2
H)+ +b
1n
(LH) (1)
$
y
branch
=b
20
+b
21
(D
2
H)+ +b
2k
(H)+b
2k + 1
(LDB
2
H)+ +b
2n
(LH)
$
y
stem
=b
30
+b
31
(D
2
H)+ +b
3k
(H)+b
3k + 1
(LD
2
H)+ +b
3n
(LH)
$$$ $
yyy y
totalleafbranchstem
=+ +
Ly
leaf
$
=b
10
+b
11
(D
2
H)+ +b
1k
(H)+b
12
(LD
2
H)+ +b
1n
(LH) (2)
Ly
branch
$
=b
20
+b
21
(D
2
H)+ +b
2k
(H)+b
2k+1
(LDB
2
H)+ +b
2n
(LH)
Ly
stem
$
=b
30
+b
31
(D
2
H)+ +b
3k
(H)+b
3k+1
(LD
2
H)+ +b
3n
(LH)
$
exp exp exp
$
$$
y
total
Ly
Ly Ly
leaf
branch stem
=+ +
$
y
total
=
b
0
+b
11
(D
2
H)+ +b
1k
(H)+b
12
(LD
2
H)+ +b
1n
(LH) + (3)
+b
21
(D
2
H)+ +b
2k
(H)+b
2k+1
(LDB
2
H)+ +b
2n
(LH) +
+b
31
(D
2
H)+ +b
3k
(H)+b
3k+1
(LD
2
H)+ +b
3n
(LH)
Ly
total
$
=
b
0
+b
11
(D
2
H)+ +b
1k
(H)+b
12
(LD
2
H)+ +b
1n
(LH) +(4)
+b
21
(D
2
H)+ +b
2k
(H)+b
2k+1
(LDB
2
H)+ +b
2n
(LH) +
+b
31
(D
2
H)+ +b
3k
(H)+b
3k+1
(LD
2
H)+ +b
3n
(LH)
$
exp
$
y
total
Ly
total
=
where
$
,
$
,
$
yy y
leaf branch stem
and
= biomass component for leaf, branch,
and stem in quadrats of 5 × 5 m (Mg ha
–1
),
L
$
y
leaf
= natural logarithm
of leaf biomass component, and b
ik
= statistical coefficients.
Comparisons between additive procedures (best regression
equation and seemingly unrelated regression), among equations (six
equations), and among scales (quadrat, 17 equations for each spe
-
cies, and one equation for all species present) were conducted. Com
-
parisons between additive equations developed in this report were
performed by contrasting estimated average goodness of fit statis
-
tics and predicted total quadrat biomass. Comparisons among equa
-
tions developed at different scales were performed based on
goodness of fit statistical averages across additive procedures, equa
-
tions, and scales. Three scales were contrasted: (a) the additive
equations developed in this report using quadrat attributes, (b) the
additive equations developed for 17 single species using individual
tree attributes, and (c) the additive equation developed for all spe-
cies using individual tree attributes. The last two sets of equations
were previously reported in a separate research paper [29], and they
were applied to each shrub within each quadrat. The goodness-of-fit
statistics used were the coefficient of determination, or fit index (r
2
),
standard error (Sx), coefficient of variation (CV), mean percent er-
ror (S%), and percent error (Pe). The Pe statistics is unusual and ref-
erences can be found in Parresol [31]. These statistics were
computed with observed and predicted total aboveground biomass
as:
r 1 – (RSS / TSS) RSS = (Y Y TSS = (Y Y
2
ii
i= 1
n
i
i= 1
n
=
∑∑
–
$
)–)
22
Y= y n
i
i= 1
n
∑
/
(5)
Sx RSS/(n–p)=
(6)
CV (Sx / Y=×) 100
(7)
S
100
n
Y–Y/Y
ii
i1
n
i
(%)
$$
=
=
∑
(8)
Pe
(196)
(n–p)
Y
Y
–1
2
2
i
i
2
i1
n
2
v
=
=
∑
χ
χ
$
/
(
12
)
/
(–)=++0 853 1 645 2 1
12
vv
(9)
where: n = number of observations,
$
Yi
= estimated total biomass in
quadrat i (Mg ha
–1
), Yi = observed total biomass in quadrat i
(Mg ha
–1
), p = number of statistical coefficients to be estimated,
v = n–p–1.
These statistics were computed only for total biomass, rather
than for each biomass component separately. Parresol [31] and
Cunia and Briggs [8] suggested a correction factor when using log
transformations of biomass data. In this report, we did not use a cor
-
rection factor, because when variables were log-transformed, pa
-
rameters were estimated with the log-transformation procedure and
then converted to obtain the original total biomass units. Finally the
816 J. Návar et al.
statistics were estimated with the observed and estimated total bio
-
mass for each quadrat in conventional units. Least squares tech
-
niques in multiple regression, multiple regression with dummy
variables, and system of linear equation procedures was used to
compute parameters. The additive system of equations estimates to
-
tal aboveground biomass by calculating each biomass component
(leaf, branch, and stem). Root biomass is independently estimated
because it was better related to total aboveground biomass rather
than to the quadrat attributes.
Comparisons between additive procedures, equations, and scales
were conducted by assessing the efficiency in estimating total
quadrat biomass. Therefore, efficiency was estimated as (xi–xb)/xb,
where xi = goodness of fit statistic i and xb = best goodness of fit sta
-
tistic. Additive biomass equations (procedure 1 and 2 described ear
-
lier) were worked in four (MSLog, MSLin, CovLog, and CovLin)
and two (SurLog and SurLin) different forms. Therefore, averages
were estimated for goodness-of-fit statistics and total quadrat bio
-
mass.
3. RESULTS AND DISCUSSION
A total of 30 woody species were observed in all 55 quad
-
rats. The highest importance values (iv) (relative dominance
+ relative frequency + relative abundance) were recorded for
Cordia boissieri (iv = 48), Pithecellobium pallens (iv = 44),
Prosopis glandulosa (iv = 30), Acacia berlandieri (iv = 27),
and Diospyros texana (iv = 27). At the semiarid location,
P. glandulosa, P. angustifolia, and A. rigidula recorded the
highest importance values. At the subtropical locations,
C. boissieri, P. pallens, G. hypoleuca, H. parvifolia, and
A. rigidula dominated the plant community. At the SM loca-
tions, D. texana, A. berlandieri, P. pallens, C. boissieri,
A. wrightii, A. rigidula, and G. hypoleuca dominated the
plant community. High stem density characterizes the
Tamaulipan thornscrub, with an average slightly greater than
5 000 stems ha
–1
(table II). This system is composed of
shrubs or small trees with average diameter and top height of
6.5 cm and 3.2 m, respectively. These attributes result in a
mean basal area of 16.9 m
2
ha
–1
. Although canopy cover of
average shrubs is large (3.4 m
2
shrub
–1
) and stand cover ex
-
ceeds 17 500 m
2
ha
–1
, shrubs are inconspicuous due to the
widespread distribution of tree branches. In some places, can
-
opy cover strongly overlaps between shrubs. Thus, this plant
community is characterized by high canopy overlap in some
places and by open spaces within and between shrubs in other
areas.
3.1. Measured aboveground biomass components
Observed aboveground biomass components are
statistically different among locations (P = 0.0077). Total
aboveground biomass (30.16 ± 5.66 Mg ha
–1
) was smaller in
the NW semiarid location than the subtropical SC
(50.89 ± 10.84 Mg ha
–1
), and SM2 (48.29 ± 4.67 Mg ha
–1
)
locations. Total aboveground biomass was not statistically
different between the SM1 location (44.03 ± 10.33 Mg ha
–1
)
and the NW location, between SM1 and SM2, nor between
SM1 and SC locations. Assuming that the semiarid and sub
-
tropical Tamaulipan thornscrub distributes equally, 50% of
the total area each, of the three Mexican States
(3 217 450 ha), average weighted total aboveground biomass
is 38.94 ± 7.14 Mg ha
–1
. Navar et al. [28] estimated from
0.25 ha plots an average aboveground biomass of
51 Mg ha
–1
. Heiseke and Foroughbakhch [17] reported for
the Tamaulipan thornscrub between 34.21 and 62.70 Mg ha
–1
in the plains and between 26.06 and 37.70 Mg ha
–1
in the
hills. Heiseke [16] concluded that this biome has a maximum
standing biomass of 50 Mg ha
–1
. Carstens [4] measured be
-
tween 35 and 47 Mg ha
–1
considering only shrubs and trees of
this plant community. Therefore, our measurements are con-
sistent with other estimates in the Tamaulipan thornscrub of
south central Nuevo Leon.
3.2. Measured root biomass
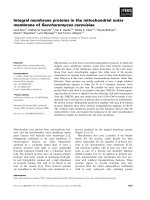
Root biomass was linearly related to total aboveground
standing biomass for all 34 measured quadrats (figure 2). The
relationship that includes average top height, average hori-
zontal canopy cover, and total aboveground biomass pro-
vided better goodness-of-fit statistics. However, this multiple
regression equation was not used to predict the missing root
biomass measurements of the remaining 21 quadrats. The
former equation is more sensitive to total aboveground root
biomass. The simple linear regression equation determined
that total aboveground standing biomass explained 63% of
the total root biomass variation. The procedure used to mea
-
sure and estimate root biomass result in large errors (Sx =
5.4 Mg ha
–1
or CV = 18.6%) because of the spatial variation
of this plant component [37]. Difference in root distribution
between the 30 species observed in all 55 quadrats may ex
-
plain much of the variation in root biomass. The ratio of root
to total aboveground biomass was 40.2%. The ratio of root to
branch biomass was 96.0%, and the linear regression
Stand biomass in Tamaulipan thornscrub of northeastern Mexico 817
Table II. Characteristics of shrub species in 55 quadrats of the Tamaulipan thornscrub forest of northeastern Mexico.
Statistic Density
(No ha
–1
)
Basal Area
(m
2
ha
–1
)
Basal Diameter (cm) Top Height (m) Canopy Cover (m
2
)
Mean Mean Mean
Mean 5140 16.90 6.47 3.24 3.42
Std Dev 2008 0.33 1.46 0.88 1.75
C.I. (
1–α=0.95
) ±532 ±0.01 ±0.39 ±0.23 ±0.46
Std Dev= Standard Deviation, C.I. = Confidence Intervals.
between these two components had a slope coefficient of
0.81 indicating an equilibrium between these two biomass
compartments. The ratio of root/shoot recorded in this study
is larger than the 18–30% estimated for trees of temperate
ecosystems [18, 21, 33] and smaller than the ratio of 300% re-
corded for Mediterranean shrub species [38].
Estimates of root biomass at the ecosystem scale do not in-
corporate the variance due to regression. Therefore, the stan-
dard deviation and confidence intervals are larger than
reported here. Using the measured and predicted biomass for
the remaining 21 quadrats, average root biomass was statisti-
cally different among locations (P = 0.014). The NW location
had smaller root biomass (19.82 ± 3.72 Mg ha
–1
) than the
SC location (32.48 ± 6.80 Mg ha
–1
). The other two locations
had similar root biomass (SM1 = 27.91 ± 6.25 Mg ha
–1
and
SM2 = 29.02 ± 2.95 Mg ha
–1
) than the NW and SC locations.
Weighted root biomass by distribution area of the subtropical
and semiarid Tamulipan thornscrub is 23.56 ± 4.25 Mg ha
–1
.
Using the weighted biomass averages by area of distribution
of the Tamaulipan thornscrub, root biomass represented 39%
of the total biomass measured. Branches composed 40%,
leaves 4%, and stems only 16% of the total biomass. Thus, to
-
tal standing biomass ranged from 59.83 in the NW to
83.37 Mg ha
–1
in the SC location, with a weighted average of
60.31 ± 12.24 Mg ha
–1
. Therefore, biomass carbon averages
30.15 ± 6.12 Mg ha
–1
by assuming a carbon/biomass factor
of 0.50 [24]. Considering the total area covered by the
Tamaulipan thornscrub of northeastern Mexico, total carbon
stored in standing biomass in this plant community is
0.097 ± 0.020 Pg C. Because land-use change, mainly caused
by shifting cultivation, has reduced dramatically the size of
this ecosystem [22, 32, 37], a large amount of carbon has
been released to the atmosphere from deforestation practices
in this ecosystem. Quantification of this flux is important to
climate change.
3.3. Total biomass
Observed and estimated total biomass for equations using
stand attributes, shrub and species attributes, and shrub at
-
tributes are reported in table III. Average observed minus es
-
timated biomass did not differ by more than 17%
(7.82 Mg ha
–1
) for any of the additive procedures used. Addi
-
tive equations using stand attributes biased mean total bio
-
mass by an average 1.4% (0.63 Mg ha
–1
), equations for
individual species biased mean total biomass on the average
by 4.4% (1.98 Mg ha
–1
), and equations for all species biased
mean total biomass on the average by 8.1% (4.5 Mg ha
–1
).
For the equation with stand attributes, additive procedure Sur
(2) had the least biased total biomass estimates (0.5%) in con
-
trast to procedure (1) (1.9%). In particular the SurLin equa
-
tion recorded the least bias (0%). The linear equations
(MSLin, CovLin, and SurLin) resulted in unbiased average
biomass estimates unlike the log transformed equations
(MSLog, CovLog, and SurLog) whose average biomass esti
-
mates were biased by less than 2.9% (1.3 Mg ha
–1
) for all
three types of equations.
818 J. Návar et al.
Table III. Total aboveground biomass estimates for 56 quadrats us-
ing three regression approaches: (1) by using stand attributes, (2) by
using single tree and species attributes, and (3) by using single tree at-
tributes regardless of the species.
Scale/Equation Statistical Parameters (Mg ha
–1
)
Mean Standard Deviation Confidence Intervals (
1–α=0.05
)
1/MSLog 42.67ª 12.77 ±3.38
1/MSLin 44.40ª 13.03 ±3.44
1/CovLog 42.78ª 13.18 ±3.48
1/CovLin 44.40ª 12.83 ±3.39
1/SurLog 43.95ª 11.69 ±3.09
1/SurLin 44.41ª 12.92 ±3.42
2/MSLog 39.29ª 15.31 ±4.05
2/MSLin 43.46ª 15.72 ±4.16
2/CovLog 42.56ª 14.13 ±3.73
2/CovLin 43.53ª 15.73 ±4.16
2/SurLog 42.77ª 13.10 ±3.46
2/SurLin 42.93ª 15.49 ±4.09
3/MSLog 36.58
b
12.32 ±3.26
3/MSLin 42.52ª 14.20 ±3.75
3/CovLog 37.37
b
13.68 ±3.62
3/CovLin 42.56ª 14.13 ±3.73
3/SurLog 45.54ª 15.07 ±3.98
3/SurLin 42.52ª 14.19 ±3.75
1/ = Quadrat attributes, 2/ 17 = equations for each species, 3/ = one equation for all species,
Q = quadrat, O = observed average biomass (Mg ha
–1
), A = MSLog equation, B = MSLin
equation, C = CovLog equation, D = CovLin equation, E = SurLog equation,F=SurLin
equation,
$
y
= mean, α = error, CI = Confidence Intervals (α = 0.05). Means with the same
letter are not statistically different (α = 0.05).
Figure 2. The relationship between stand root and total stand above
-
ground biomass for 34 quadrats located across the Tamaulipan
thornscrub of northeastern Mexico.
3.4. Efficiency in biomass estimates when using
equations with average stand attributes
The goodness-of-fit statistics for three approaches of esti
-
mating aboveground stand biomass are reported in table IV.
Equations, procedures, and scales recorded different coeffi
-
cient values. Procedure (1) recorded the highest efficiency in
total biomass estimates by 4%. In particular, the average sta-
tistics varied by 3%, 2%, 4%, 1%, and 8% for the r
2
, Sx, CV,
S(%), and Pe values, respectively. The linear covariance
equation (CovLin) increased efficiency in total biomass esti-
mates by 6% in contrast to the other equations tested. The r
2
increased by 6%, the Sx was reduced by 8%, the CV was re-
duced by 7%, the S(%) was reduced by 1%, and the Pe was re-
duced by 4% when using CovLin in contrast to the other
additive equations. When contrasting all goodness of fit sta-
tistics, the CovLin equation increased efficiency by 7%, 5%,
6%, 7%, and 5% in contrast to the MSLog, MSLin, CovLog,
SurLog, and SurLin, respectively. The SurLin and MSLin
had compatible goodness of fit statistics and ranked second in
efficiency.
The efficiency increases by 19% when using 17 equations
to predict total biomass at the stand scale in contrast to the
other two scales (16% when using equations at the stand
scale, and 22% when using a single equation for all species).
Using one allometric equation to predict quadrat biomass
provides lower efficiency (10%) than using one equation that
uses per ha attributes. When contrasting these two last scales,
the log-transformed equations (MSLog, CovLog, and
SurLog) provided higher efficiencies (25%) in the equation
developed at the quadrat scale. On the other hand, the linear
equations lost only 4% in efficiency in the equation that uses
quadrat attributes in contrast to the equation that uses one sin
-
gle allometric equation. When contrasting equations among
different scales, the SurLin equation had one of the highest
efficiencies with compatible goodness of fit statistics in the
equations developed with stand attributes and a single equa
-
tion for all species. Consistently CovLin recorded slightly
higher goodness of fit statistics in all three scales tested. The
SurLin equation that uses 17 equations predicted total
quadrat aboveground biomass with the largest efficiency. In
general it increased efficiency estimates by 50% and 40% rel
-
ative to the SurLin equations developed for quadrat attributes
and for all species, respectively. The equation developed in
this report that uses quadrat attributes slightly reduces effi
-
ciency in biomass estimates relative to the single SUR equa
-
tion for all species by 6%. That is, the equations that use stand
attributes predicted aboveground biomass within the range of
observed reliability by using the conventional procedures of
biomass inventory.
Additive equations developed using quadrat attributes
ease problems of statistical dependencies between biomass
components because the coefficients of correlation between
leaf and stem biomass were not statistically related (r = 0.08,
P = 0.90). At the quadrat scale, the correlations between leaf
and branch (r = 0.52) and branch and stem (r = 0.42) biomass
were statistically significant, but the r-value decreased rela
-
tive to the r-value developed for biomass components within
(average r-values from each species) and across species (for
all species).
The SUR procedures developed at the quadrat scale also
meets the characteristics of biomass properties; i.e. total bio
-
mass is divided into smaller compartments (bolewood, root,
leaf, etc.) and bolewood is divided into smaller compartments
(bark, wood, branch, etc.). Therefore, the advantages of using
additive equations fitted by SUR to estimate biomass compo
-
nents and total biomass include (a) prediction for the compo
-
nents sum to the prediction for the total quadrat, (b) the
coefficients are more efficient, and (c) no single biomass
compartment has values greater than the total biomass [7,
31]. In addition, there is an increasing need for estimating
biomass compartments at the stand scale for environmen
-
tal-related issues, productivity, and economic values. Several
models, e.g., CO
2
fix, requires estimates of the relative bio
-
mass proportions of leaves, branches, and stems. Natural re
-
source managers require precise and consistent estimates of
biomass components such as fuelwood, palatable biomass,
pulp and paper biomass. The SUR equations developed at the
quadrat scale for estimating each of the biomass components
Stand biomass in Tamaulipan thornscrub of northeastern Mexico 819
Table IV. Goodness of fit parameters for biomass estimates in 55 quadrats with equations for each species, groups of species, and all species in
two additive procedures of five different forms.
Statistic
Additive Equations to Estimate Biomass Components
Equation with Stand Attributes 17 Equations for each species One Equation for all shrub species
ABCDEFABCDEFABCDEF
R2 57 61 59 63 56 60 70 84 60 84 38 83 39 59 44 60 35 60
Sx 12 12 12 11 12 12 10 7 11 7 14 7 14 11 13 11 14 11
CV 27 27 27 25 28 27 22 16 25 16 31 16 31 25 29 25 32 25
S(%) 18 17 18 18 18 18 19 12 16 13 23 13 25 16 26 16 23 16
Pe 39 43 40 43 45 44 46 29 41 31 48 31 63 42 63 41 50 41
R
2
= Coefficient of determination (%), Sx = standard error (Mg ha
–1
), CV = coefficient of variation (%), S(%) = mean percent error (%), Pe = percent error (%), A = MSLog equation,
B = MSLin equation, C = CovLog equation, D = CovLin equation, E = SurLog equation, F = SurLin equation.
use only 14 parameters (2 for leaf, 8 for branch and 4 for
stem). The SUR equation developed for all species uses
18 coefficients and the SUR equations for each species taken
together use an average of 50 coefficients to estimate total
biomass for each quadrat. An advantage of SUR is that it al
-
lows for the use of different component equation forms [31].
It is the most difficult additivity method to be calculated in
this analysis, and predictions beyond the stand characteristics
used to estimate parameters are uncertain [7], as is the case
for any allometric equation.
The covariance regression equation, CovLin, applied in
this research is an improvement of the harmonization proce
-
dure proposed by Cunia and Briggs [9]. This procedure uses a
single best equation for each biomass component, all vari
-
ables are statistically significant, and statistical coefficients
behave harmoniously since they are estimated from the same
pool of data. The disadvantages of this equation are that it
does not account for dependencies of biomass components
and that, for the smallest biomass components, it does not
provide reliable estimates (i.e., leaf biomass).
The additive procedure (2), using the syslin procedure of
parameter estimation in SAS is recommended to estimate
biomass components and total biomass at the per ha scale for
shrub species typical of the Tamaulipan thornscrub of north-
eastern Mexico. The SurLin equation that uses stand attrib-
utes on a per ha basis developed in this report included the
independent variables stand density, N, average top height,
H, species richness, S, D
2
H, and the log transformations of
D
2
H, N, and basal area (BA). The SurLin equations that esti-
mate per ha aerial biomass components are:
y
leaf
= –3.39 – 0.3170H + 0.00033N – 0.11290S
+ 1.2015ln(D
2
H)
y
branch
= 1.46 + 0.00403N – 1.39287S + 0.08707 D
2
H
y
stem
= 246.99 + 11.9170H – 32.8904ln(D
2
H) – 25.2786ln(N)
+ 37.7530ln(BA).
The summation of all components equals total aboveground
biomass per ha, and the total aboveground biomass equation,
derived from linear restrictions on the coefficients, can be ex
-
pressed as:
y
total
= 245.06 +11.6H + 0.00436N – 1.50577S
– 31.6889ln(D
2
H) + 0.08707D
2
H – 25.2786 ln(N)
+ 37.7530 ln(BA).
The number of species can be considered a means of account
-
ing for the diversity of life forms, wood densities, and other
important aspects of productivity of the Tamaulipan
thornscrub ecosystem. The equations provided here can be
applied to quadrat characteristics expressed on a per area ba
-
sis reported in table II. Should this set of equations be tested
in quadrats of different shrub sizes or different quadrat scales,
several sources of error must be considered. These potential
sources are (a) the component due to the random selection of
the sample unit and (b) the error of the biomass regression.
Woods et al. [41] and Parresol [31] pointed out that the
former is a function of the sampling design, the sample size,
the type of estimator used, and the inherent variation between
the sample units.
4. CONCLUSIONS
In this report, we observed that the equations developed
using the seemingly unrelated linear regression procedure by
employing quadrat attributes, predicts total biomass within
the range of reliability of other conventional additive proce
-
dures developed for single shrub species. Therefore, this set
of equations is recommended to estimate biomass compo
-
nents and total biomass on a per hectare basis. This informa
-
tion is critical for sustainable management of the Tamaulipan
thornscrub of northeastern Mexico.
Acknowledgments: The CONACyT (Mexican Foundation for
Science and Technology), IFS (International Foundation for Sci
-
ence) and PAICyT (UANL Fund for Science and Technology) par
-
tially funded this research through grants 28536-B, D/2535-1, and
CT203– 99, respectively. Dr. Tristam West is recognized by his
comments to improve the final manuscript. This report was written
during a sabbatical leave at the Environmental Sciences Division of
the Oak Ridge National Laboratory. Oak Ridge National Laboratory
is managed by UT-Battelle, LLC, for the U.S. Department of Energy
under contract DE-AC05-00OR22725.
REFERENCES
[1] Aranda R., Zamarripa R., Rojas L., Navarro J., Návar J., Ordenamien-
to hidrológico de la cuenca del río San Juan, in: Ninth US/Mexico Border Sta
-
tes Conference on Recreation, Parks, Wildlife. USDA For. Ser. RMRS-P5.
Tucson, Arizona, 1998.
[2] Brown S., Los bosques y el cambio climatico: el papel de los terrenos
forestales como sumideros de carbono, in: Actas del XI Congreso Mundial Fo
-
restal: Recursos Forestales y Arboles. Vol 1. Antalya Turkia, October 13–22,
1997.
[3] Brown S., Gillespie A.J., Lugo A.E., Biomass estimation methods for
tropical forests with aplications to forest inventory data, For. Sci. 35 (1989)
881–902.
[4] Carstens A., Gottinger Beitrage zur Land – und Forstwirtschaft in der
Tropen and Subtropen. Heft 40. University of Gottingen. Gottingen, Germany,
1987.
[5] Clutter J.L., Forston J.C., Pienaar L.V., Brister G.H., Bailey R.L.,
Timber management: A quantitative approach, Wiley, New York, 1983,
333 p.
[6] Cotecoca-Sarh (Comisión Técnico Consultiva para la Determinación
de los Coeficientes de Agostadero – Secretaría de Agricultura y Recursos
Hidráulicos), 1973, Coeficientes de agostadero de la República Mexicana,
Edo. de N. L. México. D.F.
[7] Cunia T., Briggs R.D., Forcing additivity of biomass tables – some
empirical results, Can. J. For. Res. 14 (1984) 376–384.
[8] Cunia T., Briggs R.D., Forcing additivity of biomass tables – use of
the generalized least-square method, Can. J. For. Res. 15 (1985) 23–28.
[9] Cunia T., Briggs R.D., Harmonizing biomass tables by generalized
least squares, Can. J. For. Res. 15 (1985) 331–340.
[10] Diamond D., Riskind D., Orzell S., A framework for plant communi
-
ty classification and conservation in Texas at Dallas, Tex. J. Sci. 39 (1987)
203–221.
820 J. Návar et al.
[11] Fang J.Y., Wang G.G., Liu G.H., Xu S.L., Forest biomass of China:
an estimate based on the biomass-volume relationship, Ecol. Appl. 8 (1998)
1084–1091.
[12] Frandsen W.H., Modelling big sagebrush as a fuell, J. Range
Manage. 36 (1983) 596–600.
[13] González M., El límite sur de la Provincia Biótica Tamaulipeca. II
Simposio Internacional sobre la Provincia Biótica Tamaulipeca UAT-UNAM,
1985, 7 p.
[14] Green E.J., Reed D.D., Compatible tree volume and taper equations
for pitch pine, North. J. Appl. For. 2 (1985) 14–16.
[15] Harniss R.O., Murray R.B., Reducing bias in dry leaf weight estima
-
tes of big sagebrush, J. Range Manage. 29 (1976) 430–432.
[16] Heiseke D., El matorral como recurso forestal. Reporte científico
Número 1. Facultad de Ciencias Forestales UANL, Linares, N.L., Mexico,
1985, 31 p.
[17] Heiseke D., Foroughbackch R., El matorral como recurso forestal.
Reporte científico Número 1. Facultad de Ciencias Forestales UANL, Linares,
N.L., Mexico, 1985, 31 p.
[18] Hoffmann C.W., Usoltsev V.A., Modelling root biomass distribution
in Pinus sylvestris forests of the Turgai Depression of Kazakstan, For. Ecol.
Manage. 149 (2001) 103–114.
[19] Houghton R.A., Tropical deforestation and carbon dioxide, Climate
Change 19 (1991) 99–118.
[20] Jenkins J.C., Birdsey R.A., Pan Y., Biomass and NPP estimation for
the mid-atlantic region (USA) using plot-level forest inventory data, Ecol.
Appl. 11 (2001) 1174–1193.
[21] Laiho R., Laine J., Tree stand biomass and carbon content in an age
sequence of drained pine mires in southern Finland, For. Ecol. Manage. 93
(1997) 161–169.
[22] Maldonado A., Desertificación en la subcuenca del Rio Limon, Lina-
res, N.L. Tesis Profesional de Licenciatura. Facultad de Ciencias Forestales,
UANL. Linares, N.L., Mexico, 1992.
[23] Manzano M.G., Návar J., Processes of desertification by goats over-
grazing in the tamaulipan thornscrub (matorral) in north-eastern Mexico,
J. Arid Environ. 44 (2000) 1–17.
[24] Mery G., Kanninen M., Las plantaciones forestales y el secuestro de
carbono en Chile. Primer Congreso Latinoamericano IUFRO Valdivia Chile,
1998, 14 p.
[25] Návar J., Cavazos T., Domínguez P.A., Los balances hidrológicos
mensuales con tres probabilidades de precipitación en el Estado de Nuevo
León. Actas de la Facultad de Ciencias de la Tierra, NANL. Linares, N.L.,
México, 1994.
[26] Návar J., Agua y desarrollo sustentable en la cuenca baja de los ríos
Bravo y San Juan, Ciencia UANL 2 (1999) 356–362.
[27] Návar J., Synnott T.J., Soil erosion and land use in northeastern
Mexico, Terra 18 (2001) 247–253.
[28] Návar J., Nájera A., Jurado E., Dominguez P.A., Biomass estimation
equations in the Tamaulipan thornscrub of northeastern Mexico, J. Arid Envi
-
ron. (to appear).
[29] Návar J., Méndez E., Graciano J., Dale V., Parresol B., Biomass
equations for shrub species of Tamaulipan thornscrub of northeastern Mexico,
Can. J. For. Res. (to appear).
[30] Palacios-Prieto E., La condición actual de los recursos forestales en
Mexico. Resultados del Inventarion Nacional Forestal 2000, Investigaciones
Geograficas 43 (2000) 183–203.
[31] Parresol B., Assessing tree and stand biomass: a review with exam
-
ples and critical comparisons, For. Sci. 45 (1999) 573–593.
[32] Proderleon, Promotora del Desarrollo Rural de Nuevo Leon. Estadis
-
ticas de cambio de uso de suelo 1980–1986. Gobierno del Estado de Nuevo
Leon. Monterrey, N.L., Mexico, 1992.
[33] Ranger J., Gelhaye D., Belowground biomass and nutrient content in
a 47-year-old Douglas-fir plantation, Ann. For. Sci. 58 (2001) 423–430.
[34] Reid N., Smith D.M.S., Marroquin J., Beyer-Munzel P., Floristic
and structural variation in the Tamaulipan thornscrub, northeastern Mexico, J.
Veg. Sci. 1 (1990) 529–538.
[35] Reid N., Marroquin J., Beyer-Munzel P., Utilization of shrubs and
trees for browse, fuelwood and timber in the Tamaulipan thornscrub, northeas
-
tern México, For. Ecol. Manage. 36 (1990) 61–79.
[36] Romero F.G., Caracterización ecológica y definición de esquemas de
muestreo en el matorral espinoso tamaulipeco del nordeste de México. Tesis
Profesional de Maestría en Ciencias. Facultad de Ciencias Forestales, UANL,
Linares, N.L., Mexico, 1999.
[37] Treviño E., Akca A., Návar J., Jimenez J., Aguirre O., Detection of
land use change by satellite imagery in the municipality of Linares, Nuevo
Leon, Mexico. Proceedings of the Fifth International Conference on Desert
Development, August 12–17, 1996. Vol I. Texas Tech University, 1997.
[38] Vinas I.C.R., Ayanz A.S.M., Biomass of root and shoot systems of
Quercus coccifera shrublands in eastern Spain, Ann. For. Sci. 57 (2000)
803–810.
[39] Vogt K.A, Vogt D.J., Bloomfield J., Analysis of some direct and
indirect methods for estimating root biomass and production of forests at an
ecosystem level, Plant Soil 200 (1998) 71–89.
[40] Wang J.R., Letchford T., Comeau P., Kimmins J.P., Above and
below ground biomass and nutrient distribution of a paper birch and subalpine
fir mixed-species stand in the sub-boreal spruce zone of British Columbia, For.
Ecol. Manage. 130 (2000) 17–26.
[41] Woods K.D., Feiveson A.H., Botkin D.B., Statistical analysis for
biomass density and leaf-area index estimation, Can. J. For. Res. 21 (1991)
974–989.
Stand biomass in Tamaulipan thornscrub of northeastern Mexico 821