Báo cáo khoa học: "Origin identification of maritime pine stands in France using chloroplast simple-sequence repeats" potx
Bạn đang xem bản rút gọn của tài liệu. Xem và tải ngay bản đầy đủ của tài liệu tại đây (371.26 KB, 10 trang )
M.M Ribeiro, G. LeProvost et al.Origin identification of P. pinaster stands using cpSSR
Original article
Origin identification of maritime pine stands in France
using chloroplast simple-sequence repeats
Maria Margarida Ribeiro
a,**
, Grégoire LeProvost
b,**
, Sophie Gerber
b
,
Giovanni Guiseppe Vendramin
c
, Maria Anzidei
c
, Stéphane Decroocq
b
, Anne Marpeau
d
,
Stéphanie Mariette
b
and Christophe Plomion
b,*
a
Department of Forest Genetics and Plant Physiology, SLU, 901 83 Umeå, Sweden
b
INRA, Équipe de Génétique et Amélioration des Arbres Forestiers, BP 45, 33610 Cestas, France
c
Istituto Miglioramento Genetico Piante Forestali, CNR, Via Atto Vannucci 13, 50134 Firenze, Italy
d
Laboratoire de Chimie des Substances Végétales, Institut du Pin, Université de Bordeaux 1, 351 cours de la libération,
33405 Talence Cedex, France
(Received 20 October 2000; accepted 28 February 2001)
Abstract – Maritime pine seed-lots from north-western Iberian regions (Portugal and Galicia) were introduced in the 1950s to the south-
west of France (Aquitaine region), and the stands they formed suffered considerable frost damage. In the mid 1980s, a biochemical test
was developed to test the putative origin of adult stands in Aquitaine, before seeds could be distributed for commercial purposes in
France. In this paper, we describeanewtestemployingchloroplastsimple-sequencerepeats (cpSSRs) to facilitate identification ofstand
origin based on randomisation tests. The origin of five stands of unknown origin was determined with both the cpSSR and biochemical
(terpene profile analysis) tests. The resultsfrom thetwo tests were concordant, but the DNA-based test gave faster andmore accurate re-
sults. Use of this test should help when determining the origin of maritime pine stands in the Aquitaine region of France.
cpSSR / microsatellites / terpene / origin identification / Pinus pinaster
Résumé – Identification de l’origine géographique des peuplements de pin maritime en France à l’aidede microsatellites chloro-
plastiques. Des lots de graines du nord ouest de la péninsule ibérique (Portugal et Galice) ont été introduits dans les années 1950 dans le
sud-ouest de la France (Aquitaine), et les peuplements issus de ces graines ont fortement souffert des gelées. Un test variétal basé sur les
marqueurs terpéniques fut développé dans les années 1980 afin d’identifier l’origine géographique des peuplements adultes en Aqui-
taine sur lesquels des graines étaient récoltées puis commercialisées. Dans cet article nous décrivons un nouveau test qui utilise des mar-
queurs microsatellites chloroplastiques (cpSSRs) et simulations pour identifier l’origine des peuplements. Une étude comparative des
tests biochimique (terpènes) etcpSSR a été menée sur cinq peuplementsadultes. Les résultats obtenus sont identiques, mais le test ADN
s’est avéré plus rapide et plus précis. L’utilisation de ce nouveau test devrait permettre de garantir l’origine géographique des peuple-
ments de pin maritime du sud-ouest de la France (Aquitaine).
cpSSR / microsatellites / terpène / test variétal / Pinus pinaster
Ann. For. Sci. 59 (2002) 53–62
53
© INRA, EDP Sciences, 2002
DOI: 10.1051/forest: 2001005
* Correspondence and reprints
Tel.: +33 5 57 97 90 76; Fax: +33 5 57 97 90 88; e-mail:
** To be considered as joint first authors.
1. INTRODUCTION
Pinus pinaster is an important species in France occu-
pying 1.4 M ha, representing 12% of the French forest
area. Seeds of this species from northwestern (NW) Ibe-
rian origins (Portugal and Galicia) were introduced in the
1950s to the southwest of France (the Aquitaine region)
for reforestation, since large areas of forest were burned,
during and after the 2nd World War (in 1943 and 1949).
Unfortunately, the standsproved to be frost-sensitive,es-
pecially during the exceptionally cold winter of 1985 in
Aquitaine, when the temperature dropped to –22
o
C.
Damage caused by frost affected about 30,000 ha of
P. pinaster stands, and financial losses were consider-
able [6]. To overcome this problem and to avoid further
damage, from 1986 onwards candidate stands for seed
collection in the Aquitaine region had to be certified for
their French origin. A diagnostic test based on a
discriminant analysis of terpenes was developed by
Baradat and Marpeau-Bezard [4]. This test has been rou-
tinely used to identify the origin of adult stands, by com-
paring their terpene profile with the profiles given by
stands of known origin.
The human impact on forest species may have a nega-
tive effect in the long run, especially in the case of intro-
duced seed material. Stands from non-indigenous origin
may prove to be poorly adapted to the area,particularly if
the reproductive plant material is introduced from re-
gions with very different environmental conditions, and
they may also influence adjacent native stands by pollen
and seed dissemination. The establishment of forest
plantations throughout the world demands increasing
amounts of seed annually. Seeds are often transferred be-
tween countries, or between areas within countries, ac-
companied by inadequate information about their source
and history. Therefore, reproductive material identifica-
tion and certification has been an important issue in re-
cent decades [16, 21].
Morphological data and biochemical markers
(terpenes, isozymes and denatured proteins) have all
been used for provenance identification and seed certifi-
cation in forest trees(e.g. [2, 6, 11, 12]).Molecular mark-
ers based on nuclear and organelle DNA analysis have
also been used recently for this purpose (e.g. [1, 7, 30,
33]).
The terpene method used for plant material certifica-
tion has several constraints, such as the restricted type
of plant material that can be used (cortex of completely
lignified young shoots), the age of the tree for material
collection (7–10 years minimum), and the limited time
that the material can be stored (eight days). In addition,
for financial reasons, the terpene test uses bulk samples
of tissues, instead of an individual analysis of each
sample [3].
The use of DNA has several advantages over terpene
analysis, because it is relatively stable, ubiquitous and
convenient to analyze. DNA is present in nearly all tis-
sues and it can be extracted using any sample taken from
the plant. Plant material can be easily stored for DNA
analysis under field and laboratory conditions, and only
few nanograms of DNA are needed [23]. Therefore, the
use of DNA markers for assessing the origin of maritime
pine stands may provide an attractive alternative to other
markers.
The level at which the identification is to be done is a
very important factor in the choice of the marker. In our
case, the aim was to identify populations of a species
(P. pinaster) at the provenance level (NW Iberian vs.
Aquitaine). The use of an appropriate genetic marker is
also of great importance in order to maximize accuracy
and to save time. For our study, a marker capable of
clearly discriminating between provenances was re-
quired. In plants, chloroplast microsatellite regions are
highly polymorphic, and they have already proved to be
useful for genetic fingerprinting in different pine species
(Lefort et al. [17] and references therein). Moreover, the
chloroplast genome is haploid, it does not undergo re-
combination and it is usuallypaternally inherited inconi-
fers (e.g. [8, 22, 31, 32, 36]).
In the present study we have used six chloroplast
microsatellites to investigate the haplotypic composition
of two populations from Spain (Galicia) and 15 popula-
tions from France. In addition, data from 12 P. pinaster
populations from Portugal for the same cpSSR loci were
included [28]. The aims of this study were to construct
and optimize a cpSSR-based test in order to determine
the putative origin of maritime pine forest stands in
Aquitaine, and to compare the cpSSR-based test with the
test based on terpene profile analysis [4].
2. MATERIALS AND METHODS
2.1. Plant material
2.1.1. Reference populations
The plant material presented in table I was used as
NW Iberian and French reference populations. The NW
54 M.M Ribeiro, G. LeProvost et al.
Iberian reference material included 303 samples:
235 trees from 12 Portuguese populations (coded A-N),
and 68 individuals obtained from a bulk seed-lot col-
lected in two localities in the Galicia region of Spain
(CARB and PUEN). The French reference material in-
cluded 450 samples from Aquitaine: 371 trees collected
from 13 natural populations (coded 1-13) along the At-
lantic coast, 45 individuals obtained from a bulk seed-lot
from four different populations (CEMA), and 34 “plus
trees” representing the breeding population (VEC) in
France.
2.1.2. Tested stands
Five adult stands of unknown origin were sampled in
the Aquitaine region. Completely lignified young shoots
were collected from 120 randomly chosen trees in each
stand to perform the terpene analysis, but a different set
of 30 was used for each repeated analysis. For the cpSSR
analysis, needles from 30 trees per stand among the pre-
viously collected material were used.
2.2. CpSSR and terpene analysis
Total DNA was extracted according to the Doyle and
Doyle [10] protocol with modifications described by
Lerceteau and Szmidt [18] and Plomion et al. [25]. The
number of individuals used per population and the type
of material used for DNAextractionareshownin table I.
In this study, a maximum of six primers flanking pine
chloroplast microsatellites were used; Pt1254, Pt15169,
Pt30204, Pt36480, Pt71936 and Pt87268, designed ac-
cording to sequences in the P. thunbergii chloroplast ge-
nome [35]. These primers were chosen since they
detected a relatively high level of polymorphism in an
analysis of a sub-sample of individuals.
Polymerase chain reaction (PCR) and electrophoresis
were performed according to the protocol described for
P. pinaster by Ribeiro et al. [28]. The presence of the
PCR fragments was visually scored with the help of frag-
ment size standards. To confirm the accuracy of the vi-
sual reading and to evaluate the size of the alleles, two
samples of 21 and 34 individuals from the Portuguese
and French populations, respectively, containing all the
alleles found with the six primers were used. The size of
the amplified fragments from these two samples was
evaluated according to Vendramin et al. [34].
Terpene compounds were extracted from oleoresin
obtained from the top-shoot corticaltissuesof30 individ-
ual trees from each of the five stands of unknown origin.
The bulk-sample analysis was performed using gas chro-
matography according to the method described by
Baradat and Marpeau-Bezard [4]. Whenever the results
obtained were inconclusive, the test was repeated up to
four times, using further bulk-samples of the same size.
2.3. Differentiation statistics
In this study,for ease of presentation, the term “locus”
will refer to a cpSSR site and “allele” will refer to a size
variant at a given cpSSR site. Since the chloroplast ge-
nome is haploid and does not undergo recombination, the
detected alleles at each locus were combined in order to
derive the chloroplast haplotype of each individual.
The total among-population differentiation based on
haplotype frequencies at the six cpSSR loci (using n
1
in
table I, except CEMA and VEC) were computed for the
12 French and 12 Portuguese populations grouped to-
gether. The population differentiation among the French
and Portuguese groups of populations, taken separately,
was also determined (n
1
in table I, except CEMA and
VEC). The genetic differentiation among populations
was assessed by calculating θ, following Weir and
Cockerham [37]. The infinite allele mutation model was
preferred to the stepwise-mutation model because, in
general, the θ-based estimates perform better when sam-
ples sizes aremoderate or small and thenumber of scored
loci is low [13]. The pairwise population differentiation,
French against Portuguese (populations confounded)
was also tested. FSTAT, a program for estimating and
testing gene diversities (Goudet 2000, version 2.9.1), up-
dated from Goudet [14] was used to obtain the genetic
differentiation estimates and its variances, and to test the
pairwise population differentiation.
2.4. Two-step cpSSR screening
Two steps were performed in the development of the
cpSSR test for identifying stand origin. In the first, the
Portuguese individuals and the n
1
individuals (table I)of
the French populations were analyzed at the six cpSSR
loci. The aim was to identify the loci that could best dif-
ferentiate between the Portuguese and the French prove-
nances.
Since nothing was known a priori about the expected
distributions of thestatistic described by formula(1), and
because most of the haplotypes were represented by a
small number of individuals (so the haplotype frequen-
cies were subject to a rather large sampling error) [9, 19],
Origin identification of P. pinaster stands using cpSSR 55
simulations had to be performed. The following formula
was used to obtain the distribution of the null (H
0
: “the
tested stand is of French origin”) and the alternative hy-
potheses (H
1
: “the tested stand belongs to the Portuguese
provenance”):
Sxx
jiij
i
n
=
=
∑
(–)
F
2
1
(1)
where n is the total number of different haplotypes found
in both provenances, x
iF
is the frequency of the ith
haplotype in the French provenance and x
ij
is the fre-
quency of the ith haplotype in a sample from the French
(to obtain H
0
) or the Portuguese provenance (to obtain
H
1
) under the jth outcome. Resampling with replacement
was performed 10,000 times (j = 1 to 10,000), and the
56 M.M Ribeiro, G. LeProvost et al.
Table I. Plant material used in the study.
Origin Code n
1
b
n
2
c
Region Alt (m) Latitude Long. M
d
Portugal A
a
20 20 Aveiro 30 40
o
39’ N 8
o
36’ W A
Portugal B
a
20 20 Oleiros 750 39
o
55’ N 7
o
50’ W A
Portugal C
a
19 19 Alcácer do Sal 20 37
o
52’ N 8
o
30’ W A
Portugal D
a
20 20 Bragana 800 41
o
52’ N 6
o
32’ W A
Portugal E
a
20 20 Figueira da Foz 30 40
o
18’ N 8
o
44’ W A
Portugal F
a
19 19 Lousã 250 40
o
09’ N 8
o
11’ W A
Portugal G
a
19 19 Monção 310 42
o
04’ N 8
o
23’ W A
Portugal H
a
20 20 Mondim de Basto 480 41
o
25’ N 7
o
55’ W A
Portugal J
a
20 20 Leiria 50 39
o
46’ N 8
o
57’ W A
Portugal L
a
20 20 Manteigas 625 40
o
24’ N 7
o
26’ W A
Portugal M
a
20 20 Montalegre 690 41
o
49’ N 7
o
56’ W A
Portugal N
a
18 18 Sintra 250 38
o
46’ N 9
o
22’ W A
Spain CARB 0 46 Carballo 130 43
o
13’ N 8
o
41’ W B
Spain PUEN 0 22 Ponteareas 100 42
o
10’ N 8
o
30’ W B
France 1 13 28 Lit-et-Mixe 30–40 44
o
03’ N 1
o
19’ W A
France 2 11 30 St-Julien-en-Born 20 44
o
06’ N 1
o
19’ W A
France 3 12 29 Boul. Allemands 20 44
o
05’ N 1
o
19’ W A
France 4 12 30 Ste-Eulalie 40–50 44
o
20’ N 1
o
14’ W A
France 5 12 27 Mimizan 35–40 44
o
08’ N 1
o
18’ W A
France 6 13 30 Vielle St-Girons 35 43
o
56’ N 1
o
28’ W A
France 7 8 29 Biscarosse 25–60 44
o
20’ N 1
o
13’ W A
France 8 0 18 Biscarosse 30 44
o
33’ N 1
o
11’ W A
France 9 13 32 Lège 15 44
o
43’ N 1
o
12’ W A
France 10 10 25 Lacanau 10–15 45
o
02’ N 1
o
09’ W A
France 11 12 31 Pointe de Grave 10–15 45
o
34’ N 1
o
04’ W A
France 12 12 31 Carcans 10–15 45
o
06’ N 1
o
09’ W A
France 13 11 31 Hourtin 25–45 45
o
10’ N 1
o
08’ W A
France VEC 34 34 “plus”trees 10–50 Aquitaine A
France CEMA 45 45 Medoc 10–15 Medoc B
a
: Group of populations previously analyzed in [28].
b
: Number of individuals screened at six cpSSR loci.
c
: Number of individuals screened at two cpSSR loci.
d
: Type of plant material used for DNA extraction: A, needles and B, germinated embryos.
sample size was 30. The density functions, locus by lo-
cus, were obtained from the 10,000 S
j
values. Random
numbers were generated according to the method of
Knuth proposed by Press et al. [27]
In the secondstep, individuals from theFrench, Portu-
guese and Spanish populations (n
2
in table I) were ana-
lyzed at the two most informative loci revealed in the
first step. The complete set of data from the haplotypes
derived from the two selected loci and formula (1) were
used to obtain the density functions for each reference
population, based on the 10,000 S
j
values. The tested
sample size was N (N = 20, 30, 40 or 50).
2.5. Testing the stands of unknown origin
In this study, for an indigenous stand the origin is the
place in which thetreesare growing and for anon-indige-
nous stand the origin is the place from which the seeds or
plants were originally introduced [16].
The haplotypes of 30 individuals from each one of the
five stands (designated λ1–λ5) of unknown origin were
recorded at thetwo selected loci. A statistic,S
, was com-
puted for each λ stand (1 to 5), to determine the degree of
similarity between a stand of unknown origin and the
French provenance. The formula used was as follows:
Sxx
i
i
i
n
λλ
=
=
∑
(–)
F
2
1
(2)
where n is the total number of different haplotypes found
both in the French reference population and in the λ
stand, x
iF
is the frequency of the ith haplotype in the
French reference population and x
i
is the frequency of
the ith haplotype in the λ stand.
The critical value S
c
was chosen in order to keep
β = 1%. It was considered of less importance to reject a
stand of French origin when it was of French origin (type
I error) than itwasto accept a stand asbeing of French or-
igin when it was not. The probability of accepting the
null hypothesis when it was false (type II error) was kept
Origin identification of P. pinaster stands using cpSSR 57
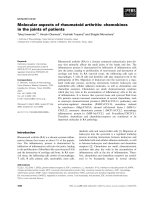
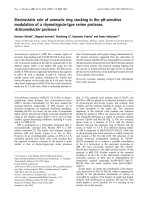
Figure 1. Density functions for the Portuguese and French reference populations (solid and dotted lines, respectively) for each locus.
The data points were obtained after 10,000 simulations.
equal to 1%, since it was highly desirable to reject all
the stands of probable NW Iberian origin. Whenever the
value of the S statistic was found to be smaller than
the critical value, S
c
, the stand was assumed to be of
French origin.
3. RESULTS
3.1. Characterisation of the cpSSR loci
and population diversity
A total of 25 alleles(fromtwotoseven per locus) were
detected in the 453 sampled individuals at the six cpSSR
loci (samples n
1
in table I). The description of the alleles
at each locus and the haplotypic data can be obtained
upon request from the corresponding author. Exclusive
alleles were found for both the Portuguese (85 base pairs
(bp) for Pt1254 and 146 bp for Pt36480) and the French
(164 bp for Pt87268, 112 bp for Pt15169, 142bp for
Pt71936, and 142 bp for Pt30204) data sets. When all al-
leles were combined, 71 different haplotypes were
found. While 15 (21%) of the haplotypes were common
to both provenances, 39 and 17 (55% and 24%) were ex-
clusively present in the French and Portuguese prove-
nances, respectively. The among-population diversity
obtained for the French populations was found not to be
significantly different from zero: θ
F
= 0.005 ± 0.011
(±SD). The θ value, θ
P
, obtained for the Portuguese pop-
ulations was very low, θ
P
= 0.023 ±0.014, but signifi-
cantly different from zero. The genetic differentiation
computed for both groups of populations was
θ
T
= 0.038 ±0.009, and significantly different from zero.
The pairwise population differentiation, French against
Portuguese groups (populations confounded) was tested
and found to be significantatthe0.1%probability level.
The density functions of the Spanish (Galician) and
Portuguese populations overlapped (data not shown).
Both functions were found to be not significantly differ-
ent from each other, and the data from Portuguese and
Spanish populations were merged together to obtain the
density function of the NW Iberian reference population.
Conversely, the density functions for the NW Iberian and
the French reference populations did not overlap signifi-
cantly (α = 2%), thus both groups could be considered
divergent from each other (table III).
3.2. Discriminant loci and effect of the sample size
In the first screening step, thedensity functions forthe
S
j
statistic were obtainedfor all cpSSRloci (figure 1), us-
ing a subset of the French and Portuguese individuals (n
1
in table I). The three non-discriminant loci had overlap-
ping density functions, and three loci (Pt1254, Pt36480
and Pt15169) were found to discriminate between the
two provenances (figure 1 and table II).
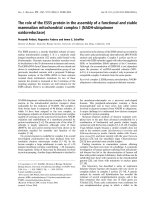
In a second step, the haplotypes of additional individ-
uals from both provenances (sample n
2
in table I) were
recorded at the two most informative loci (Pt1254 and
Pt36480). The power of the test (1-β) obtained for the
two combined loci was higher (98.4%) than the corre-
sponding value for each informative locus taken sepa-
rately (table II). Since a compromise had to be found
between the accuracy of the test and its costs, combina-
tions with more than two loci were not considered. More-
over, the size of the amplified fragments from the two
selected loci allowed sufficient discrimination and the
amplified products fromdifferent loci could beloaded si-
multaneously in the same lane, which saved time and
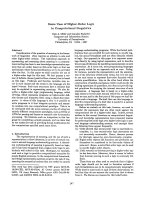
costs. Figure 2 shows the density functions for the null
and alternative hypotheses based on the two selected
loci. Locus Pt15169 was excluded, because of its lower
discriminatory power of the test (table II).
The effect of the sample size (N) used to compute the
statistic S
j
was tested over the type I error, when type II
error was kept constant (β = 1%). As expected, the type I
error decreased with increasing sample size (table III).
With a sample size of 30, the α value was 2% and the
58 M.M Ribeiro, G. LeProvost et al.
Table II. Characteristics of the probability densities, using the n
1
samples described in table I, for each of the six cpSSR loci and
for the two discriminant loci.
Locus S
c
a
α
b
(%) (1-β)
c
(%)
Pt 87268 Non-discriminant
d
Pt 15169 0.0540 4.40 94.65
Pt 71936 Non-discriminant
d
Pt 30204 Non-discriminant
d
Pt 1254 0.0680 2.91 96.90
Pt36480 0.0168 0.60 95.50
Pt1254 + Pt36480 0.0785 1.40 98.40
a
: Critical value for minimized α and β values.
b
: Type I error.
c
: Power of the test.
d
: Overlapping density function curves (see figure 1).
critical value was S
c
= 0.075. Due to the time and costs
needed to run larger sets of samples, and because the ob-
tained αvalue wasreasonable, N = 30 was selectedas the
sample size.
3.3. Testing the λ stands
The critical value S
c
= 0.075 was compared with the
statistic S computed foreach λ stand (table IV). Usingthe
two selected loci, only one of the λ stands was found to be
of NW Iberian origin, while all the remaining stands were
of French origin. Furthermore, the stand of putative NW
Iberian origin showed the exclusive allele found in the
Portuguese populations at the locusPt36480(146 bp).The
terpene analysis was less conclusive. In two out of the five
stands, the first biochemical analysis was insufficient to
identify their putative origin. It had to be repeated up to
four times until a conclusive answer was obtained and the
origin of the stands was determined (table IV).
4. DISCUSSION
4.1. The importance of the markers used (cpSSRs)
In this study, in order to develop the test comparing
the French and NW Iberian provenances it was necessary
to obtain sets of data that clearly differentiated between
provenances, while being insensitive to differences
among populations within provenances, from the cpSSR
analyses. The diversity among the Portuguese popula-
tions was found to be very low and among the French
populations was foundto be effectively zero.Both sets of
data were considered homogeneous and used as refer-
ence populations. The tests for population differentiation
showed a clear difference between the Portuguese and
the French groups of populations: this means that the re-
sults obtained with the markers (cpSSRs) we used al-
lowed the two provenances to be differentiated. The
Portuguese and Galician populations together consti-
tuted the NW Iberian referencematerial, as they were not
significantly divergent from each other. However, since
the density functions for the NW Iberian and the French
Origin identification of P. pinaster stands using cpSSR 59
Locus Pt1254 + Pt36480
percentage
0
5
10 15 20 25 30
0.0 0.1 0.2 0.3 0.4
Figure 2. Density functions for the NW Iberian and French reference populations (solid and dotted lines, respectively) for the two most
discriminating loci combined (Pt1254 and Pt 36480). The data points were obtained after 10,000 simulations.
Table III. Influence of the sample size (N) on the resampling
procedure, with typeII error of 1% andusing the n
2
individuals as
described in table I.
N α
a
(%) S
c
b
20 15.3 0.065
30 2.3 0.075
40 0.3 0.081
50 0.3 0.087
a
: Type I error.
b
: Critical value with β = 1%.
reference populations did not overlap significantly, the
two groups could be considered divergent from each
other.
Pinus pinaster has a scattered distribution in its natu-
ral range, which probably accounts for the wide diver-
gence found among regions. An isozyme-based study
showed high levels of divergence among six populations
spanning most of the distribution range of this species
(G
ST
= 0.16, [24]) compared with other Pinus species
(average G
ST
= 0.065, [15]). The markers used in this
study (cpSSR) also revealed highlevels of genetic differ-
entiation among populations due to differences in allele
size, across the range of this species [34].
In the present study, the results obtained with
chloroplast microsatellites showed a homogeneous dis-
tribution of the polymorphism within groups and clear
differentiation between the two groups of populations
(French and NW Iberian). This could have been caused
by reforestation programs that have been undertaken in
most parts of the range of P. pinaster since the beginning
of the twentieth century [5]. The use of seeds of different
origins, together with gene flow, has probably obscured
the divergence among populations within regions. Both
of theses factors could explain the homogeneity found
within regions [20, 28, 29]. The current distribution of
the species in Aquitaine is largely composed of artificial
plantations with seeds coming from original stands lo-
cated along the coast. There is strong historical and geo-
graphical evidence showing that the stands included in
the French reference population (coded 1-13, table I)in
this study are natural and of French origin (Mariette et al.
[20] and references therein).
4.2. Comparison between the cpSSR and the
terpene test
The results obtained with terpenes proved to be less
discriminating than those obtained with the cpSSRs. In
fact, with the new test,the origin ofthe stands wasidenti-
fied with no inconclusive results. In contrast, the terpene
test was initially inconclusive for two out of the five
tested stands andit had to be repeated up tofour times be-
fore a reliable answer was obtained. Thus, use of the
terpene test risks the need for repetitions, increasing both
the amount of plant material and time needed to get the
same information as obtained from a single cpSSR test.
In a study where the range-wide genetic structure of
P. pinaster populations was investigatedbyterpene anal-
ysis, the results showed that populations from western
France, Portugal and a large part of Spain form a cluster
[4]. Other population genetic studies in P. pinaster have
also indicated that the French and Portuguese popula-
tions are clustered together, using allozymes, proteins [2,
24] and, recently, mitochondrial DNA markers (Burban,
unpublished results).
Conversely, the distribution of chloroplast haplotypes
and the haplotypic diversity is geographically structured
at the regional level in the range of different species of
conifers, including P. pinaster as shown by both this
study andby Lefort et al. [17]. In a study where ten popu-
lations of P. pinaster spanning the range of the species
were screened using cpSSRs, an evident discontinuity
between the Portuguese and French groups of popula-
tions was found [34], and the same phenomenon was ob-
served in the present study. These findings are in
60 M.M Ribeiro, G. LeProvost et al.
Table IV. Comparison between the cpSSR (using loci Pt1254 and Pt36480) and the terpene test to discriminate between the origins of
the λ stands.
Stand code S
a
S
c
b
cpSSR test Terpene test
λ 1st 2nd 3rd 4th
1 0.0600 0.075 F
c
F
2 0.1200 0.075 NWI
d
NWI
3 0.0540 0.075 F IR
e
IR IR F
4 0.0600 0.075 F F
5 0.0057 0.075 F IR IR IR F
a
: Statistic computed for each λ stand.
b
: Critical value with β = 1%.
c
: Stand of French origin.
d
: Stand of NW Iberian origin
e
: Inconclusive result.
agreement with our suggestion that a marker capable of
detecting differences between groups should be used to
identify populations at a regional level. Therefore, the
cpSSR markers used in this study were suitable for the
principal purpose of our study: i.e. to determine the puta-
tive origin of P. pinasterstandsin the Aquitaine region of
France.
To our knowledge, the type of test developed here has
never been used before for identifying the origin of
stands. The results obtained indicate that similar tests
could be used for other species where polymorphic
cpSSRs or other markers are available. The approach
suggested here could easily be applied to other commer-
cial species, provided that there is a homogeneous distri-
bution of the polymorphism within groups and clear
differentiation between/among groups of populations. In
addition, cpSSR primers have already been shown to
cross-amplify sequences from several species, which
could be very advantageous given the long time and high
costs involved in identifying markers [26, 35].
4.3. Other test components
Nevertheless, the type of DNA marker used in the
present study is probably not the only factor responsible
for the differences found between the terpene and the
cpSSR tests applied toP. pinaster. The terpene testuses a
terpene profile analysisbased on a bulk-sample oftissues
from 30 different trees and a discriminant analysis. The
cpSSR test we developed uses the haplotypes based on
two loci from 30 different individuals and randomization
tests were usedfor testing the putativeorigin of the tested
stands. The higher accuracy showed by the cpSSR test
used in this study, compared with the terpene test, was
probably due to differences in several factors, i.e. the
type of marker, the statistical analysis involved and
the type of sample used (bulked vs. individual samples).
The contribution of each of these factors to the relative
accuracy of the tests is impossible to determine, but it is
clear that for one or moreof these reasons,the cpSSR test
gives considerably better data.
5. CONCLUSION
In the present study the combined information from
two cpSSR loci allowed a test to be designed with a type
II error equal to 1%. This test is more accurate than the
terpene test. The availability of a faster and more reliable
answer will be very valuableforidentifyingtheorigins of
stands in the Aquitaine region of France, and also in the
context of gene conservation. In addition, the type of
marker used (cpSSR) could be analysed by a commercial
genotyping laboratory using an automated DNA se-
quencer. Moreover, it is possible that similar methods
could be developed for other species, for identifying the
origin of seed-lots and for providing solutions to seed
certification problems.
Acknowledgements: M.M. R. was supported by a
PRODEP II fellowship Acção 5.2. This work was sup-
ported by a grant from the European Union (Contract
IC18970200). We wish to thank Professor A.E. Szmidt
and S.C. González-Martínez for the critical reading of
the manuscript.
REFERENCES
[1] Aragones A., Barrena I., Espinel S., Herran A., Ritter E.,
Origin of Basque populations of radiata pine inferred from
RAPD data, Ann. Sci. For. 54 (1997) 697–703.
[2] Bahrman N., Zivy M., Baradat P., Damerval C., Organi-
zation of the variability of abundant proteins in seven geographi-
cal origins of maritime pine (Pinus pinaster Ait.), Theor. Appl.
Genet. 88 (1994) 407–411.
[3] Baradat P.H., Marpeau A., Walter J., Terpene Markers,
in: Müller-Stark G., Ziehe M. (Eds.), Variation in European Po-
pulations of Forest Trees, Sauerländer’s Verlag, Frankfurt am
Main, 1991, pp. 40–65.
[4] Baradat P.H., Marpeau-Bezard A., Lepinmaritime, Pinus
pinaster Ait. Biologie et génétique des terpènes pour la connais-
sance et l’amélioration de l’espèce. Ph.D. Thesis, University of
Bordeaux I, 1988.
[5] Barbero M., Lisel R., Quezel P., Richardson D.M.,
Romaine F., Pines of the Mediterranean basin, in: Richardson
D.M. (Ed.), Ecology and biogeography of Pinus, Cambridge
University Press, Cambridge, 1998, pp. 153–170.
[6] Boisseaux T., Influence de l’origine génétique (landaise
ou ibérique) des peuplements de Pin maritime sur les dégâts cau-
sés par le froid de janvier 1985 au massif forestier aquitain. Mise
au point d’un test variétal précoce utilisable pour le contrôle de
lots de graines. Mémoire de l’ENITEF (Thesis), Université de
Bordeaux, 1986.
[7] Bucci G., Vendramin G.G., Delineation of genetic zones
in the European Norway spruce natural range: preliminary evi-
dence, Mol. Ecol. 9 (2000) 923–934.
[8] Chiu W.–L., Sears B.B., Recombination between chloro-
plast DNAs does not occur in sexual crosses of Oenothera, Mol.
Gen. Genet. 198 (1985) 525–528.
Origin identification of P. pinaster stands using cpSSR 61
[9] Crowley P.H., Resampling methods for computation–in-
tensive data analysis in ecology and evolution, Annu. Rev. Ecol.
Syst. 23 (1992) 405–447.
[10] Doyle J.J., Doyle J.L., Isolation of plant DNA from fresh
tissue, Focus 12 (1990) 13–15.
[11] Espinel S., Aragones A., Ritter E., Performance of diffe-
rent provenances and of the local population of the Monterey
pine (Pinus radiata D. Don) in northern Spain, Ann. Sci. For. 52
(1995) 515–519.
[12] Falkenhagen E.R., Isozyme studies in provenance re-
search of forest trees, Theor. Appl. Genet. 69 (1985) 335–347.
[13] Gaggiotti O.E., Lange O., Rassmann K., Gliddon C., A
comparison of two indirect methods for estimating average le-
vels of gene flow using microsatellite data, Mol. Ecol. 8 (1999)
1513–1520.
[14] Goudet J.,FSTAT(Version 1.2): A computer programto
calculate F-statistics, J. Hered. 86 (1995) 485–486.
[15] Hamrick J., Godt M., Sherman-Broyles S., Factors in-
fluencing levels of genetic diversity in woodyplantspecies,New
For. 6 (1992) 95–124.
[16] Jones N., Burley J., Seed certification, provenance no-
menclature and genetic history in forestry, Silvae Genet. 22
(1973) 53–58.
[17] Lefort F., Echt C., Streiff R., Vendramin G.G., Microsa-
tellite sequences: a new generation of molecular markers for fo-
rest genetics, For. Genet. 6 (1999) 15–20.
[18] Lerceteau E., Szmidt A.E., Properties of AFLP markers
in inheritance and genetic diversity studies of Pinus sylvestris L,
Heredity 82 (1999) 252–260.
[19] Manly B.F.J.,Ramdomization and Monte Carlo methods
in biology, Chapman and Hall, London, 1991.
[20] Mariette S., Chagné D., Lezier C., Pastuszka P., Raffin
A., Plomion C., Kremer A., Genetic diversity within and among
Pinus pinaster populations: comparison between AFLP and mi-
crosatellite markers, Heredity 86 (2001) 469–479.
[21] Matthews J.D., Seed production and seed certification,
Unasylva 18 (1964) 104–118.
[22] Neale D.B., Wheeler N.C., Allard R.W., Paternal inheri-
tance of chloroplast DNA in Douglas–fir, Can. J. For. Res. 16
(1986) 1152–1154.
[23] Parker P.G., Snow A.A., Schug M.D., Booton G.C.,
Fuerst P.A., What molecules can tell us about populations: choo-
sing and usinga molecular marker, Ecology 79(1998) 361–382.
[24] Petit R.J., Bahrman N., Baradat P., Comparison of gene-
tic differentiation in maritime pine (Pinus pinaster Ait.) estima-
ted using isozyme, total protein and terpenic loci, Heredity 75
(1995) 382–389.
[25] Plomion C., Bahrman N., Durel C.E., O’Malley D.M.,
Genomic mapping in Pinus pinaster (maritime pine) using
RAPD and protein markers, Heredity 74 (1995) 661–668.
[26] Powell W., Morgante M., McDevitt R., Vendramin G.,
Rafalski J., Polymorphic simple sequence regions in chloroplast
genomes: Applications to the population genetics of pines, Proc.
Natl. Acad. Sci. USA 99 (1995) 7759–7763.
[27] Press W.H., Teukolsky S.A., Vetterling W.T., Flannery
B.P., Numerical recipes in C: The art of scientific computing,
Cambridge University Press, Cambridge, 1992.
[28] Ribeiro M.M., Plomion C., Petit R., Vendramin G.G.,
Szmidt A.E., Variation ofchloroplastsimple-sequence repeats in
Portuguese maritime pine (Pinus pinaster Ait.), Theor. Appl.
Genet. 102 (2001) 97–103.
[29] Salvador L., Alía R., Agúndez D., Gil L., Genetic varia-
tion and migration pathways of maritime pine (Pinus pinaster
Ait) in the Iberian peninsula, Theor. Appl. Genet. 100 (2000)
89–95.
[30] Sinclair W.T., Morman J.D., Ennos R.A., Multiple ori-
gins for Scots pine (Pinus sylvestris L) in Scotland: evidence
from mitochondrial DNA variation, Heredity 80 (1998)
233–240.
[31] Stine M., Keathley D.E., Paternal inheritance of plastids
in Engelmann spruce × blue spruce hybrids, J. Hered. 81 (1990)
443–446.
[32] Szmidt A.E., Alden T., Hällgren J E., Paternal inheri-
tance of chloroplast DNA in Larix, Plant Mol. Biol. 9 (1987)
59–64.
[33] Szmidt A.E., El–Kassaby Y.A., Sigurgeirsson A., Alden
T., Lindgren D., Hällgren J E., Classifying seedlots of Picea sit-
chensis and P. glauca in zones of introgression using restriction
analysis of chloroplast DNA, Theor. Appl. Genet. 76 (1988)
841–845.
[34] Vendramin G.G., Anzidei M., Madaghiele A., Bucci G.,
Distribution of genetic diversity in Pinus pinaster Ait. as revea-
led by chloroplast microsatellites, Theor.Appl. Genet.97 (1998)
456–463.
[35] Vendramin G.G., Lelli L., Rossi P., Morgante M., A set
of primers for the amplification of 20 chloroplast microsatellites
in Pinaceae, Mol. Ecol. 5 (1996) 595–598.
[36] Wagner D.B., Govindaraju D.R., Yeatman C.W., Pitel
J.A., Paternal chloroplast DNA inheritance in a diallel cross of
Jack pine (Pinus banksiana Lamb.), J. Hered. 80 (1989)
483–485.
[37] Weir B.S., Cockerham C.C., Estimating F-statistics for
the analysis of population structure, Evolution 38 (1984)
1358–1370.
62 M.M Ribeiro, G. LeProvost et al.