Báo cáo khao học: "Defining the transition from earlywood to latewood in black spruce based on intra-ring wood density profiles from X-ray densitometry" pot
Bạn đang xem bản rút gọn của tài liệu. Xem và tải ngay bản đầy đủ của tài liệu tại đây (273.43 KB, 8 trang )
A. Koubaa et al.Earlywood-latewood transition in black spruce
Original article
Defining the transition from earlywood to latewood in black spruce
based on intra-ring wood density profiles from X-ray densitometry
Ahmed Koubaa
a*
, S.Y. Tony Zhang
b
and Sami Makni
c
a
Service de recherche et d’expertise en transformation des produits forestiers, 25 rue du Motel-Industriel, porte 5, Amqui, Québec G5J 1K, Canada
b
Forintek Canada Corp., 319 rue Franquet, Sainte-Foy, Québec G1P 4R4, Canada
c
COREM, 1180 rue de la Minéralogie, Québec City, Québec G1N 1X7, Canada
(Received 16 August 2001; accepted 12 February 2002)
Abstract – Defining the transition from earlywood to latewood in annual rings is an important task since the accuracy of measuring wood densi
-
ty and ring width components depends on the definition. Mork’s index has long been used as an anatomical definition of the transition from ear
-
lywood to latewood. This definition is arbitrary and extremely difficult to apply to X-ray densitometry. For X-ray densitometry, a threshold
density of between 0.40 to 0.55 g cm
–3
, depending on species, has been chosen to differentiate between earlywood and latewood density,but this
method has shortfall. Therefore, new methods need to be developed and integrated into the computational programs used to generate X-ray den-
sitometry data. In this study, we presented a mathematical method. We modelled the intra-ring wood density profiles in 100 plantation-grown
black spruce (Picea mariana (Mill.) B.S.P.) trees using high order polynomials. The correlation between the predicted and the measured densi-
ties is very high and highly significant. Based on this model, we define the transition from earlywood to latewood as the inflexion point. Results
indicate that wood density at the earlywood-latewood transition point varies from juvenile to mature wood. This method could be easily integra-
ted into any X-ray densitometry program and allows to compare individual rings in a consistent manner.
transition / earlywood / latewood / X-ray densitometry / wood density / black spruce / modelling
Résumé – Définition de la transition du bois initial au bois final chez l’épinette noire à partir des profiles de densité intra cernes obtenus
par densimétrie aux rayons X. La précision de l’estimation des densités et des largeurs du bois initial et du bois final dans un cerne annuel dé
-
pend de la définition de la transition du bois initial au bois final. L’indice de Mork a longuement servi pour donner une définition anatomique à
cette transition. Cette définition est arbitraire et difficile à appliquer en densimétrie aux rayons X. En général, un seuil de densité variant entre
0,40 à 0,55, dépendamment de l’essence, sert à différencier le bois initial du bois final. Cette méthode a certaines limites et d’autres méthodes
doivent être développées et intégrées aux programmes de densimétrie aux rayons X. Nous avons utilisé une approche mathématique pour modé
-
liser les profiles de densité intra cernes dans 100 arbres d’épinette noire (Picea mariana (Mill.) B.S.P.). Le point d’inflexion de polynômes aux
degrés élevés a servi pour définir la transition du bois initial au bois final. Les corrélations entre les densités mesurées et prédites sont élevées et
significatifs. La transition du bois initial au bois final varie entre le bois juvénile et le bois adulte. Cette méthode est facile à intégrer dans les pro
-
grammes de densimétrie aux rayons X et permet d’obtenir des comparaisons consistantes entre cernes annuels.
transition / bois initial / bois final / densimétrie aux rayons X / densité du bois / épinette noire / modélisation
1. INTRODUCTION
Wood density is considered by many as the most impor
-
tant wood quality attribute. It is related to many wood prop
-
erties including strength, stiffness and dimensional stability.
It also affects wood processing properties. Wood density is
highly variable. The variation in wood density may be due
to genetic, environmental, physiological or silvicultural
treatments [15, 20–22]. Physiological variation of wood den
-
sity is related to cambial activity and varies with age, season,
climate and environmental conditions [15, 22]. Physiological
variation is the main cause of within-a-tree variations which
include axial, radial, and within-a-ring (intra-ring) variations
[15, 22]. Intra-ring variation is mainly due to differences be
-
tween cell structure, and formations between earlywood and
latewood. Based on the samples of black spruce (Picea
Ann. For. Sci. 59 (2002) 511–518 511
© INRA, EDP Sciences, 2002
DOI: 10.1051/forest:2002035
* Correspondence and reprints
Tel.: 418 629 2288; fax: 418 629 2280; e-mail:
mariana (Mill.) B.S.P.) examined in this study, wood density
within a growth ring ranged from 0.23 to 0.83 g cm
–3
.
Intra-ring wood density variation is also indicative to wood
uniformity [4–6, 9, 10]. Woods with large differences be
-
tween earlywood and latewood densities (e.g., larches) are
not uniform, whereas woods with small differences between
earlywood and latewood densities (e.g., poplars, birches) are
uniform. Intra-ring wood density variation also determines
the suitability of a wood for specific end-uses [4–6]. Uniform
woods, for example, are preferred for veneer and panelboard
manufacturing, whereas non-uniform woods are preferred for
appearance products mainly because of the contrast between
earlywood and latewood.
Intra-ring wood density variation also provides informa
-
tion on wood formation and physiological processes [16, 22].
The X-ray densitometry profile of a single growth ring pro
-
vides considerable information on how the ring was formed
and how physiological processes changed during the growing
season. In addition, the anatomy of successive annual rings
provides a remarkable record of past environmental condi
-
tions over the years [1, 21, 22].
Intra-ring wood density profiles by X-ray densitometry
are also used to determine annual ring width and wood den-
sity components. Earlywood and latewood widths and wood
density components along with minimum and maximum den-
sities within a growth ring are determined from the profiles.
The earlywood and latewood densities and widths depend on
the earlywood-latewood (E/L) transition point. The latter is
difficult to determine and several methods have been re-
ported in literature. Mork’s index [14] has long been used to
determine this E/L transition point. There are at least two dif-
ferent interpretations of Mork’s index [3]. According to the
first interpretation, the E/L transition is obtained when dou
-
ble wall thickness become greater or equal to the width of its
lumen. From the second interpretation, the E/L transition is
obtained when the double cell wall thickness multiplied by 2
becomes greater or equal to lumen width. Although this in
-
dex, from both interpretations, is arbitrary and very time con
-
suming to measure, it allows to measure earlywood and
latewood features in a consistent manner.
Since Mork’s index method is based on double wall thick
-
ness and lumen diameter, it is necessary to measure these
wood anatomical features of individual growth rings on mi
-
croscopic slides or use indirect microscopic procedures [7].
In addition, this method is difficult to be integrated into X-ray
computational programs.
The result of a previous study [1] showed a good agreement
between earlywood and latewood features as determined by
three methods: Mork’s definition; threshold density; and
maximum derivative method. However, Mork’s index and
maximum derivative methods showed better estimates for
physiological variations than threshold method. The three
methods gave good evidence for environmental influence.
Most laboratories equipped with X-ray facility use the
threshold density to differentiate between earlywood and
latewood [11, 13, 16, 17]. Depending on species, a wood den
-
sity of between 0.40 and 0.55 g cm
–3
is usually chosen for this
differentiation. This method has the advantage of allowing
automatic determination of the earlywood and latewood tran
-
sition point and thus can be easily integrated into X-ray
densitometry computational programs. This method assumes
that the transition points for all samples have the same wood
density. In a preliminary and unpublished study [8], some
very detailed measurements of annual rings were made. The
E/L transition point was established for 84 annual rings by
Mork’s index. Basic wood density measurements were made
at these transition points and were found to vary greatly.
Hence, the validity of establishing a fixed cut-off point comes
into question [11].
Other laboratories use the minimum and maximum den
-
sity methods to define the earlywood-latewood transition [2,
19]. This method determines the E/L transition from the min
-
imum and maximum density of the densitometry profiles of
individual growth rings. Few formulas were used previously
to define this transition point [2, 19]. Although this method is
rapid, consistent and easy to be integrated into X-ray
densitometry computational programs, it is based on two sin-
gle values and thus does not consider the variation in the
whole intra-ring wood density profiles. A few other mathe-
matical and numerical approaches have been reported in pre-
vious studies [1, 18] to define the earlywood latewood
transition. These methods are commonly known as maximum
derivative methods where the transition point is generally de-
fined as the maximum of the derivative function that de-
scribes the intra-ring wood density variation. This approach
is promising and further research should be focused on devel
-
oping similar methods that could be consistent in estimating
earlywood and latewood features. These approaches should
also consider the intra-ring wood density profiles and its vari
-
ation. Modelling these profiles using various techniques such
as polynomial functions or smoothing techniques would con
-
sider both the profile and intra-ring density variation in esti
-
mating earlywood-latewood transition. The objectives of this
work are: (1) to model the intra-ring wood density profile in
black spruce using polynomial functions; (2) to determine the
E/L transition using a mathematical definition; and (3) to
study the variation in the E/L transition from juvenile to ma
-
ture wood.
2. MATERIALS AND METHODS
One hundred trees from a 50-year-old black spruce plantation lo
-
cated in Victoriaville, Québec (lat. 46
o
01’ N, long. 72
o
33’ W, elev.
90 m) were sampled randomly. Initial spacing in this plantation was
2m× 2 m. Average annual precipitation in the plantation site is
1000 mm and average annual temperature is 4.5
o
C. The length of
the growing season varies from 180 to 190 days. From a constant
compass direction, an increment core of 6 mm in diameter was taken
512 A. Koubaa et al.
at breast height from each sample tree. Each increment core was
wrapped in a plastic bag and kept frozen until the X-ray
densitometry was started.
The increment cores were sawn into 1.57 mm thick (longitudi
-
nal) strips with a specially designed pneumatic-carriage twin-bladed
saw. The sawn strips were extracted with cyclohexane/ethanol (2:1)
solution for 24 hours and then with hot water for another 24 hours to
remove extraneous compounds. After the extraction, the strips were
air dried under restraint to prevent warping. Using a direct reading
X-ray densitometer at Forintek Canada Corp., the air-dried strips
were scanned to estimate the basic wood density (ovendry
weight/green volume) for each ring from the pith to bark. Ring den
-
sity (RD) and ring width (RW) of each ring were determined based
on the intra-ring microdensitometric profiles [11]. Incomplete rings
false rings and rings with compression wood or branch tracers were
eliminated from the analysis.
Matlab
software was used to model the intra-ring wood density
profiles to determine the E/L transition point. This point was used to
calculate earlywood density, latewood density and latewood propor
-
tion. High order polynomial models (Eq. (1)) were used to describe
the intra-ring wood density profile, 4th to 6th order polynomial were
tested.
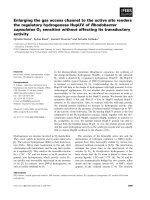
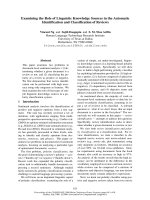
The E/L transition was defined as the inflexion point. The latter
is obtained by equalling the second derivative of the polynomial
function to zero (Eq. (2)). For a 6th order polynomial function, the
second derivative gives 4 solutions; only one solution is of interest
(figure 1). Few restrictions were specified in the Matlab program to
obtain this unique solution. These restrictions specify that the solu-
tion should be included in a positive slope and in the range of 40 to
90% of ring width proportion. If more than one solution is obtained,
the highest value among solutions is chosen.
D=a
o
+a
1
RW+a
2
RW
2
+a
3
RW
3
+a
4
RW
4
+ +a
n
RW
n
(1)
d
2
D/dRW
2
=2a
2
+6a
3
RW+12a
4
RW
2
+ +n(n–1)a
n
RW
n–2
(2)
where D is ring density; RW is ring width in proportion and a
i
are pa-
rameters to be estimated.
3. RESULTS AND DISCUSSION
3.1. Modelling intra-ring wood density profiles
To develop a mathematical definition of the E/L transi
-
tion, we need to model the intra-ring wood density profiles.
Previous researchers [1] used smoothing techniques and a
maximum derivative method to determine the early
-
wood-latewood transition point. They used a modified spline
function technique to smooth the intra-ring wood density pro
-
files. The E/L transition point was defined as the maximum of
the derivative of the spline function. Theoretically, the maxi
-
mum represents an inflexion point in the intra-ring wood den
-
sity profile and could be determined mathematically.
Another study [18] also used a numerical derivative method
to define the E/L transition point.
Table I indicates that high order polynomials fit the
intra-ring wood density profiles in black spruce well. The
higher polynomial is, the better fitness is. In general, the 6th
order polynomials are good enough to describe the intra-ring
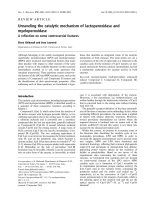
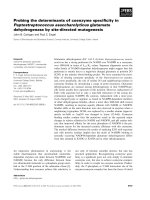
wood density profiles. Figure 2 illustrates the fitness of the
6th order and 4th order polynomials for the average profiles
for ring 20 from 100 trees. The coefficients of determination
for the 4th order polynomial were high, in most cases they
were well above 0.80 (results not shown). However, the 6th
order polynomials have much better fitness and higher coeffi-
cient of determination compared to the 4th order polynomi-
als. In fact, the coefficients of correlation between the
measured and the predicted data from the 6th order polyno-
mial models were well over 0.90 (table I). In most cases, they
were close to 0.99. This indicates that these models are able
Earlywood-latewood transition in black spruce 513
0.3
0.39
0.48
0.57
0.66
0.75
0 20406080100
Ring width (%)
Average profile for ring 20
0.3
0.39
0.48
0.57
0.66
0.75
0 20406080100
Ring width (%)
Average profile for ring 20
Ring density (g cm )
-3
Figure 1. Average within-ring density profile (from 100 trees) for the
twentieth ring from pith showing the E/L transition point as deter
-
mined by the inflexion point method.
0.3
0.39
0.48
0.57
0.66
0.75
0 20406080100
Ring width (%)
Average profile for ring 20
6th order polynomial (R
2
=0.999)
4th order polynomial (R
2
=0.967)
Ring density (g cm )
-3
Figure 2. Examples of the fits obtained from the 6th order and the 4th
order polynomials for average within-ring density profile for the
twentieth ring from pith.
to well describe the intra-ring wood density profiles in black
spruce. It is important to note that the fitness is better in ma
-
ture wood than in juvenile wood. The average coefficients of
correlation for mature wood profiles were higher and signifi
-
cantly different from those for juvenile wood at the 1% sig
-
nificance level (results not shown). This is due to the fact that
the intra-ring wood density data are noisier in juvenile wood
than in mature wood as reported previously [1].
3.2. Earlywood-latewood transition
Wood density at the E/L transition point (E/L transition
density) as defined by the inflexion point method showed a
large variation (table II). For example, the E/L transition den
-
sity varied from 0.48 to 0.77 g cm
–3
for the 25th annual ring
from the pith. Latewood density defined by this method also
showed a large variation. For the 25th ring from the pith,
latewood density ranged from 0.43 to 0.77 g cm
–3
. Similarly,
average earlywood density in a ring also varied largely. For
the same annual ring, the average earlywood density ranged
from 0.29 to 0.55 g cm
–3
. The average earlywood density in
this ring could be even higher than the threshold density
(0.54 g cm
–3
) commonly used to define the E/L transition
point.
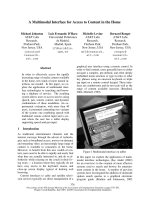
As shown in table II, wood density at the E/L transition
point in black spruce is variable. Its radial variation does not
seem to follow a particular trend (figure 3). In addition, the
average wood density at the E/L transition point (0.59 g cm
–3
)
is higher than the threshold wood density used for black
spruce (0.54 g cm
–3
). This result is in accordance with previ
-
ous findings for Norway spruce [1]. Since the wood density at
the E/L transition point defined by the inflexion point method
514
A. Koubaa et al.
Table I. Average, standard variation and range of Pearson’s coefficient of correlation between measured and predicted within-ring density
values from the 6th order polynomial models for different rings and for juvenile and mature wood.
Ring from pith Juvenile wood
(Rings 3 to 10)
Mature wood
(Rings 18 to 25)
5 10152025
Average / range of Pearson’s coefficient of correlation
Average profiles 0.97 0.97 0.98 0.99 0.99 0.99 1.00
Standard deviation 0.02 0.02 0.02 0.01 0.01 0.01 0.00
Range for all profiles 0.92–1.00 0.91–1.00 0.90–1.00 0.94–1.00 0.94–1.00 0.96–1.00 0.98–1.00
Table II. Average, range, standard deviation and coefficient of variation for wood density at earlywood-latewood transition, earlywood propor
-
tion, earlywood density and latewood density as defined by the inflexion method for different rings and for juvenile and mature wood.
Ring from pith Juvenile wood
(Rings 3 to 10)
Mature wood
(Rings 18 to 25)
5 10152025
Density at the earlywood-latewood transition
Average (g cm
–3
) 0.58 0.58 0.60 0.57 0.58 0.58 0.59
Range (g cm
–3
) 0.36–0.69 0.47–0.77 0.45–0.77 0.44–0.75 0.43–0.75 0.50–0.70 0.46–0.71
Standard deviation (g cm
–3
) 0.05 0.06 0.06 0.06 0.07 0.04 0.05
Coefficient of variation (%) 9.1 9.5 10.4 10.9 11.3 6.6 7.7
Earlywood proportion (Proportion of ring width at E/L transition)
Average (%) 78.5 80.6 76.6 73.3 71.8 80.5 72.8
Range (g cm
–3
) 57.0–89.1 63.5–86.7 53.7–84.8 48.8–89.0 42.6–89.5 71.3–85.0 48.0–82.2
Standard deviation 5.6 4.0 6.4 9.21 9.1 2.3 6.5
Coefficient of variation (%) 7.10 9.5 8.4 12.6 12.7 2.8 9.0
Earlywood density
Average (g cm
–3
) 0.41 0.38 0.39 0.38 0.38 0.41 0.39
Range (g cm
–3
) 0.32–0.50 0.30–0.57 0.29–0.50 0.26–0.59 0.29–0.55 0.32–0.48 0.31–0.48
Standard deviation (g cm
–3
) 0.04 0.04 0.04 0.05 0.05 0.05 0.04
Coefficient of variation (%) 8.6 9.9 11.0 13.3 12.9 7.3 6.7
Latewood density
Average (g cm
–3
) 0.63 0.64 0.64 0.62 0.63 0.61 0.63
Range (g cm
–3
) 0.45–0.72 0.52–0.76 0.42–0.80 0.48–0.80 0.42–0.76 0.55–0.72 0.51–0.74
Standard deviation (g cm
–3
) 0.05 0.05 0.06 0.06 0.07 0.03 0.03
Coefficient of variation (%) 7.5 8.1 9.4 10.2 10.4 7.3 8.7
is higher than the threshold wood density, the average early-
wood and latewood densities defined by the inflexion point
method will be higher than those by the threshold wood den-
sity method (figure 4). Earlywood width defined by the
inflexion point method will be larger, whereas latewood
width will be smaller (figure 5). Consequently, the latewood
proportion defined by the inflexion point method will be
lower (figure 6). In addition, the differences in ring width
components defined by the two methods are larger in juvenile
wood than in mature wood, especially for latewood width
(figure 5) and latewood proportion (figure 6). For example,
for the third annual ring the difference between latewood
widths as estimated by the threshold and the inflexion point
methods was 0.5 mm or 60%. This difference is statistically
significant at the 0.01 level. The difference decreases with in
-
creasing number of rings from pith. In mature wood, the dif
-
ference between latewood widths estimated by the two
methods is relatively small (around 15%) but still statistically
significant at the 0.01 level (results not shown).
Wood density at the E/L transition point by Mork’s defini-
tion varied greatly among individual growth rings [8]. This
indicates that the use of a predetermined fixed threshold
wood density does not reflect the variation in the intra-ring
wood density profiles among growth rings in a species. The
correlation values between growth traits estimated by the
inflexion point and threshold methods are relatively high es
-
pecially for earlywood traits (table III). However, the corre
-
lation between density traits is not significant at the 0.05
level. Therefore, the use of a threshold wood density method
could lead to errors in estimating earlywood and latewood
features, especially latewood proportion for some growth
rings (figure 6), although earlywood and latewood features
defined by the two methods showed a similar pattern of radial
variation. The result from this study is in accordance with
the conclusions drawn by previous workers [1, 18]. Mathe
-
matical approaches like the one presented in this paper could
Earlywood-latewood transition in black spruce 515
0.3
0.4
0.5
0.6
0.7
0 5 10 15 20 25 30
Cambial age (years)
Ring density (g cm )
-3
Figure 3. Radial variation of E/L transition density in a single tree.
15
30
45
60
75
90
0 5 10 15 20 25 30
Cambial age (years)
Ring width proportion (%)
Threshold Threshold
Inflexion Inflexion
Latewood proportion
Earlywood proportion
Figure 4. Average radial variation (from 100 trees) of ring density
and earlywood density and latewood density as determined by the
threshold method (filled symbols) and inflexion point method (open
symbols).
Table III. Pearson’s coefficient of correlation between earlywood and latewood ring width and density estimated from inflexion point method
and threshold density methods for different rings (100 trees).
Ring from pith All data
5 10 15 20 25 (All rings from 100 trees)
Earlywood width 0.95** 0.97** 0.97** 0.95** 0.93** 0.95**
Latewood width 0.55** 0.71** 0.54** 0.52** 0.53** 0.54**
Earlywood density 0.14
n.s.
0.10
n.s.
0.06
n.s.
0.11
n.s.
0.18
n.s.
0.06**
Latewood density –0.09
n.s.
0.14
n.s.
0.08
n.s.
–0.03
n.s.
0.06
n.s.
0.07
n.s.
Latewood proportion –0.06
n.s.
0.15
n.s.
–0.03
n.s.
–0.14
n.s.
–0.06
n.s.
0.02
n.s.
** Significant at the 0.01 level; n.s. not significant at the 0.05 level.
consider the ring-to-ring variation in the intra-ring wood
density profiles.
Despite the differences in the earlywood and latewood
features defined by the two methods, the same trends and
peaks are observed (figures 4–6). This indicates that each of
the two methods has its own merits. Both methods give good
evidence especially when we study the variation of wood
density with climatic conditions and radial variations of
wood density and growth traits [1] and to determine juve
-
nile-mature wood correlations or age-to-age correlations
[12]. However, the inflexion point method gives better esti
-
mates for earlywood and latewood traits than the threshold
wood density methods because it considers ring-to-ring vari
-
ation in the intra-ring wood density profiles.
The method presented in this work has not been supported
by anatomical evidence yet. According to a previous work
[1], however, the radial variations of earlywood and latewood
features obtained from Mork’s index and from maximum de
-
rivative method are concordant despite some differences.
The correlation between estimates of earlywood and late
-
wood traits from Mork’s index and maximum derivative
method were high and in most cases higher than the correla-
tion between estimates from Mork’s index and threshold
method [1].
3.3. Variation in earlywood-latewood transition from
juvenile to mature wood
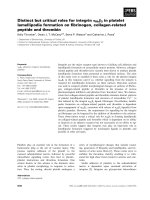
Differences in the intra-ring density profiles were
observed between rings of juvenile wood and mature wood
516
A. Koubaa et al.
0.00
0.80
1.60
2.40
3.20
0 5 10 15 20 25 30
Cambial age (years)
Ring width (mm)
Threshold Threshold
Inflexion Inflexion
Earlywood
Figure 5. Average radial variation (from 100 trees) of earlywood
width and latewood width as determined by threshold method (filled
symbols) and inflexion point method (open symbols).
-3
0.41
0.5
0.59
0.68
0.32
0 5 10 15 20 25 30
Cambial age (years)
Earlywood density
Latewood density
Ring density
Ring density (g cm )
Figure 6. Average radial variation (from 100 trees) of earlywood and
latewood proportions as determined by the threshold method (filled
symbols) and inflexion point method (open symbols).
Ring density (g cm )
-3
0.25
0.5
0.75
0 255075100
Ring width (%)
Ring 20
Ring 3
Figure 7. Average within-ring density variation in a juvenile wood
ring (Ring 3) and a mature wood ring (Ring 20) from the same tree
sample. The E/L transition as estimated by the inflexion point method
is shown in both cases.
(figure 7). This result is in accordance with the previous work
[10]. The intra-ring wood density profiles in juvenile wood
are characterized by a higher earlywood density, while the
profiles in mature wood are characterized by a higher late
-
wood density and a higher latewood proportion (table II,
figure 7). Wood density at the E/L transition point did not
show any appreciable trend from juvenile to mature wood de
-
spite large variation (table II). It varied from 0.50 to
0.70 g cm
–3
in juvenile wood, and from 0.46 to 0.71 g cm
–3
in
mature wood. Earlywood proportion (%), however, showed a
particular pattern of variation (figure 6). The earlywood pro
-
portion is low near the pith, increases steadily to a maximum
in the juvenile-mature wood transition zone leading into
mature wood where a slow but a steady decrease was ob
-
served. The trends defined by the two methods are very
comparable. However, earlywood proportion defined by the
threshold method is always lower than the one defined by the
inflexion point method. This study clearly showed a large
variation in wood density at the E/L transition point
(figure 3), as previously reported [8]. Therefore, the use of a
single value to differentiate between earlywood and latewood
may lead to errors in estimating earlywood and latewood fea
-
tures for some growth rings.
Differences in the intra-ring wood density profiles be-
tween juvenile wood and mature wood explain the radial
variation of wood density in black spruce (figure 4). Ring
density is high near the pith (in juvenile wood zone) and de-
creases rapidly to a minimum in the juvenile-mature wood
transition zone leading into mature wood where a slow but
steady increase was observed. The high density near the pith
is mainly due to a higher earlywood density (figures 4 and 7)
and a higher latewood proportion (figure 6). The following
decrease in ring density is due to a decrease in both early
-
wood density (figure 4) and latewood proportion (figure 6).
The steady increase in ring density in mature wood is due to
an increase in latewood proportion. In mature wood, varia
-
tion in both earlywood and latewood densities with cambial
age (figure 4) is much smaller than the variation in latewood
proportion (figure 6). The average increase in latewood pro
-
portion from the transition zone (ages 8 to 12) to mature wood
zone (ages 18 to 25) was 41.0% compared to an average in
-
crease in earlywood density of 4.5% and an average decrease
in latewood density of 2.0%.
4. CONCLUSIONS
Based on this study, the following conclusions can be
drawn:
1) Sixth order polynomials are able to well describe the
intra-ring wood density profiles in black spruce.
2) The inflexion point method has merits over the traditional
threshold density method in terms of defining the early
-
wood-latewood transition point in black spruce.
3) Differences in the intra-ring wood density profiles were
observed between juvenile wood and mature wood. The
differences explained the radial pattern of variation in
ring density. In addition, variation in the intra-ring wood
density profiles with cambial age led to variations in the
E/L transition density from juvenile to mature wood.
Acknowledgements: Data used for this study were generated
from another project funded by the Natural Sciences and Engi
-
neering Research Council of Canada. The authors would like to
thank Mr. F. Larochelle (Laval University), Mr. G. Gagnon (Quebec
Ministry of Natural Resources) for their assistance in sampling and
tree measurements, and Mr. G. Chauret (Forintek Canada Corp.) for
his assistance in X-ray densitometry. We are also grateful to Mr. M.
Labarre for providing the sample trees. The first author is grateful to
Mr. D. St-Amand, General Manager of SEREX, for his support to
the work.
REFERENCES
[1] Barbour R.J., Bergqvist G., Amundson C., Larsson B., Johnson J.A.,
New methods for evaluating intra-ring X-ray densitometry data: maximum de
-
rivative methods as compared to Mork’s index, in: Zhang et al. (Eds.),
CTIA/IUFRO International Wood Quality Workshop Proceedings, August
18–22, 1997, Québec City, Québec, pp. II61-67.
[2] Degron R., Nepveu G., Methodology of microdensitometric measure-
ment for Oak wood (Quercus Robur L. and Quecus petraea Liebl): Proposal
for a representative sampling of oak wood density within–ring, Holzforschung
50 (1996) 491–496.
[3] Denne M.P., Definition of latewood according to Mork (1928), IAWA
Bulletin 10 (1988) 59–62.
[4] Echols R.M., Patterns of wood density distribution and growth accele-
ration on the properties of wood, Forest Products Laboratory, Berkeley, CA,
1972.
[5] Echols R.M., Products suitability of wood determined by density gra
-
dients across growth rings, USDA Forest Service, Research Note PSW-273,
Berkeley, CA, 1972.
[6] Echolls R.M., Uniformity of wood density assessed from X-Rays of in
-
crement cores, Wood Sci. Technol. 7 (1973) 34–38.
[7] Evans R., Gartside G., Downes G., Present and prospective use of Sil
-
viscan for wood microstructure analysis, Appita annual conference, 1995,
pp. 91–96.
[8] Evertsen J.A., Wood microdensitometry Bulletin. Vol. 2 (No. 2), ISSN
0332-432X, 1982.
[9] Ferrand J C., Considerations on wood density. Part 2, Holzforschung
36 (1982) 153.
[10] Jozsa L.A., Timber management toward wood quality and end-value:
Softwood density trends in second growth British Columbia softwoods, in:
CTIA/IUFRO International Wood Quality Workshop Proceedings, August
18–22, 1997, Québec City, Québec, pp. V87–93.
[11] Jozsa L.A., Richards J.E., Johnson S.G., Calibration of Forintek’s di
-
rect reading densitometer. CFS Contract Report No. 55–12–001, Forintek Ca
-
nada Corp. Vancouver, BC, 1987, 16 p.
[12] Koubaa A., Zhang S.Y., Isabel N., Beaulieu J., Bousquet J., Phenoti
-
pic Correlation between juvenile-mature wood density and growth in black
spruce, Wood Fiber Sci. 32 (2000) 61–71.
[13] Larsson B., Pernestål K., Jonsson B., Sample preparation in micro
-
densitometry, Section of forest mensuration and management, Report Umeä,
Sweden, 1994.
[14] Mork E., Die Qualität des Fichtenholzes unterbesonderer Rücksich
-
tnahme auf Schleif– und Papierholz, Der Papier-Fabrikant 26 (1928) 741–747.
[15] Panshin A.J., de Zeeuw C., Textbook of Wood Technology. 4th ed.
McGraw-Hill Book Co., New York, NY, 1980.
Earlywood-latewood transition in black spruce 517
[16] Parker M.L., Improving tree-ring dating in Northern Canada by X-ray
densitometry, Syesis 9 (1974) 163–172.
[17] Parker M.L., Bruce R.D., Jozsa L.A., X-ray densitometry of wood at
the W.F.P.L. Technical Report No. 10. Forintek Canada Corp., Vancouver,
BC, 1980, 18 p.
[18] Pernestål K., Jonsson B., Larsson B., A simple model for density of
annual rings, Wood Sci. Technol. 29 (1995) 441–449.
[19] Polge H., Fifteen years of wood radiation densitometry, Wood Sci.
Technol. 12 (1978) 187–196.
[20] Rozenberg P., Franc A., Bastien C., Cahalan C., Improving models of
wood density by including genetic effects: a case study in Douglas-fir, Ann.
For. Sci. 58 (2001) 385–394.
[21] Splechtna B.E., Dobry J., Klinka K., Tree-ring characteristics of su
-
balpine fir (Abies lasiocarpa (Hook.) Nutt.) in relation to elevation and clima
-
tic fluctuations, Ann. For. Sci. 57 (2001) 89–100.
[22] Zobel B.J., van Buijtenen J.P., Wood Variation. Its Causes and Con
-
trol, Springer-Verlag, Berlin, 1989, 363 p.
To access this journal online:
www.edpsciences.org
518
A. Koubaa et al.