Báo cáo khoa học: "Molecular dissection of the quantitative inheritance of wood property traits in loblolly pine" pps
Bạn đang xem bản rút gọn của tài liệu. Xem và tải ngay bản đầy đủ của tài liệu tại đây (438.08 KB, 12 trang )
D.B. Neale et al.Wood property QTLs
Original article
Molecular dissection of the quantitative inheritance
of wood property traits in loblolly pine
David B. Neale
a,b*
, Mitchell M. Sewell
a
and Garth R. Brown
b
a
Institute of Forest Genetics, Pacific Southwest Research Station, USDA Forest Service, University of California, Davis, CA 95616, USA
b
Department of Environmental Horticulture, University of California, Davis, CA 95616, USA
(Received 16 August 2001; accepted 18 March 2002)
Abstract – Significant progress has been made toward the molecular dissection of the quantitative inheritance of wood property traits in loblolly
pine (Pinus taeda L.) and several other forest tree species. QTL mapping experiments have been used to reveal the approximate number of genes
controlling traits such as wood specific gravityandmicrofibril angle and the individual effects of these genes on the total phenotypic variance for
the trait. These analyses help to define the scope of the challenge to identify genes controlling complex traits. Verification experiments are nee-
ded to be certain of QTLs and to determine the effects of environmental variation and differences among genetic backgrounds. Genetic marker
by QTL associations might be used for within family marker-aided breeding, although this application will have limited impact on wood quality
improvement in pine. New technologies are being used to identify the genes underlying QTLs. Candidate genes can be identified by a variety of
approaches such as functional studies, gene mapping and gene expression profiling. Once candidate genes are identified then it is possible to dis-
cover alleles of these genes that have direct effects on the phenotype. This will be accomplished by finding SNPs in linkage disequilibrium with
the causative polymorphism. Discovery of such markers will enable marker-aided selection of favorable alleles and can be used for both family
and within family breeding. DNA marker technologies will complement traditional breeding approaches to improve wood quality in parallel
with growth and yield traits.
QTL / wood properties / SNP / marker-aided breeding / loblolly pine
Résumé – Décomposition au niveau moléculaire de l’hérédité quantitative des critères de qualité du bois de pin à l’encens (Loblolly pine,
Pinus taeda). On a réalisé des progrès significatifs dans le domaine de la décomposition au niveau moléculaire de l’hérédité des critères de quali
-
té du bois de Pinus taeda ainsi que de diverses espèces d’arbres forestiers. On a réalisé des essais de cartographie de QTL pour déterminer le
nombre approximatif de gènes contrôlant des critères tels que la densité spécifique, l’angle des microfibrilles et pour estimer l’effet de ces gènes
sur la variance phénotypique totale de ces critères. Ces analyses aident à définir le champ d’investigation permettant d’identifier les gènes con
-
trôlant des critères complexes. Il convient de procéder à des expérimentations pour vérifier la validité des QTL, pour détecter les effets de varia
-
tions des facteurs du milieu, et pour apprécier des différences éventuelles dues à la base génétique des populations en cause. La sélection
intra-famille assistée par marqueur peut faire appel à des marqueurs génétiques associés aux QTL. Néanmoins cette voie n’ouvre que des pers
-
pectives limitées d’application pour l’amélioration de la qualité du bois chez les pins. On fait appel à des nouvelles technologies pour identifier
les gènes qui sont à la base des QTL. Toute une série d’approches permettent d’identifier les gènes candidats telles que des études fonctionnelles,
la cartographie génique, et le profilage d’expression des gènes. Une fois les gènes candidats identifiés, il est possible de trouver les allèles de ces
gènes ayant un effet direct sur le phénotype. Cela sera fait en trouvant les SNP (polymorphisme d’un seul nucléotide) dans les déséquilibres de
liaison avec le polymorphisme en cause. La détection de tels marqueurs va permettre la sélection d’allèles favorables pour la sélection de famil
-
les et la sélection intra-famille. Les technologies utilisant les marqueurs ADN constituent un appoint aux méthodes traditionnelles d’améliora
-
tion de la qualité du bois conduites en parallèle avec celle de la croissance et du rendement.
QTL / qualité du bois / SNP / amélioration assistée par marqueurs / Pinus taeda
Ann. For. Sci. 59 (2002) 595–605
595
© INRA, EDP Sciences, 2002
DOI: 10.1051/forest:2002045
* Correspondence and reprints
Tel.: 530 754 8413; fax: 530 754 9366; e-mail:
1. INTRODUCTION
The genetic improvement of wood property traits is a
high-priority for nearly all forest tree-breeding programs.
Rapid growth rates in plantation forests lead to higher propor
-
tions of lower quality juvenile wood; therefore, there is a crit
-
ical need to improve wood quality as well as wood quantity.
Target wood property traits can vary depending on whether
wood is used for solid wood products or for pulp and paper.
For example, increasing wood specific gravity and/or de
-
creasing microfibril angle would have a positive effect on
lumber strength, whereas decreasing lignin content might in
-
crease pulp yield.
A number of physical and chemical wood property traits
are targets for genetic improvement, including wood specific
gravity, microfibril angle, fiber length, cell wall diameter,
cell wall thickness, pulp yield, modulus of elasticity, lignin
content and cellulose content. Quantitative genetic inheri
-
tance is assumed for all wood property traits; there are no ex
-
amples of wood quality traits under simple Mendelian
control. Although studies are limited, heritabilities of wood
property traits are generally quite high [35] suggesting that
although genetic control is quantitative, these traits may be
controlled by relatively few genes each. What these genes are
is completely unknown.
The focus of our research is to identify the genes control-
ling wood property traits in loblolly pine (Pinus taeda L.), the
most important timber species in the US. Our initial approach
toward discovery of such genes was to use quantitative trait
locus (QTL) mapping. Our QTL mapping experiments have
provided estimates of the number of genes controlling some
of these traits, the relative proportion of phenotypic variance
controlled by each gene and the approximate position of these
genes in the genome. QTLs, however, are only statistical en
-
tities; the genes coding for QTLs remain unknown. The sec
-
ond approach we have taken is to genetically map expressed
sequenced tags (ESTs) for genes thought to effect wood prop
-
erty traits to the QTL maps and look for co-location of QTLs
and ESTs on the genetic map. The ESTs chosen for mapping
generally have a predicted function based on their pro
-
tein-coding sequence. ESTs mapping near QTLs become
“candidate genes” for the QTL. Finally, we are searching for
single nucleotide polymorphisms (SNPs) within candidate
genes so that SNPs can be associated with wood property
phenotypes. Significant associations suggest, although do not
prove, that the candidate gene does in fact partially control
the quantitative trait. Continued application of these ap
-
proaches should ultimately identify many of the most impor
-
tant genes controlling wood property traits in loblolly pine
and other forest trees.
2. QTL MAPPING APPROACH IN LOBLOLLY PINE
There are four basic components common to any QTL
mapping analysis: (1) a mapping population suitable for the
experimental design of the study; (2) phenotypic data for the
quantitative trait; (3) genetic segregation data from the mark
-
ers used to monitor inheritance in the pedigree and (4) a sta
-
tistical method of analysis used to correlate the phenotype
with the inherited genotype. Each of these components, as
they relate to QTL mapping for wood property traits in
loblolly pine, is discussed below.
2.1. Mapping populations
A suitable mapping population must be identified to maxi
-
mize the chances for detecting QTLs. A QTL can only be de
-
tected if it in fact segregates in the mapping population. Thus,
at least one parent of the mapping population must be hetero
-
zygous for as many of the QTLs that control a trait as possi
-
ble. Also, the phenotypic variation must be sufficiently large
in the mapping population to enable the detection of a signifi
-
cant difference among the progeny classes.
An F
2
pedigree from a highly inbred crop species, such as
corn or tomato [8, 24], is most amenable to mapping QTLs.
Extreme phenotypes for a given trait can easily be selected
from genetically divergent inbred lines that are most likely
fixed for QTL alleles of opposite effect. The F
1
progeny gen-
erated from crosses among such divergent lines are therefore
highly heterozygous for both genetic markers and QTLs.
The three-generation outbred population structure most
closely approximates the structure of an inbred F
2
pedigree.
Ideally, two crosses are made among four unrelated grand-
parents, where each mating pair is between individuals dis-
playing divergent phenotypic values for the trait [10]. From
each grandparental mating, a single phenotypically interme-
diate individual is chosen as a parent. Presumably, these in-
termediate parents are heterozygous for both marker and
QTL alleles, and are potentially heterozygous for different
allelic pairs that display a divergent phenotypic effect.
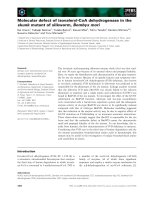
Four mapping populations from three-generation pedi
-
grees are currently being used to map QTLs for wood proper
-
ties in loblolly pine (figure 1). The original mapping
596
D.B. Neale et al.
GP
3
GP
7
GP
3
QTL
pedigree
Base
pedigree
500
P
1
P
2
172
GP
1
GP
2
GP
4
500
P
3
P
4
GP
5
GP
6
GP
8
P
5
P
6
77
GP
4
GP
7
GP
9
Prediction
pedigree
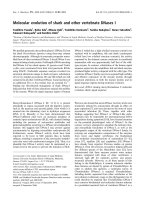
Figure 1. Diagram of the three-generation P. taeda pedigrees used in
QTL mapping experiments.
population from the qtl pedigree (designated as IFGQTL)
contains 172 progeny, and is grown at six different sites in
North Carolina and Oklahoma [10]. Recently, larger map
-
ping populations of ~500 progeny were generated for both
the qtl and base pedigrees (IFGVEQ and IFGVEB, respec
-
tively), and are grown at a single site in North Carolina [4].
The prediction pedigree (IFGPRE) consists of 77 progeny,
and is related to both the qtl and base pedigrees. The maternal
grandparents of the prediction pedigree are the same as the
paternal grandparents of the qtl pedigree. Therefore the pre
-
diction mother and the qtl father are full-sibs. Also, the pater
-
nal grandmother of the prediction pedigree is the same as that
of the base pedigree. The prediction pedigree is grown at two
different sites (Arkansas and Oklahoma). Each pedigree was
constructed from first-generation selections of the North
Carolina State University Industry Cooperative Tree
Improvement Program and is maintained by Weyerhaeuser
Company.
2.2. Physical and chemical wood property traits
Much of the success of a QTL detection experiment relies
on the choice of the phenotypic trait under investigation. A
trait controlled by a small number of genes each with a mod-
erate to large effect, which exhibits only a minor influence
from the environment (i.e., a highly heritable trait), has the
highest chance of QTL detection. However, success in QTL
detection does not necessarily equate with success in
marker-aided breeding (MAB). Lande and Thompson [15]
demonstrated that MAB is most efficient (relative to tradi-
tional phenotypic selection) with traits of low heritability.
Therefore, for traits where QTL detection is most robust,
phenotypic selection is equally effective. This dilemma can
be overcome when selection for highly heritable traits is ex
-
pensive or progress is slow relative to MAB [31]. Wood prop
-
erty traits are generally well suited for testing the efficacy of
MAB because of their economic importance, high
heritability, relative stability over ages and environments,
late assessment of phenotypic value and high cost of
phenotypic assay [34].
2.2.1. Wood specific gravity (wsg) and volume
percentage of latewood (vol%)
Wood specific gravity is a measure of the total amount of
cell wall substance in secondary xylem and is defined as the
ratio of the density of oven-dry wood relative to the density of
pure water at 4 °C [19]. The specific gravity of a given annual
ring is a function of cell size and cell wall thickness. Both of
these properties are heavily dependent upon whether the cells
were differentiated during the development of earlywood or
latewood. Earlywood is typically composed of large-diame
-
ter, thin-walled xylem cells, whereas latewood is typically
composed of smaller, thicker-walled xylem cells. Therefore,
the density of each individual annual ring is a direct combina
-
tion of its three seasonal determinants: earlywood specific
gravity, latewood specific gravity, and the relative percent
-
age of each [19]. Wood specific gravity is the most reliable
single index of wood quality because it is closely associated
with many important wood properties [36, 37]. X-ray
densitometry was used to estimate wood specific gravity and
volume percentage of latewood from a radial wood core. As
-
says were made on a ring-by-ring basis for both earlywood
and latewood [29].
2.2.2. Microfibril angle (mfa)
Microfibrils are long polysaccharide chains composed of a
crystalline cellulose core surrounded by chains of
hemicelluloses, which are encased by surrounding lignin and
become rigid [23]. Microfibril angle refers to the mean heli
-
cal angle that the microfibrils of the S
2
layer of the cell wall
make with the longitudinal axis of the cell [20]. Lower fibril
angles (closer alignment with the axis of the cell) have a posi
-
tive influence on lumber strength, stiffness, and dimensional
stability [19]. The thicker cell walls associated with latewood
typically have lower fibril angles, although there is no con
-
stant relationship within a tree between specific gravity and
fibril angle [19]. X-ray diffraction was used to estimate the
average microfibril angle of both earlywood and latewood
core sections from individual rings [20].
2.2.3. Cell wall chemistry (cwc)
The major chemical components of the cell wall are the
polysaccharide fractions (holocellulose) and lignin.
Holocellulose is composed of α-cellulose and a complex
mixture of polymers formed from simple sugars known col-
lectively as hemicellulose. The α-cellulose macromolecule is
polymerized from thousands of glucose residues to form a
highly stable, unbranched polysaccharide [23]. Lignin is de
-
rived from the polymerization of three different
hydroxycinnamyl alcohols (monolignols): p-coumaryl alco
-
hol, coniferyl alcohol, and sinapyl alcohol. These
monolignols give rise to the p-hydroxyphenyl, guaiacyl, and
syringyl units of the lignin polymer, respectively [1].
Pyrolysis molecular beam mass spectrometry (pyMBMS)
was used to estimate the chemical content of α-cellulose,
galactan and lignin from earlywood and latewood fractions
[5]. PyMBMS is a high-throughput analytical method that
combines a rapid spectroscopic technique with multivariate
regression modeling to estimate the content of a particular
cell wall constituent [22, 26, 35]. Using pyMBMS, the analy
-
sis of a single ground wood sample takes approximately two
minutes, compared to traditional analytical methods that gen
-
erally require several days.
In this study, chemical wood property traits were mea
-
sured based on chemical content per unit weight rather than
content per unit volume or per cell. Since wood is composed
of approximately 97% lignin and holocellulose, an inverse
relationship necessarily exists for lignin vs. holocellulose
content, while the two components of holocellulose
Wood property QTLs 597
(i.e., α-cellulose and hemicellulose) tend to vary directly
[23]. Therefore an observed increase in lignin content could
actually be the result of a decrease in holocellulose, or vice
versa. As a result, the individual components of cell wall
chemistry that were estimated by pyMBMS become an esti
-
mate of variation in overall cell wall chemistry, rather than an
estimate of variation of the individual components.
2.3. Genetic markers and mapping
There are two important aspects to consider when choos
-
ing a genetic marker system for QTL mapping experiments:
(1) the outbred nature of forest tree pedigrees and (2) the po
-
tential for comparative mapping. First, each parent of an
outbred pedigree is typically a different, highly heterozygous
individual, where the transmission of up to four different al
-
leles must be followed from the parents to progeny. There
-
fore, multiallelic codominant markers are best suited to
detect the maximum number of polymorphisms found in the
heterozygous parents. Second, comparative mapping, both
within species and among related taxa, is an important tool
for relating results from different mapping experiments.
Therefore a subset of the markers used in a mapping experi-
ment should be orthologous across pedigrees and species [3].
The loblolly pine genetic maps used in QTL analyses have
been constructed primarily from RFLP (restriction fragment
length polymorphisms) markers [7, 10, 28]. Although an effi-
cient method of mapping cDNAs, an RFLP analysis detects
all members of multigene families, including pseudogenes
[28]. By contrast, ESTP (expressed sequence tagged poly-
morphism) primers are designed from gene-coding regions
and often amplify specific members of multigene families
[32]. Because of this specificity, ESTPs are an excellent
source of orthologous markers [3].
2.4. QTL analysis
The 4-allele model of an outbred pedigree complicates the
analysis of QTLs in forest trees, where a significant differ
-
ence in phenotypic variation must be detected among four
genotypic progeny classes. The problem in implementing this
outbred model is that both parents are not heterozygous at
every locus. Therefore the four classes are not discernable at
every position along a linkage group. However, it is possible
to simultaneously utilize the linkage information from mark
-
ers of all mating types to increase the informativeness at any
given position on a linkage group [11]. Consequently, the
four genotypic classes of an outbred pedigree can be identi
-
fied at any given position in the genome, and the interval
method can be used in a QTL analysis under an outbred
model [14].
Traditional methods of estimating gene action under a
two-allele model do not apply to an outbred pedigree. How
-
ever, QTL results from an outbred analysis can be reported in
terms of the individual parental effects and an interaction
effect (table I [14]). For example, the maternal effect mea
-
sures the difference in effect of each maternal allele against
the background of the paternal alleles. The interaction effect
measures the deviation from additivity, where a value of zero
indicates complete additivity (although this measurement is
only valid if both parents are heterozygous at that QTL).
3. PHYSICAL AND CHEMICAL WOOD
PROPERTY QTLS IN LOBLOLLY PINE
Physical and chemical wood property traits have been ana
-
lyzed for the presence of QTLs in the original qtl pedigree
[29, 30]. Phenotypic data included rings 2–11 for wsg and
vol%, rings 3, 5, and 7 for mfa, and ring 5 for cwc. Both early-
wood and latewood were assayed for each trait. The outbred
model for QTL analysis described in [14] was used to search
the progeny population for significant associations among
genetic markers and trait data. Each physical wood property
trait (i.e., wsg, vol% and mfa) was analyzed as a composite
trait (i.e., an average of individual-ring traits) and as an indi-
vidual-ring trait. Composite traits were considered a more ac-
curate measurement of phenotypic variation because they
represented variation over a longer length of time.
3.1. Number and effect of QTLs associated with wood
properties
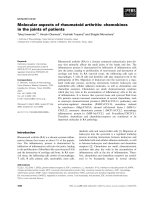
Nine unique QTLs were detected from composite traits for
wsg, five for vol%, and five for mfa (figure 2). Each of these
composite trait QTLs were also supported by individual-ring
QTLs, except for vol%_2.1, vol%_5.7 and wsg_14.1. Addi
-
tional unique QTLs were also detected for individual-ring
traits (figure 2). Eight unique cwc QTLs were identified from
multiple chemical wood property traits (figure 2). The resid
-
ual variance explained by each QTL ranged from 5.4 to
15.7% for wsg, 5.5 to 12.3% for vol%, 5.4 to 11.9% for mfa
and 5.3 to 12.7% for cwc.
Fourteen of the 27 composite trait QTLs (two for wsg, four
for vol%, three for mfa, and five for cwc) exhibited a strong
non-zero interaction effect, which suggests some degree of
non-additive expression (i.e., dominance or epistatis) for al
-
leles at these QTLs. Of the remaining 13 composite trait QTLs,
only one QTL for wsg and two for cwc exhibited a weak or
zero interaction effect in conjunction with possible evidence
that both parents are heterozygous. This combination
598
D.B. Neale et al.
Table I. Model used to test the effect of QTL alleles [14].
Parental cross Q
1
Q
2
×Q
3
Q
4
→ Q
1
Q
3
,Q
1
Q
4
,Q
2
Q
3
,Q
2
Q
4
Maternal effect = (Q
1
Q
3
+Q
1
Q
4
)–(Q
2
Q
3
+Q
2
Q
4
)
Paternal effect = (Q
1
Q
3
+Q
2
Q
3
)–(Q
1
Q
4
+Q
2
Q
4
)
Interaction effect = (Q
1
Q
3
+Q
2
Q
4
)–(Q
1
Q
4
+Q
2
Q
3
); where Qi = QTL allele
Wood property QTLs 599
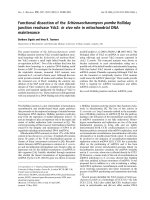
Figure 2. Map position of unique QTLs for wood specific gravity (wsg), volume percentage of latewood (vol%), microfibril angle (mfa) and cell wall chemistry traits (cwc) for the
loblolly pine qtl pedigree. Composite trait QTLs are listed to the left and additional individual-ring QTLs are listed to the right of each linkage group. The numerical suffix indicates
the linkage group number and interval for location of each QTL (e.g., 1.1 represents LG1 and interval 0–10 cM, 2.2 represents LG2 and interval 11–20 cM, etc.). An asterisk (*) indi-
cates QTL detection at the significant threshold (P ≤ 0.005); no asterisk indicates detection at the suggestive threshold (0.01 ≥ P > 0.005). The prefix preceding each marker name in-
dicates genetic informativeness at that locus; MI = maternally informative (H × A), PI = paternally informative (A × H) and FI = fully informative (H
1
× H
2
), where H = heterozygote
and A = homozygote. The scale is in centiMorgans (cM).
provides potential evidence for additive expression at only
these three QTLs. Therefore, the majority of the wood prop
-
erty QTLs exhibited some level of non-additive expression.
3.2. Temporal and environmental expression of QTLs
associated with wood properties
Given the substantial genetic diversity within and among
forest trees, and the variety of conditions in which they are
grown, it is important to understand the stability of QTL ex
-
pression over time and space. Even within a single site, geno
-
type × environment (G × E) interactions will likely affect the
temporal expression of QTLs. Long-lived trees also experi
-
ence different developmental stages of growth (e.g., the
change from juvenile to mature wood), which are likely con
-
trolled by different sets of regulatory factors.
A temporal dissection of QTL expression may provide in
-
sights as to how trees achieve their mature phenotype. For ex
-
ample, the physical wood property traits were analyzed over
multiple growing seasons, and a subset of QTLs was consis
-
tently detected over that time. Other QTLs were detected
only during a single year. For example, QTL wsg_4.10 ap-
pears to be consistently expressed over the duration of study,
whereas QTL wsg_5.6 appears to be expressed only during
the later stage of growth and is possibly associated with the
onset of the development of mature wood.
In addition, significant differences in wood chemical con-
tents were observed among the populations from North
Carolina vs. Oklahoma. QTL × E analyses provide evidence
that QTLs also interacted with environmental location. Four
QTL × E interactions were detected for multiple cell wall
chemistry components, two of which co-mapped with previ-
ously detected QTLs (cwc_6.10 and cwc_8.4).
3.3. Genomic distribution of QTLs associated with
wood properties
A number of studies in forestry have used the same map
-
ping population to identify and map QTLs for multiple traits.
In several of these studies, QTLs for different traits have been
mapped to the same genomic location [27]. For many of these
QTL clusters, the traits exhibited a high degree of phenotypic
correlation and similar allelic effects. This combined evi
-
dence suggests that pleiotrophy of a single QTL, rather than
simple linkage among two QTLs, may likely explain these
correlations [2].
Several chemical wood property QTLs co-mapped with
QTLs for physical wood property traits. For example, cwc_1.5
and mfa_1.5 both mapped to approximately 45 cM on LG1.
Even though both of these traits are associated with microfibrils,
there is little phenotypic correlation (–0.13 ≤ r ≤ 0.11) and little
congruence, either positive or negative, among the QTL ef
-
fects for these traits. Similar observations are found among
QTLs for cwc and wsg and vol%, supporting the hypothesis
that different QTLs are represented in these QTL clusters.
4. QTL VERIFICATION
A large number of QTL mapping experiments in forest
trees have been reported in recent years [27]. QTLs have been
mapped for a variety of growth, yield, wood property, adap
-
tive and disease resistance traits. In very few cases, however,
have QTL verification tests been performed, making it al
-
most impossible to assess the reliability of reported QTLs.
The simple solution to such a dilemma is to add replication to
all QTL mapping studies. Largely due to the significant costs
associated with marker genotyping, cloning and phenotyping
of some traits, replication is not part of most QTL experi
-
ments. Until replication becomes a standard aspect of QTL
mapping, it is still possible to achieve some level of verifica
-
tion by comparing the non-replicated studies with one an
-
other. This assumes, however, that QTL maps among crosses
or among species can be directly compared, which to date in
forest trees is usually not possible. In this section, we briefly
describe our efforts to develop comparative maps in conifers
and how such maps can be used to verify QTLs.
4.1. Comparative mapping in conifers
Comparative maps among crosses and related tree species
can be constructed by mapping orthologous genetic markers,
such as RFLPs and ESTPs, to individual species maps. Com-
parative maps among crosses within P. taeda have been con-
structed [28]. An international collaboration, called the
Conifer Comparative Genomics Project, has been formed to
construct comparative maps among pines, spruces, firs and
other conifers. Orthologous RFLP and SSR (simple sequence
repeat) markers were used to construct comparative maps be-
tween Pinus taeda × P. radiata [6], whereas ESTP markers
were used to create comparative maps between P. taeda and
P. elliottii [3] and between P. taeda and P. pinaster (Chagné
and Brown, unpublished). Comparative mapping in conifers
has lead to identification of homologous linkage groups and
soon it should be possible to associate linkage groups with in
-
dividual chromosomes. Comparative genome analysis, in
-
cluding QTL verification, is now possible in conifers.
4.2. Comparative QTL mapping
Comparative mapping can be used to verify QTLs at many
levels. Some comparisons are of basic biological interest
whereas others have important consequences for the applica
-
tion of marker-aided breeding. QTL verification can be as
-
sessed in several ways: (1) among test environments; (2)
among years; (3) within families; (4) among related families;
(5) among unrelated families and (6) among species.
4.2.1. Among test environments and years
We discussed temporal and spatial variation in wood spe
-
cific gravity QTL expression in P. taeda in an earlier section.
Some QTLs were detected in nearly all rings (years), whereas
some were detected only in one ring. Those expressed in all
rings can be considered as verified QTLs but those expressed
600
D.B. Neale et al.
in only one ring could easily be false positives. Likewise, not
all QTLs were expressed in all environments, which could be
due to lack of repeatability in detection or might be real
QTL × E interactions. The effect of test site and year of mea
-
surement can be more precisely estimated if a clonal mapping
population is used. We have conducted large QTL mapping
experiments in Pseudotsuga menziesii for bud phenology and
cold-hardiness traits using clonal mapping populations [12,
13]. Results of these studies show high repeatability of QTL
expression among years within test environments but low re
-
peatability among test environments. Although it is still diffi
-
cult to generalize, it seems that QTL verification among years
can be expected but will be difficult to establish among test
environments.
4.2.2. Within families
Within family QTL verification can be accomplished us
-
ing randomized and replicated field test designs in QTL map
-
ping experiments. As noted previously, this is rarely done in
forest tree experiments. An alternative is to compare QTL
mapping results from the same mapping population where
different progeny are tested at different test locations. Such a
comparison confounds the effect of test site, but does provide
some indication of within family verification. A comparison
of results between the IFGQTL and the IFGVEQ experiments
(figure 1) is one such test. Twenty-six percent (26%) of all
QTLs detected were common to both experiments, whereas
48% were unique to the IFGQTL experiment and 26% were
unique to the IFGVEQ experiment (table II). This is a sur-
prisingly high percent of QTLs in common given our earlier
conclusion regarding detecting the same QTLs in different
environments. We expect that within family QTL repeatabil-
ity would be nearly 100% if tested in the same environment.
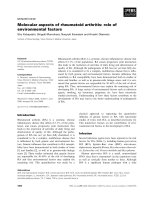
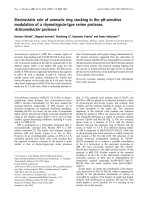
An example of some common QTLs were those for early
-
wood specific gravity at the top of linkage group 5 and vol
-
ume percent latewood near the middle of the linkage group 5
(figure 3).
4.2.3. Among related families
We conducted an experiment to determine if the same
QTLs could be detected in closely related families. The
IFGQTL and IFGPRE experiments had two of four grandpar
-
ents in common (figure 1). The paternal parent of IFGQTL
and the maternal parent of IFGPRE were full-sibs. Even
though IFGQTL and IFGPRE were planted at different test
locations, 43% of the QTLs detected were common to both
families (table II). QTLs for wood specific gravity and vol
-
ume percent latewood on linkage group 5 are some of the
QTLs common to both families (figure 3).
4.2.4. Among unrelated families
A concern often voiced by tree breeders is that QTLs de
-
tected in one family might not be found in other unrelated
families. This concern can not be adequately addressed until
QTL detection experiments are performed in large numbers
of families in replicated tests (such as diallels), which is a
very costly undertaking. In the interim, small comparisons
can be made, such as results from the IFGVEQ and IFGVEB
experiments. These families were planted at the same test site
and phenotypic measurements were made simultaneously.
Nevertheless, only 16% of the QTLs were common to both
families (table II). One explanation for this could be that the
Wood property QTLs 601
Table II. Percent of all wood property QTLs unique to individual ex
-
periments versus those common to pairs of experiments. See figure 1
for pedigrees for each experiment.
IFGQTL IFGPRE IFGVEQ IFGVEB Common
48% – 26% – 26%
32% 25% – – 43%
– – 68% 16% 16%
Figure 3. Comparative maps of linkage group 5 for four Pinus taeda
experiments (IFGQTL, IFGPRE, IFGVEQ and IFGVEB). Wood
property QTLs are shown in italics, e.g. wood specific gravity (wsg),
percentage volume of latewood (vol%), microfibril angle (mfa), and
cell wall chemistry (cwc).
IFGQTL family was selected because it was expected that
wood specific gravity QTLs would segregate in this family
[10], whereas no similar expectation was made about the
IFGVEB family. These results suggest that QTLs segregating
in multiple families may be less frequent.
4.2.5. Among species
Comparative maps between species will enable extending
QTL verification to cross-species comparisons. Comparative
maps between P. taeda with P. elliottii, P. radiata, P. pinaster
and P. sylvestris are all under construction and these maps
will have wood property QTLs. Detection of common QTLs
across several species will provide another form of QTL veri
-
fication.
5. CANDIDATE GENES, SNPS AND ASSOCIATION
TESTS
Successful QTL detection and verification provides the
opportunity for MAB. However, application will be limited
to within family breeding in forestry due to linkage
equilibrium between markers and QTLs in non-structured
populations. In addition, within family MAB itself will be
limited since QTL detection experiments require within fam-
ily phenotypic evaluation of progeny, in which case,
selection based on markers is no longer necessary. Therefore,
MAB within families will only be useful when parent trees
are remated, and early marker-selections are entered into a
clonal propagation program (e.g., somatic embryogenesis).
If the genetic distance between a marker and a QTL were
minimized (thereby increasing the opportunity for linkage
disequilibrium), greater genetic gains would be realized
through family selection using MAB. This will be achieved
once the actual genes (or subset of such genes) controlling a
quantitative trait are identified, and single nucleotide
polymorphisms (SNPs) are discovered to detect alleles for
these genes. Breeders can then apply selection directly at the
allelic level, regardless of pedigree or family relationships.
One approach to identify such genes is a “candidate gene”
analysis. Candidate genes (i.e., genes that putatively affect
trait expression) can be identified when sufficient informa
-
tion is known about the regulatory or biochemical pathways
associated with trait expression [16]. DNA sequences for
candidate genes can be obtained from gene databases [25].
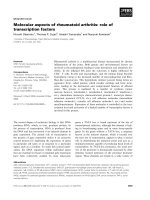
Alternatively, candidate genes can be identified from coinci
-
dental location with QTLs on well-characterized genetic
maps (figure 4). The challenge is to identify DNA
polymorphisms within candidate genes that will distinguish
alleles and then associate alleles with differences among
phenotypes. This can be accomplished through SNP discov
-
ery and association studies.
Association studies are based on the existence of linkage
disequilibrium in a natural population between a marker and
a quantitative trait nucleotide (QTN) directly affecting the
phenotypic value of the quantitative trait. Linkage disequi
-
librium (LD) is defined as the non-random association of al
-
leles at linked loci and results from the two sites only rarely
recombining from each other; it is an indirect estimate of
how closely two loci are linked on the same chromosome.
LD decays with time, and in older populations it is expected
to extend over only short distances. For loblolly pine, it can
be estimated that half of all locus pairs separated by physical
distances on the order of 1.4 Mbp will show LD
(1)
. Nonethe
-
less, LD is expected to vary among genes and will have to be
determined empirically.
602
D.B. Neale et al.
wsg
wsg
wsg
wsg
wsg
wsg
mfa
wsg
wsg
vol%
vol%
vol%
vol%
mfa mfa
wsg
mfa
vol%
wsg
vol%
Calmodulin
Isoflavin reductase-
like protein
GTP-binding protein
alpha tubulin
peroxidase
precursor
membrane intrinsic
protein
PAL
glutathione-S-
transferase
CCoAOMT
cwc
mfa
LG4 LG5 LG6
arabino-
galactan
Figure 4. Three loblolly pine linkage groups with candidate genes
and QTLs for wood specific gravity (wsg), percentage volume of
latewood (vol%), microfibril angle (mfa), and cell wall chemistry
(cwc).
(1) A perfect association between two linked loci decays with a “half-life” of (1 – θ)
t
≅ 1/2, where θ is the recombination rate and t is the number of generations
(adapted from [16]). Approximately 200 generations have passed in the natural population of loblolly pine, based on an estimated 10 000 years since
post-glacial recolonization and 50 years per generation. [Although loblolly pine can become reproductively mature before age 20 under open-grown
conditions, substantial seed production does not occur under crowded, more typical, conditions until age 25–30. Furthermore, the species requires wind
disturbance, such as a hurricane or tornado, for stand renewal – such an event is estimated to recur at any one site at 50 year intervals (Bongarten, pers. comm.)].
Therefore, (1 – θ)
200
≅ 1/2, and θ = 0.0035 or 0.35 cM. The relationship between genetic and physical map distances in loblolly pine is unknown and is certain to
vary both within and among chromosomes. For illustration purposes only, a value of 4Mbp/cM, hypothesized by Neale and Williams [21], was used. Thus
0.35 cM = 1.4 Mbp.
Our approach to conducting association studies in loblolly
pine is to identify SNPs within regions of candidate genes im
-
plicated in the control of physical and chemical wood proper
-
ties, to genotype a large number of individuals from the
natural population at these SNPs, and to test for SNP by phe
-
notype associations. The elements of each are discussed.
5.1. Association populations
An association population of approximately 500 individu
-
als is sufficient to detect associations between a phenotype
and a QTN responsible for 5% or more of the phenotypic
variance [17]. Weyerhaeuser Company has provided a popu
-
lation of 475 unrelated first- and second-generation selec
-
tions with 2 ramets/clone from the range of loblolly pine for
this study. The clones are 16–25 years of age and planted at
five different test sites in Georgia, Arkansas and Alabama.
Increment cores and needle samples have been taken for
wood property analysis and DNA extraction, respectively.
The physical and chemical wood property traits being ana
-
lyzed are the same as those described previously under QTL
mapping approaches.
Population differentiation in loblolly pine follows the
east-west division of the Mississippi River [9]. Admixture in
the association population can lead to false positive associa-
tions since any wood property trait that is more frequent in
one population will be positively associated with any allele
that by chance is also more common to that group. Although
the majority of genetic variation is found within populations,
rather than between populations, the extent of random mating
in the association population will also be evaluated.
5.2. Candidate gene identification
Candidate genes influencing wood property traits in
loblolly pine are identified by three approaches (table III).
(1) Gene homology to identify genes with known roles in
-
ferred from functional studies in model species or pines.
(2) Gene linkage to QTL to provide tentative support for the
role of a genetically mapped cDNA in determining the
observed phenotype.
(3) Gene expression to identify genes that are induced or re
-
pressed in tissues and/or at differing times when key
physiological events are occurring. Expression data is
obtained from two sources: contig assemblies that are
abundantly expressed in, or show differential expression
between, normal wood and compression wood (http:
//web.ahc.umn.edu/biodata/nsfpine), and preliminary
microarray experiments performed by our collaborators
[33].
5.3. SNP discovery and genotyping
SNP allele discovery is conducted by a combination of in
silico and de novo methods. The loblolly pine xylem EST
databases include sequences from multiple genotypes and
thus, inspection of contig assemblies provides a good indica
-
tion of gene regions where SNPs occur (figure 5). In addition,
the assemblies facilitate defining gene family members, thus
allowing member-specific PCR primer selection. Primers are
designed to amplify 500–600 bp from SNP-rich regions of
the 5’ and 3’ ends of candidate genes. DNA samples from a
panel of 32 megagametophytes of the association population
are then sequenced in the forward and reverse direction for
SNP validation.
To date, we have completed SNP discovery in the entire
coding sequence of an arabinogalactan gene (AGP6) of
loblolly pine, and for approximately 500 bp of 4-coumarate
CoA-ligase, two members of the cinnamic acid 4-hydroxy
-
lase family, and an arabinogalactan-like gene. On first obser
-
vation, the range of haplotypes for these five genes within the
32 gametes sampled is remarkable, varying from two for the
arabinogalactan-like gene to 16 for AGP6.
We have optimized procedures for SNP genotyping of the
entire association population on the Pyrosequencing SNP
Wood property QTLs 603
Table III. Candidate genes involved in wood formation.
Phenylpropanoid pathway related Genbank
accession
Linkage group /
cM
Cinnamoyl alcohol dehydrogenase AA556583 9 / 88
Cinnamoyl-CoA reductase AW754917
CCoAOMT AAD02050 6 / 92
Caffeic acid OMT U39301 11 / 85
Diphenol oxidase AI725182 1 / 84
4-coumarate CoA ligase T09775
Cinnamic acid 4-hydroxylase-1(2) AA556362 3 / 70 (10 / 17)
SAM synthetase 2 AI725188 8 / 97
SAM synthetase AI812759 3 / 116
SAM decarboxylase AA556889
S-adenosyl homocysteine hydrolase O23255 11 / 3
Glycine hydroxymethyltransferase AI812891 3 / 75
Isoflavone reductase-like AA556842 4 / 65
PAL AI813128 6 / 10
Phenylcoumarin reductase AA556450
Cell wall related
Beta 1,3 glucanase AA556234 8 / 55
Cellulase – cel2 AA557072 11 / 5
Cellulose homolog AI812676 11 / 40
Cellulose synthase AA556746
Glucosyltransferase AA556503 14 / 25
AGP6 AF101785 5 / 8
AGP-like14A9 U09556 3 / 78
AGP-like Pt3H6 U09555 4 / 95
Pectin methylesterase AA557010
Sucrose synthase AA556396
Xyloglucan endotransglycosylase AA556947
detection platform ().
Pyrosequencing is essentially high-throughput “sequenc
-
ing-by-synthesis”, and generates up to 20 nucleotides of
DNA sequence around a SNP (figure 6).
5.4. Testing for SNP by phenotype associations
There is considerable debate over the power of single-lo-
cus versus haplotype analysis in identifying associations be-
tween markers and phenotype. Long and Langley [17]
showed by simulation that single-marker-based permutation
tests were more powerful than haplotype-based tests. How-
ever, in some cases, a multilocus/haplotype approach was
shown to be more powerful [18].
A major advantage of single-marker based tests is that
they do not require haplotypes to be inferred from diploid
genotypic data. In its simplest form, a standard ANOVA can
be used to determine if significant differences in quantitative
trait values exist among SNP genotypic classes. Associations
will also be tested for using the diploid marker permutation
test [17].
REFERENCES
[1] Baucher M., Monties B., van Montagu M., Boerjan W., Biosynthesis
and genetic engineering of lignin, Crit. Rev. Plant Sci. 17 (1998) 125–197.
[2] Bradshaw H.D., Stettler R.F., Molecular genetics of growth and deve
-
lopment in Populus, Genetics 139 (1995) 963–973.
[3] Brown G.R., Kadel E.E., Bassoni D.L., Kiehne K., Temesgen B.,
van Buijtenen J.P., Sewell M.M., Marshall K.A., Neale D.B., Anchored refe-
rence loci in loblolly pine (Pinus taeda L.) for integrating pine genomics, Ge-
netics 159 (2001) 799–809.
[4] Brown G.R., Gill G.P., Bassoni D.L., Sewell M.M., Wheeler N.C.,
Megraw R.A., Neale D.B., Identification of QTLs influencing wood property
traits in loblolly pine (Pinus taeda L.). IV: QTL verification and candidate
gene analysis (to appear).
[5] Davis M., Elam C., Evans R., Wiselogel A., Wheeler N., Megraw R.,
Jech K., Neale D., Sewell M., Dinus R., West D., Tuskan G., Application of
pyrolysis molecular beam mass spectrometry for the determination of loblolly
pine and hybrid poplar cell wall composition, TAPPI Pulping Conf., TAPPI
Press, Atlanta, GA, 1999, pp. 1077–1082.
[6] Devey M.E., Sewell M.M., Uren T.L., Neale D.B., Comparative map
-
ping in loblolly pine and radiata pine using RFLP and microsatellite markers,
Theor. Appl. Genet. 99 (1999) 656–662.
[7] Devey M.E., Fiddler T.A., Liu B.H., Knapp S.J., Neale D.B., An
RFLP linkage map for loblolly pine based on a three-generation outbred pe
-
digree, Theor. Appl. Genet. 88 (1994) 273–278.
[8] Edwards M.D., Stuber C.W., Wendel J.F., Molecular-marker-facilita
-
ted investigations of quantitative-trait loci in maize, Genetics 116 (1987)
113–125.
[9] Florence L.Z., Rink G., Geographic patterns of allozyme variation in
loblolly pine, in: Proceedings of the Southern Forest Tree Improvement Con
-
ference, Starkville, MS, USA, 1979, pp. 33–41.
[10] Groover A., Devey M., Lee J., Megraw R., Mitchell-Olds T.,
Sherman B., Vujcic S., Williams C., Neale D., Identification of quantitative
trait loci influencing wood specific gravity in an outbred pedigree of loblolly
pine, Genetics 138 (1994) 1293–1300.
[11] Haley C.S., Knott S.A., Elsen J M., Mapping quantitative trait loci
in crosses between outbred lines using least squares, Genetics 136 (1994)
1195–1207.
[12] Jermstad K.D., Bassoni D.L., Jech K.S., Wheeler N.C., Neale D.B.,
Mapping of quantitative trait loci controlling adaptive traits in coastal Dou
-
glas-fir, Theor. Appl. Genet. 102 (2001) 1142–1151.
[13] Jermstad K.D., Bassoni D.L., Wheeler N.C., Anekonda T.S., Aitken
S.N., Adams W.T., Neale D.B., Mapping of quantitative trait loci controlling
adaptive traits in coastal Douglas-fir, Theor. Appl. Genet. 102 (2001)
1152–1158.
604 D.B. Neale et al.
Position
Haplotype 49 69 219 Frequency
1CTC 0.44
2ACC 0.22
3ACG 0.22
4 CCC 0.09
5CTG 0.03
Figure 5. In silico SNP detection and de
novo sequence validation in the coding
region of cinnamic acid 4-hydroxylase.
The contig assembly detected seven
SNPs (black squares). Amplification
and sequencing of a 489 bp DNA frag
-
ment encompassing the 3 SNPs at the 5’
end from 32 megagametophytes of un
-
related trees revealed 5 haplotypes. No
additional SNPs were found.
Figure 6. Pyrogram of a SNP in AGP6. Proportional signals are ob
-
tained for one, two, or three bases incorporations. Nucleotide addition
is shown below the pyrogram and the genotypes of a heterozygote
(top) and homozygote (bottom) are noted to the right.
[14] Knott S.A., Neale D.B., Sewell M.M., Haley C.S., Multiple marker
mapping of quantitative trait loci in an outbred pedigree of loblolly pine,
Theor. Appl. Genet. 94 (1997) 810–820.
[15] Lande R., Thompson R., Efficiency of marker-assisted selection in
the improvement of quantitative traits, Genetics 124 (1990) 743–756.
[16] Lander E.S., Schork N.J., Genetic dissection of complex traits,
Science 265 (1994) 2037–2048.
[17] Long A.D., Langley C.H., The power of association studies to detect
the contribution of candidate genetic loci to variation in complex traits, Gen.
Res. 9 (1999) 720–731.
[18] Martin E.R., Lai E.H., Gilbert J.R., Rogala A.R., Afshari A.J., et al.,
SNPing away at complex diseases: analysis of single-nucleotide polymor
-
phisms around APOE in alzheimer disease, Am. J. Hum. Genet. 67 (2000)
383–394.
[19] Megraw R.A., Wood quality factors in loblolly pine, TAPPI Press,
Atlanta, GA, 1985.
[20] Megraw R.A., Leaf G., Bremer D., Longitudinal shrinkage and mi
-
crofibril angle in loblolly pine, in: Butterfield B.A. (Ed.), Microfibril angle in
wood, Univ. Canterbury Press, Christchurch, New Zealand, 1998, pp. 27–61.
[21] Neale D.B., Williams C.G., Restriction fragment length polymor
-
phism mapping in conifers and applications to forest genetics and tree impro
-
vement, Can. J. For. Res. 21 (1991) 545–554.
[22] Ona T., Sonoda K., Ito K., Shibata M., Kato T., Ootake Y., Non-des
-
tructive determination of wood constituents by fourier transform raman spec
-
troscopy, J. Wood Chem. Tech. 17 (1997) 399–417.
[23] Panshin A.J., de Zeeuw C.E., Textbook of Wood Technology: struc
-
ture, identification, properties, and uses of the commercial woods of the Uni
-
ted States and Canada, 4th ed., McGraw-Hill, New York, 1980.
[24] Paterson A.H., Damon S., Hewitt J.D., Zamir D., Rabinowitch H.D.,
Lincoln S.E., Lander E.S., Tanksley S.D., Mendelian factors underlying quan-
titative traits in tomato: comparisons across species, generations, and environ-
ments, Genetics 127 (1991) 181–197.
[25] Plomion C., Hurme P., Frigerio J M., Ridolphi M., Pot D., et al., De-
veloping SSCP markers in two Pinus species, Mol. Breeding 5 (1999) 21–31.
[26] Schultz T.P., Burns D.A., Rapid secondary analysis of lignocellu
-
lose: comparision of near infrared (NIR) and Fourier transform infrared
(FTIR), TAPPI J. 73 (1990) 209–212.
[27] Sewell M.M., Neale D.B., Mapping quantitative traits in forest trees,
in: Jain S.M., Minocha S.C. (Eds.), Molecular Biology of Woody Plants,
Vol. 1, Kluwer Academic Publishers, The Netherlands, 2000, pp. 407–423.
[28] Sewell M.M., Sherman B.K., Neale D.B., A consensus map for lo
-
blolly pine (Pinus taeda L.), Genetics 151 (1999) 321–330.
[29] Sewell M.M., Bassoni D.L., Megraw R.A., Wheeler N.C., Neale
D.B., Identification of QTLs influencing wood property traits in loblolly pine
(Pinus taeda L.), Theor. Appl. Genet. 101 (2000) 1273–1281.
[30] Sewell M.M., Davis M., Tuskan G., Wheeler N., Elam C., Bassoni
D., Neale D., Identification of QTLs influencing wood property traits in lo
-
blolly pine (Pinus taeda L.), Theor. Appl. Genet. 104 (2002) 214–222.
[31] Strauss S.H., Lande R., Namkoong G., Limitations of molecu
-
lar-marker-aided selection in forest tree breeding, Can. J. For. Res. 22 (1992)
1050–1061.
[32] Temesgen B., Brown G.R., Harry D.E., Kinlaw C.S., Sewell M.M.,
Neale D.B., Genetic mapping of expressed sequence tag polymorphism
(ESTP) markers in loblolly pine (Pinus taeda L.), Theor. Appl. Genet. 102
(2001) 664–675.
[33] Whetten R., Sun Y H., Zhang Y., Sederoff R., Functional genomics
and cell wall biosynthesis in loblolly pine, Plant Mol. Biol. 47 (2001)
275–291.
[34] Williams C.G., Neale D.B., Conifer wood quality and marker-aided
selection: a case study, Can. J. For. Res. 22 (1992) 1009–1017.
[35] Wright J.A., Birkett M.D., Gambino M.J.T., Prediction of pulp yield
and cellulose content from wood samples using near infrared reflectance spec-
troscopy, TAPPI J. 73 (1990) 164–166.
[36] Zobel B.J., Jett J.B., Genetics of wood production, Springer-Verlag,
Berlin, Heidelberg, New York, 1995.
[37] Zobel B.J., van Buijtenen J.P., Wood variation: its causes and con-
trol, Springer-Verlag, Berlin, Heidelberg, New York, 1989.
Wood property QTLs 605