Báo cáo khoa học: "Growth and fructification of a Norway spruce (Picea abies L. Karst) forest ecosystem under changed nutrient and water input" doc
Bạn đang xem bản rút gọn của tài liệu. Xem và tải ngay bản đầy đủ của tài liệu tại đây (319.33 KB, 10 trang )
A. Dohrenbusch et al.Growth and fructification of Norway Spruce
Original article
Growth and fructification of a Norway spruce
(Picea abies L. Karst) forest ecosystem
under changed nutrient and water input
Achim Dohrenbusch
a*
, Stefan Jaehne
a
, Michael Bredemeier
b
and Norbert Lamersdorf
c
a
Institute of Silviculture, Göttingen University, Büsgenweg 1, 37077 Göttingen, Germany
b
Forest Ecosystems Research Center, Büsgenweg 1, 37077 Göttingen, Germany
c
Institute of Soil Science and Forest Nutrition, Büsgenweg 2, 37077 Göttingen, Germany
(Received 25 July 2001; accepted 25 January 2002)
Abstract – In the mountainous region of a low mountain range (Solling mountains) an ecosystem manipulation experiment with roof
constructions underneath the canopy of a 60-year old Norway spruce stand is run since 1991. The responses to artificially prepared, “pre-
industrial” through fall and to extended summer droughts with intensive rewetting are investigated in two parallel roof experiments and
evaluated against a roof control and an ambient control plot. After long terms of drought distinct reactions of the trees were visible in
growth. The reactions of height-increment were more distinct than the effects on diameter-increment. Furthermore, thetreesofthe domi-
nating social classes (Kraft I and II) reacted more on low water-supply than the dominated trees. So it is probable that a long lasting stress
by drought effects changes the stand structure, too: the vertical structure of a stand would get more homogeneous and the diversity in the
stand structure would decrease. Reduced input of sulphur and nitrogen did not show any distinct growth reactions within the 9-year ob
-
servation period.
roof-project / nitrogen / drought / growth / fructification
Résumé – Croissance et fructification d’un écosystème forestier d’épicéa commun soumis à un apport variable d’eau et de nutri
-
ments. Dans la partie haute d’une région montagneuse de moyenne altitude (Solling), on procède depuis 1991 à une expérience de mani
-
pulation d’un écosystème forestier à l’aide de constructions de toits en dessous des couronnes d’un peuplement d’épicéa commun âgé de
60 ans. Dans le cadre de deux expériences parallèles (de toit), on étudie les réactions à des précipitations « préindustrielles » créées artifi
-
ciellement et à une sécheresse estivale prolongée, suivie d’une réhumidification intensive, en évaluant et en comparant ces résultats à une
placette témoin. Après de longues périodes de sécheresse, on a pu observer des réactions différentes des arbres sur le plan de la crois
-
sance. Les réactions au niveau de la croissance en hauteur s’avèrent différentes des effets sur l’accroissement en diamètre. En outre, les
arbres dominants (Kraft I et II) témoignent d’une réaction plus prononcée à un faible apport d’eau que les arbres dominés. Ainsi, il est
probable qu’un stress de longue durée par l’effet de la sécheresse modifie également la structure du peuplement : la structure verticale
d’un peuplement devient alors plus homogène, tandis que la diversité du peuplement diminue. Les effets d’un apport réduit de soufre et
d’azote n’ont pas révélé de réactions différentes sur le plan de la croissance au cours de la période d’observation de 9 ans.
projet de toit / azote / sécheresse / croissance / fructification
Ann. For. Sci. 59 (2002) 359–368
359
© INRA, EDP Sciences, 2002
DOI: 10.1051/forest:2002012
* Correspondence and reprints
Tel.: 49 551 393678; fax: 49 551 393270; e-mail:
1. INTRODUCTION
The effects of environmental parameters on reactions
in forest ecosystems can be best investigated under labo
-
ratory conditions. Here it is possible to modify single fac
-
tors while other variables are kept constant. However, the
transfer of the results thus obtained to the ecosystem, is
problematic. Conditions are required which allow the
control of influence factors, but these conditions differ
markedly from the natural conditions. In addition, results
obtained under laboratory conditions do not give a realis
-
tic picture of the complex interactions in an ecosystem.
Existing interrelationships and mutual dependencies can
not be sufficiently considered. An alternative method is a
long term observation of forest ecosystems under field
condition with parallel observations of the role of the en
-
vironmental factors. The disadvantages of this method
are the prolonged periods of observation required and the
difficulty in determination of those parameters which
have a strong effect on the ecosystems among a number
of varying factors. In order to avoid these disadvantages,
ecosystems as a whole or at least representative parts
have to be exposed to controlled changes of the environ-
ment. This concept is the basis for the roof-project pre-
sented here.
The large scale experiment concentrates on two basic
environmental changes, which were simulated by quanti-
tative and qualitative manipulation of element inputs [4,
5]. The effects of an improved deposition quality which
can be expected as a result of implementation of air pro
-
tection measures, were investigated in a de-acidification
experiment. The effects of long periods of drought
phases were tested in a drought out experiment.
Internationally, the experiments were integrated in the
framework of the projects EXMAN (Experimental
Manipulation of Forest Ecosystems in Europe, project
duration 1987–1995, [3, 24] and NITREX (Nitrogen Sat
-
uration Experiments) supported by the EU. In this re
-
search co-operation similar projects were carried out on
the Danish west coast (Klosterheede), in south-western
Ireland (Ballyhooly), in the Netherlands and in Höglwald
in Bavaria.
The project was co-ordinated by the Forest Ecosys
-
tems research centre, University Göttingen and the work
carried out by groups in the Institute of Soil Science and
Forest Nutrition, the Institute of Silviculture and the Zoo
-
logical Institute. The results presented here focus on the
work of the group Eco-physiology and Growth, which in
-
vestigated aboveground reactions of the trees to the ma
-
nipulations. In particular the investigation shall test
whether tree growth would be better under de-
acidification and in which extent drought periods affect
tree increment.
2. MATERIALS
2.1. Investigation area and experimental site
The experimental sites of the roof project are about
50 km north-west of Göttingen (51
o
46’ 09" N; 9
o
34’ 52" E),
510 m above sea level in the department 4257j of the
forestry administration Dassel (Lower Saxony). The
suboceanic climate prevalent in the area Hoher Solling is
characterised as cool humid. The average annual temper
-
ature is 6.9
o
C, the average temperature during the
vegetation period (May–September) is 13.5
o
C. About
120 days were with frost (temperature minimum below
0
o
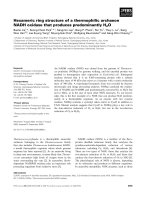
C). The relatively high amount of precipitation
(1040 mm/year) is evenly distributed over the course of
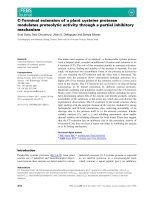
the year (figure 1). December the month with the highest
precipitation of 105 mm exceeds February the month
with the lowest rainfall by only 30 mm. Long term mea-
surements showed marked differences between the
years: The annual sums fluctuated over the past 30 years
between 400 mm (1959, 1983) and 1500 mm (1960,
1970) [8].
Measurements of air pollutants showed that the SO
2
-
pollution was very high during winter months. It reached
an average concentration of more than 0.1 mg m
–3
which
is comparable to the conditions in densely populated re
-
gions. Ozone was determined at high concentrations of
360 A. Dohrenbusch et al.
Figure 1. Average temperature and precipitation development
during the observation period, presented as deviation from the
average, long term climate.
more than 0.1 mg m
–3
(= 100 µg). The average nitrogen
concentration in the air during the winter months was
mostly more than 0.05 mg m
–3
(50 µg). In total the sul
-
phur input has considerably decreased. After a maximum
input was reached in the middle of the 1970s with more
than 100 kg ha
–1
yr
–1
it decreased to below 50 kg at the
beginning of the 1990s and today to just above 30 kg. In
contrast, the total amount of nitrogen deposition, com
-
posed almost of equal amounts of ammonium (N-NH
4
)
and nitrate (N-NO
3
) nitrogen, increased over the same
period of time from just 30 kg to 40 kg ha
–1
yr
–1
.
The experimental sites are on the slightly sloped
Solling Plateau. The geological parent material is a Tri
-
assic sandstone on which slightly podsolic, weakly
pseudogleyic brown-earth layers have formed [11]. The
nutrient potential of the sites is mainly determined by
loess layers of a varying thickness. In the investigation
area the loess is up to one meter, but shows large differ
-
ences over small spatial areas [1]. The organic layer
varying in deep thickness between 6 and 9 cm, corre-
sponds to an average dry substance of 114 t ha
–1
[11] , of
which just over half of the total amount can be allocated
to the OL and OF layer. Probably due to the high atmo-
spheric nitrogen inputs, the C/N-ratio of 25 found in all
humus layers is less than that normal for the fine-humus-
rich moder humus form [2]. The low magnesium and cal-
cium contents in the humus layer are evidence of the gen-
erally poor nutrient conditions (table I, [13]).
The very low pH-values in the upper soil of around 3
(pH CaCl
2
) are within the aluminium and iron buffer
ranges [21]. The pH increases to values of more than 4 at
deeper soil depths. As a result the contents of sodium, po
-
tassium and magnesium in the mineral soil at all soil
depths are very low, contributing only 6% to the total cat
-
ion exchange capacity. The highest amounts are found in
the soil layers at 20 to 40 cm depths. Relatively high
amounts of some nutrients have accumulated in the or
-
ganic layer: nitrogen and magnesium contribute one third
and calcium a quarter to the total amount.
2.2. The spruce stand
The spruce stand is the second generation of this tree
species, which replaced the natural wood-rush/beech for
-
est (Luzulo-Fagetum). The spruce stand was planted in
1933 and as a result of several silvicultural measures was
thinned to 900 trees ha
–1
by the beginning of the project
(1990). The stand was then 57 years old and had an aver
-
age DBH of 27 cm (d) where the strongest trees already
exceeded 40 cm. The mean height of the stand was
19.7 m (h) in which the highest tree measured 25 m. The
h/d ratio, the quotient calculated from tree height and
DBH used to determine the stand stability, showed a fa
-
vourable average value of 73. The average annual incre
-
ment was 9 m
3
ha
–1
yr
–1
. Almost all trees showed old
peeling scars at the stems caused by red-deer, noticeable
to varying degrees as wound occlusions. At the start of
the experiments the spruce were allocated to the damage
classes 2 (according to the international tree damage
class system, this means medium damage) and partly
damage class 3 (severe damage). In addition to needle
loss, older needles were chlorotic.
3. METHODS
3.1. Experimental design
The spruce stand was divided into several experimen
-
tal sites, of which the three sites D1, D2 and D3 were
roofed in order to be able to manipulate the water and ele
-
ment inputs. The roofs are self-supporting wooden
structures spanning over 17 m and with a 3.5 m ridge
height. A central maintenance building was built on con
-
crete foundations. Each roof is covered with transparent
polycarbonate sheeting and covers a ground area of
300 m
2
. The total precipitation falling on the roofs in the
stand was directed by pipes to collecting tanks in the
Growth and fructification of Norway Spruce 361
Table I. Average storage of nutrients in the humus and mineral soil up to a depth of 80 cm (LAMERSDORF 1998).
Element storage C N P K Ca Mg Mn Fe Al
in humus (t/ha) 48 1.9 0.11 0.22 0.16 0.08 0.02 0.91 1.0
in the mineral soil (t/ha) 55 3.5 0.86 1.14 0.46 0.17 0.98 0.85 13.7
sum (t/ha) 103 5.4 0.97 1.38 0.62 0.25 1.00 1.76 14.7
proportion in the humus (%) 46 35 11 16 26 31 2 52 7
maintenance building. Here the chemical composition of
the water could be manipulated by an installed desalina
-
tion and subsequent dispensing equipment. It was also
possible to deviate water for a temporary storage in the
storage tanks (42 m
3
≈140 mm precipitation). Finally the
precipitation of the stand – depending on the roof area
and experiment in natural or chemically changed form –
was transported via a pipe system back underneath the
roofs and released as rain using sprinklers. The three qua
-
drangular roof structures could be used from spring
1991. In order to carry out the necessary measurements
in the crown area, in spring 1992 a crane 30 m high was
installed in the center of the roofed area. This was
equipped with a special transport system for persons
(a cabin with a floor space of 100 × 70 cm) which made it
possible to reach the crown area of all of about 100 trees
which belonged to the experimental sites.
3.2. The experimental treatments
Under the de-acidification roof (D1) an unchanged
amount of precipitation, but in a changed composition
was sprinkled. In doing so the conditions were to be sim-
ulated which compared to the composition of pre-indus-
trial precipitation. In order to attain this result the water
was first de-mineralised in the desalination device and
subsequently a nutrient solution and sodium hydroxide
was added, thus the manipulated through fall only con
-
tained half of the normal concentrations of sulphate, ni
-
trate and phosphate. Considering the severely reduced
ammonium nitrogen content to 16% of the normal con
-
centration, this manipulation reduced the total nitrogen
input to almost one third. At the same time the pH-value
was increased from an ambient 4.1 to between 6.0 and
6.4, while the contents of aluminium and iron ions were
markedly reduced (20–25% of the normal input). The
similarly strong increase of the calcium (150% of the am
-
bient input) and magnesium inputs (200%) certainly does
not correspond to a simulation of pre-industrial inputs.
However, it means an optimisation of the site conditions
as it can be expected to result from a reduction of the
pollutant inputs in connection with soil amelioration
measures (liming, fertilisation).
Another roof (D3) was used for the investigation of re
-
sponses to drought. The precipitation during the vegeta
-
tion period in the years of 1991 until 1994 were collected
in large storage tanks and after a drought phase normally
lasting for several months sprinkled under the roof over
the space of a few days (table II). The average amount of
sprinkled water was 10 dm
3
m
–2
day
–1
(= 10 mm), how
-
ever, the daily amounts differed strongly. Especially in
1992 strong variations occurred: Very high amounts of
sprinkled water such as at the 11th Sept. with 28 mm
were corrected with extremely low amounts during the
following day (1 mm at the 12th Sept.). This experiment
was carried out to clarify the question, whether drought
and rewetting phases result in intensive acidification
pushes. Due to the marked drought stress responses ob
-
served at the trees in the years of 1993 and 1994 subse
-
quent to a drought over several months in 1995 no further
drought experiments were carried to give the stand a
chance to recover, instead the phase of recovery was
monitored by continuous measurements.
A directly adjacent non-roofed part of the stand (am-
bient control D0) and a roofed control (D2) served as the
controls. Here the collected precipitation was sprinkled
without changing the amount or the composition and thus
the environmental conditions simulated. Thus it was pos-
sible to test the validity of probable “roof effects”.
3.3. Measurements
Over a total period of nine years, from all 74 spruce
trees of the three roofed sites yield data were collected
(27 trees from roof 1, 24 from roof 2 and 23 from roof 3).
The control tree group analysed from the start of the
project, but did not grow within the range of the crane,
were thus replaced by a new control group in 1995. These
22 reference trees (16 original control trees at the side of
the roofs and 6 close to the crane foundation) are all
within reach of the crane. The radial growth was mea
-
sured with radial measuring bands, which were perma
-
nently fixed at a tree height of 1.3 m in 1989. Using this
362 A. Dohrenbusch et al.
Table II. Average annual element inputs (kg/ha) in the stand via precipitation at the control site D0 (mean of the time period
1990–1994).
NaKCaMgFeMnAlHNH
4
-N NO
3
-N SO
4
-S PO
4
-P Cl
18.7 26.1 17.4 3.9 0.4 3.0 1.0 1.1 17.6 18.9 42.4 0.2 36.5
method the radial growth of each tree was registered
monthly with an accuracy of ±0.2 mm. The annual radial
increment was estimated using the data obtained in
October. By October the transpiration rate of the trees
was already markedly reduced, so that expansion and
shrinking processes of the stems did not play an impor
-
tant role. Selected sample tree were additionally
equipped with a home made microdendrometer which
registers changes in radial growth of the stem at a differ
-
entiated level providing information about the growth
and water budget of the trees.
The measurement of the annual height increment was
also carried out in October. In order to do this the lengths
of the newly grown apical shoots had to be determined.
This was not possible until the crane could be used in
1992. For the previous years after 1988 the height incre
-
ment could be estimated on the basis of the distance be
-
tween the branching nodes. The total height of the trees
was first measured in October 1992 at the beginning of
the experiments. The subsequent annual height incre-
ment rates were used to update this measurement. The re-
production rate of the trees was determined by counting
the cones in autumn. The crane was used for this work,
and also for the visual assessment of the crowns at differ-
ent heights and perspectives.
4. RESULTS
4.1. Height growth
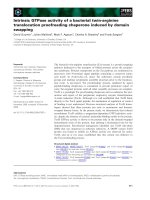
The course of the annual height growth showed simi
-
lar trends for all experimental variants. The mean height
increment decreased continuously since the beginning of
the measurements in 1988 from an average of 37 cm on
all sites to a minimum in the fifth year of monitoring in
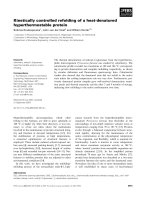
1992 (figure 2). At this date the mean shoot length was
only 14 cm. After which, up to 1996, a marked increase
in growth was again observed. In the years 1993 and
1994, an influence of the experimental treatments on the
height increment of the trees was shown. As a result of
the long dry periods during the summer months of
previous years the mean height increment on the D3-site
was significantly reduced by about half compared to the
other sites (analysis of variance, α < 0.05). After 1995
on the basis of all trees, no effects were shown induced
by the drought in previous years. By contrast, the ef
-
fect of the de-acidified precipitation on the trees of the
D1-site for the total period monitored were statistically
not significant.
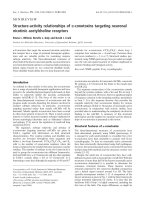
4.2. Radial growth
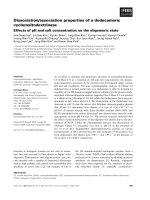
Figure 3 clearly shows that the pattern of radial
growth at a height of 1.3 m does not correspond to the
course of the height increment (figure 2). During the
whole monitoring period of nine years not even a trend
towards a change is detectable. The highest radial growth
increment was determined in 1997 for most of the sites.
In general, the non-roofed control trees showed a higher
radial growth than the roofed trees. That the control trees
are first shown in 1995 is as the control trees used until
then belonged to a different collective.
It was not possible to show conclusively an effect of
the treatments on the radial growth of the trees. Although
the drought experiment differed from the control under
the roof during the years of intensive drought by an
Growth and fructification of Norway Spruce 363
0
10
20
30
40
50
1988 1989 1990 1991 1992 1993 1994 1995 1996 1997 1998
height increment (cm / year)
D1 clean roof N=27
D2 control roof N=24
D3 drought roof N=23
control trees N=22
Figure 2. Development of the annual height growth.
0
1
2
3
4
5
6
1988 1989 1990 1991 1992 1993 1994 1995 1996 1997 1998
diameter increment (mm / year)
D1 clean roof N=27
D2 control roof N=24
D3 drought roof N=23
control trees N=22
Figure 3. Development of annual diameter increment.
average of more than 0.5 mm radial increment, this was
not statistically significant at any point in time. Only the
differences determined for the year 1995 between the de-
acidification and the drought experiment were signifi
-
cant (analysis of variance, α < 0.05).
Marked recovery effects were observed in the annual
radial growth of the trees under drought conditions. Dur
-
ing 1993 to 1995 the radial growth compared to the con
-
trol was still significantly reduced, while in 1996 the
growth of the trees exposed to drought was markedly
lower with 1.9 mm compared to an average of 2.6 mm
of other sites. In 1996 the growth on the de-acidification
site with 2.8 mm was highest, the difference at all sites
was not statistically significant (analysis of variance,
α < 0.05). From the cumulated monthly increment rates
since 1989, it is noticeable that droughted trees show a
strongly reduced growth after 1993. The trees of the de-
acidification experiment showed an increased radial
growth of the stem. However, this improvement was not
statistically significant at any point in time.
4.3. Effects on the stand structure
When the experimental treatment effects are regarded
separately for different sociological tree classes, an obvi-
ous effect on tree growth could be shown. This was based
on the hypothesis that non-dominating trees are less af-
fected by changes in the abiotic site factors. On the one
hand they are exposed to smaller amounts of immission
than the larger trees. On the other hand the competitive
conditions probably represent a stronger limiting factor
for their growth potential. Thus a worsening of the envi
-
ronmental conditions (compare D 3) or an improvement
(compare D1) will have lesser effects than for dominat
-
ing trees.
Figures 4 and 6 show the mean values for height and
radial increment of the dominating and codominating
trees (tree classes 1 and 2 based on Kraft). The values for
the trees which are at least partially overshadowed (tree
classes 3 to 5) are shown in figures 5 and 7. The classifi
-
cation of the trees according to their sociological order
was based on the stand condition, before the two experi
-
ments began in 1990.
The effects of the drought experiment were clearly ob
-
servable in the dominating and codominating trees from
1993. At the D3-site the lack of growth was significant
compared to all other sites. On average the height incre
-
ments (figure 4) of these trees was reduced by 50% and
the increments of radial growth (figure 6) by 20%. This
development could be observed over a period of four
364 A. Dohrenbusch et al.
0
10
20
30
40
50
1988 1989 1990 1991 1992 1993 1994 1995 1996 1997 1998
Height increment (cm / a)
D1 clean roof
D2 control roof
D3 drought roof
D0 control trees
Figure 4. Development of height increment for the dominating
trees (tree classes 1 and 2 based on Kraft).
0
10
20
30
40
50
1988 1989 1990 1991 1992 1993 1994 1995 1996 1997 1998
Height increment (cm / a)
D1 clean roof
D2 control roof
D3 drought roof
D0 control trees
Figure 5. Development of height increment for the dominated
trees (tree classes 3 to 5 based on Kraft).
0
1
2
3
4
5
6
1990 1991 1992 1993 1994 1995 1996 1997 1998
Diameter increment (mm / a)
D1 clean roof
D2 control roof
D3 drought roof
D0 control trees
Figure 6. Development of diameter increment for the dominate
trees (tree classes 1 and 2 based on Kraft).
years up to and including 1996. Thus the influence of the
drought experiment, which was finished in 1994 on the
D3-site, continued to be effective for two years after the
treatment was stopped. The trees showed no signs of a
quick regeneration. A visual assessment of the tree
crowns also suggests that although a regeneration pro-
cess had actually taken place, the damage in some cases
is however irreversible.
For the dominated trees on the D3-site a reduced in-
crement in height development was only determined (fig-
ure 5) during the years of severe drought (1993 and
1994). However, in the absolute volumes there were
marked differences which were statistically not signifi
-
cant (Scheffé, α < 0.05). After a fast adjustment of the
shoot length growth to the values of the control trees as
early as one year after the drought, the dominated roofed
trees on D3 developed better in the following years than
the trees of the other two roofs. The radial growth of the
dominated trees was not affected by the experimental
treatment (figure 7).
The results obtained have confirmed the hypothesis,
that a worsening of the environmental conditions mainly
affects the prevalent and dominating trees of a stand,
while the dominated trees hardly show any reaction. A
reason for this could be the more intensive contact of the
dominating tree crows with the polluted atmosphere
compared to the dominated trees. In addition, the domi
-
nated trees can take an advantage of the decline of domi
-
nant trees due to reduced leaf area, more light reaching
the lower canopy and less competition for water and nu
-
trients. If the conditions continue over several years the
structure of the stand may become more homogenous.
However, a complete adjustment and formation of stands
composed of one growth layer is unlikely to occur.
The evaluation of the results obtained from the de-
acidifying experiment did not show any significant ef
-
fects on tree growth (analysis of variance, α < 0.05). The
development of the height and radial growth increments
on the D1-site was similar to the development on the con
-
trol site D2. The investigation based on the sociological
classes could also not show any differences between the
dominating and dominated trees. The absence of a reac
-
tion is probably due to the compensating effects of the
changes in the input. Although as a result of the de-acidi
-
fication a better nutrient supply and thus a higher growth
rate was expected, the high reduction in nitrogen inputs
may have had the opposite effect. In addition on the D1-
site, which has a total of 27 trees, providing a much
smaller rooting area for each tree, which may have re
-
sulted in a stronger competition than on the other roofed
sites (with 24 or 23 trees respectively per 300 m
2
). Also
comparing the density dependent basal area, the value for
D1 with 56 m
2
ha
–1
is 10% higher than that of the two
other sites. These comparatively very high stocking rates
are also the result of bark stripping damage which oc-
curred on almost all stems. Wound occlusion leads also
to the formation of asymmetrical stem cross sections and
hollows, which prevented a more accurate determination
of the diameter of the stem. The typical symptoms of
thickened trunk bases due to butt rot damage from
Heterobasidion annosum induced by bark stripping dam-
age also lead to systematically increased DBH.
4.4. Seasonal growth developments
The permanently fixed rings for radial growth mea
-
surements permitted not only the determination of the an
-
nual values but also the monthly changes. In the years of
1993 and 1994 on D3 for several months of the vegeta
-
tion period strong drought conditions were simulated.
Figure 8 shows the mean growth values of the radial
growth.
In both years by far the highest growth rate was deter
-
mined in June, July and August. In 1994, a relatively wet
(20% more precipitation above the long term average),
and very warm year (+ 1
o
C above the long term average),
changes in radial growth were shown from May onwards.
The control trees outside the roofed area had a higher an
-
nual growth over the whole year which began at the start
of the vegetation period
The effects of the extreme drought in 1993 lasting
from April to September did not become apparent until
July, when the radial growth was markedly reduced.
Compared to the other roofed trees the increment in July
Growth and fructification of Norway Spruce 365
0
1
2
3
4
5
1990 1991 1992 1993 1994 1995 1996 1997 1998
Diameter increment (mm / a)
D1 clean roof
D2 control roof
D3 drought roof
D0 control trees
Figure 7. Development of diameter increment for the dominated
trees (tree classes 3 to 5 based on Kraft).
was lower by one third. In August growth stagnated to
0.2 mm, while the values at the other sites varied be
-
tween 0.6 and 0.9 mm. Towards the end of the vegetation
period in September, a seasonally related decrease in
growth of all trees decreased to the low levels of the
droughted trees was shown. However, after an intensive
rewetting was carried out an opposite reaction began. It
may be assumed that the trees on the D3-site in Septem
-
ber still had an unused growth potential which had not
been activated during the drought. This could be used to
compensate for a part of the losses in growth. To what ex
-
tent the increase in radial growth by 0.4 mm in October
1993 was related to an actual gain in growth or only to
temporary swelling processes of the stem and bark could
not be determined. When the drought experiment was re
-
peated in the following year, it was terminated by
rewetting in July 1994. However, although climatic con
-
ditions were very warm, no extreme changes in growth
were determined for the trees on the D3 site at the peak of
the summer. Rather, a continuous reduction of growth
was observed lasting over the whole of the vegetation
period.
4.5. Fructification
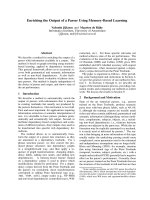
Figure 9 shows the average number of cones in the
years 1992 to 1998. The first count in late summer 1992
showed a large number of cones with an average between
93 and 97 per tree. However, the mean values on an area
basis conceals marked differences between individual
trees. While some trees had several hundred cones, oth-
ers had none. During the following two years the
amounts dropped to 30 cones in 1993 or 5 cones 1994, re-
spectively. After a new increase in the years 1995 and
1996 the number of cones in 1997 reached similar
amounts to those of 1994.
During the total monitoring period no significant dif
-
ferences were found between the experimental sites
(analysis of variance, α < 0.05). Independent of the site
however, there is a close relationship to the sociological
order of the tree, and thus the parameter DBH. A highly
significant, negative correlation was determined be
-
tween the annual height growth and the fructification in
-
tensity in the same year. The higher the number of cones
formed during the vegetation period, the smaller was the
growth in height of the trees.
5. DISCUSSION
The growth increment of trees must be considered to
be the result of several factors which underlie complex
interrelations. Thus it is very difficult to investigate indi
-
vidual aspects and their effects separately. This applies
366 A. Dohrenbusch et al.
Figure 8. Development of monthly diameter increment in 1993
and 1994.
Figure 9. Development of cone number.
especially to the investigations of environmental changes
carried out in the roof experiments. A result is that con
-
tinuous drought stress resulted in marked increment
losses. In contrast, the amelioration treatments of the soil
chemical conditions carried out in the de-acidification
experiments resulted in an increment increase especially
in dominant trees. It has often been observed that water
supply is a stronger influence than nutrient supply if site
conditions are improved [17].
The effects of drought stress were investigated by
Wiedemann [22] in several medium aged spruce stands
in Saxony. A relationship was determined between the
observed increment losses in the trees and the number of
months with drought (precipitation of less than 40 mm)
during the vegetation period. This corresponds with the
results of Gross [9] who determined a significantly re
-
duced increment growth rate under drought stress condi
-
tions in 10 to 15 year old spruce trees. A decrease in shoot
length growth in 4 to 5 year old spruce trees after a
drought period was shown by Michael et al. [15]. Nilsson
and Wiklund [19] describe a reduction of needle size as a
direct result of drought stress. Gross and Pham-Nguyen
[10] relate this process to the shorter shoot lengths. In ad-
dition, effects ranging from a thinning of needles to a to-
tal loss of older needle generations may occur. Thus it
may be concluded that the rate of photosynthesis de-
creases in spruce trees exposed to drought stress. This is
postulated by Gross [9] and Gross and Pham-Nguyen
[10]. However, not only the inhibition of the assimilating
system has a negative effect on the increment rate of the
trees. It must also be assumed that the growth of the root
system is reduced or altered [2]. As particularly the fine
root system is affected, water and nutrient uptake by the
trees is decreased. On the D3-site the radial and height in
-
crement regenerated within two years subsequent to the
termination of the drought experiment. Considering the
severe damage in some trees the regeneration time seems
remarkably short. Wiedemann [22] investigated spruce
stands and reports a time span of 2 to 20 years before a re
-
generation of the increment rate sets in.
A comparison of the de-acidification site D1 with the
roofed control site D2 allows conclusions to be drawn
about the effects of soil acidification. Despite a markedly
stronger intraspecific competition (higher density of the
stand at the beginning of the experiment) the trees on the
de-acidification site showed continuously better growth.
This is most certainly due to the experimental treatments
carried out which improved the nutrient supply to the
trees. Widstrom and Ericsson [23] emphasise the impor
-
tance of nitrogen and magnesium for the growth of
spruce and birch. Both elements play a key role under the
prevailing site conditions in the higher Solling uplands
[16]. The consequences resulting from magnesium defi
-
ciency are reported [14]. Here it is assumed that as a re
-
sult of the reduced transport of assimilates in the trees
growth is inhibited. It also appears that the formation of
chlorophyll strongly depends on the magnesium supply
to the needles.
An assessment of the importance of nitrogen for the
growth rate of spruce trees is more problematic. On the
one hand, as Rosengren-Brinck and Nihlgard [20] point
out, an increase of nitrogen input provides better growth
conditions, but at the same time it might represent a stress
factor for the trees. However, some site and regional dif
-
ferences render it difficult to determine the amount of ni
-
trogen available [6]. High concentration of nitrogen can
be responsible for the appearance of decline symptoms
[7]. It could be shown that high atmospheric nitrogen
input has a depressive effect on tree vitality during dry
periods [7]. Furthermore, a Norway spruce canopy can
uptake especially NH
4
+
nitrogen directly from the atmo-
sphere [12]. This makes it more difficult for a balanced
nutrient composition of the tree. An increase of the nitro-
gen supply thus does not automatically increase the in-
crement rate. On the D1 site the increment rate even
increased although the nitrogen inputs were shown to be
markedly reduced. Only on the sites with an insufficient
supply of nitrogen can specific fertilisation treatments
with nitrogen result in an increase of the growth rate.
This was shown by Nilsson and Wiklund [19] in a 25 year
old spruce stand in southern Sweden. For sites with a suf
-
ficient N-supply a balanced level of nutrient elements is
required, independent to a large extent of the total
amount of available nitrogen [18]. This seems to be con
-
firmed by the results obtained in the de-acidification
experiment on the D1-site.
Acknowledgements: The study received financial
support from the German Federal Ministry of Research
and Technology and from the State of Lower Saxony.
REFERENCES
[1] Blanck K., Lamersdorf N., Bredemeier M., Boden
-
chemie und Stoffhaushalt auf den Dachflächen im Solling, Fors
-
tarchiv 64 (1993) 164–172.
[2] Blanck K., Lamersdorf N., Dohrenbusch A., Murach D.,
Response of a Norway spruce forest ecosystem to drought/rewet
-
ting experiments at the Solling, Germany, Water Air Soil Pollut.
85, III (1995) 1251–1256.
Growth and fructification of Norway Spruce 367
[3] Bredemeier M., Experimental manipulations of the water
and nutrient cycles in forest ecosystems (patch-scale roof experi
-
ments: EXMAN), Agr. Forest Meteorol. 73 (1995) 307–320.
[4] Bredemeier M., Blanck K., Dohrenbusch A., Lamersdorf
N., Meyer A.C., Murach D., Parth A., Xu Y J., The Solling roof
project – site characteristics, experiments and results, For. Ecol.
Manage. 101 (1998) 281–293.
[5] Dohrenbusch A., Jaehne S. , Meyer A C., Reaktionen ei
-
nes Fichtenaltbestandes auf ein verändertes Wasser- und
Nährstoffangebot, AFZ-Der Wald, 54 (1999) 60–62.
[6] Evers M., Moosmayer D., Relationships between site
units, soil nutrient status and growth of spruce stands in a regio
-
nal comparison, Forstw. Cbl. 99 (1980) 137–140.
[7] Fehlen N., Picard J.F., Influence de la fertilisation sur la
végétation spontanée et la croissance radiale de l’épicéa commun
(Picea abies (L.) Karst) dans une plantation adulte des Ardennes
françaises, Ann. Sci. For. 51 (1994) 569–580.
[8] Gravenhorst G., Szarejko Z., Das Klima des Sollings (in:
Exkursionsführer Solling – Oktober 1990). Forschungszentrum
Waldökosysteme der Universität Göttingen, Berichte des Fors
-
chungszentrums Waldökosysteme, Reihe B 17 (1990) 5–14.
[9] Gross K., Nettophotosynthese, Produktion von Biomasse
und Effektivität des Wasserverbrauchs junger Fichten und Dou-
glasien unter dem Einfluß langfristig abgestufter Wasserversor-
gung im Freiland, Allg, Forst-u. J. Ztg 11 (1988) 230–239.
[10] Gross K., Pham-Nguyen T., Einfluß von langfristigem
konstanten Wassermangelstreß auf Netto-Photosynthese und das
Wachstum junger Fichten (Picea abies (L.) Karst) und Dougla-
sien (Pseudotsuga menziesii (Mirb.) Franco) im Freiland,
Forstw. Cbl. 106 (1987) 7–26
[11] Heupel G.M., Bodenkartierung der Sollingversuchsflächen
Abt. 257. Unpublished report, Inst. f. Bodenkunde u. Wal
-
dernährung, Göttingen (1989).
[12] Ignatova E., Dambrine E., Canopy uptake of N deposi
-
tion in spruce (Picea abies L.Karst) stands, Ann. For. Sci. 57
(2000) 113–120.
[13] Lamersdorf N., Auswirkungen wiederholter Bodenaus
-
trocknungen auf den Stoffhaushalt eines Fichtenwald-Ökosys
-
tems im Solling., Habilitationsschrift, Inst. f. Bodenkunde u.
Waldernährung d. Universität Göttingen, Göttingen (1998).
[14] Mehne-Jakobs B., The influence of magnesium defi
-
ciency on carbonhydrate concentration in Norway spruce (Picea
abies) needles, Tree Physiol. 15 (1995) 577–584.
[15] Michael G., Tesche M., Feiler S., Ranft H., Bellmann
Ch., Physiologische Reaktionen der Fichte (Picea abies) auf
komplexen SO
2
–
und Trockenstreß. Teil 2: Reaktionen trocken
-
belasteter Fichten auf nachfolgende SO
2
–
Einwirkung, Eur. J. of
For. Path. 19 (1989) 293–304.
[16] Mohren G.M.J, Ilvesniemi H., van Grinsven H.J.M.
Modelling effects of soil adification on tree growth and nutrient
status, Ecol. Model. 83 (1993) 263–272.
[17] Nilsson L.O, Huttl R.F., Manipulation of conventinal
forest management practicies to increase forest growth – results,
For. Ecol. Manage. 91 (1997) 53–60.
[18] Nilson L.O., Wiklund K., Huttl R.F. Nutrient balance
and P, K, Ca, Mg, S and B accumulation in a Norway spruce
stand following ammonium sulphate application, fertigation, ir
-
rigation, drough and N-free fertilisation, Plant Soil 168 (1993)
437–446.
[19] Nilsson L.O., Wiklund K., Influence of nutrient and wa-
ter stress on Norway spruce production in south Sweden – the
role of air pollutants, Plant Soil 147 (1992) 215–265.
[20] Rosengren-Brinck U., Nihlgard B., Effects of nutritio-
nal status on drought resistance in Norway Spruce, Water Air
Soil Pollut. 85 (1995) 1739–1744.
[21] Ulrich B., Stabilität von Waldökosystemen unter dem
Einfluß des „sauren Regens“, AFZ 26/27 (1983) 670–677.
[22] Wiedemann E., Zuwachsrückgang und Wuchsstockun-
gen der Fichte in den mittleren und unteren Höhenlagen der
sächsischen Staatsforsten, Verlag W. Laux, Tharandt 1925.
[23] Wikstrom F., Ericsson T., Allocation of mass in trees
subject to nitrogen and magnesium limitation, Tree Physiol. 15
(1995) 339–344.
(24] Wright R.F., Rasmussen L., Introduction to the
NITREX and EXMAN projects, For. Ecol. Manage., NITREX/
EXMAN special issue 101 (1998) 1–7.
368 A. Dohrenbusch et al.