Báo cáo khoa học: "Root biomass and biomass increment in a beech (Fagus sylvatica L.) stand in North-East France." doc
Bạn đang xem bản rút gọn của tài liệu. Xem và tải ngay bản đầy đủ của tài liệu tại đây (165.12 KB, 13 trang )
Original article
Root biomass and biomass increment in a beech
(Fagus sylvatica L.) stand in North-East France
Noël Le Goff
*
and Jean-Marc Ottorini
UMR INRA-ENGREF «Ressources Forêt-Bois»,
Équipe «Croissance et production», 54280 Champenoux, France
(Received 19 November 1999; accepted 13 June 2000)
Abstract – This study is part of a larger project aimed at quantifying the biomass and biomass increment of an experimental beech
stand aged 30 years, and comparing the carbon sequestration in trees to carbon fluxes. The below ground part of trees is expected to
play an important role in carbon sequestration. A method has been developed to estimate the biomass and biomass increment of
coarse, small and fine roots of trees from root system excavations of sampled trees of different crown classes. The biomass and bio-
mass increment of broken root ends during excavation was estimated from the diameter of the roots at the broken points. Equations
were then established relating the biomass and biomass increment of the different root categories to tree DBH. These equations were
then used to estimate the root biomass and biomass increment of the experimental stand from stem inventory, for the different root
categories. Trees from dominant and codominant crown classes contribute for more than 80% to below ground biomass and biomass
increment of the stand.
root system / biomass / biomass increment / biomass distribution / Fagus sylvatica
Résumé – Biomasse et accroissement en biomasse du système racinaire dans un peuplement de hêtre du Nord-Est de la
France.
Cette étude fait partie d’un projet plus vaste ayant pour objectif l’estimation de la biomasse aérienne et souterraine d’un peu-
plement expérimental de hêtre de 30 ans et de son accroissement, pour comparer la quantité de carbone séquestrée annuellement dans
les arbres aux flux de carbone mesurés par les échanges gazeux. La partie souterraine des arbres paraît jouer un rôle important dans la
séquestration du carbone. Une méthode a été développée pour estimer la biomasse et l’accroissement en biomasse des racines de dif-
férentes catégories de grosseur grâce à l’extraction du sol de systèmes racinaires d’un échantillon d’arbres représentatif des diffé-
rentes classes de statut social du peuplement. La biomasse et l’accroissement en biomasse des parties de racines cassées lors de
l’extraction du sol ont pu être estimés, pour chaque catégorie de racine, à partir du diamètre des racines au niveau de la cassure. Des
relations ont ensuite été établies entre la biomasse racinaire et son accroissement, pour chaque catégorie de racines, et le diamètre de
l’arbre à 1,30 m. Ces équations ont été utilisées pour estimer les biomasses au niveau du peuplement à partir de l’inventaire des
arbres. Les arbres dominants et codominants du peuplement contribuent pour plus de 80 % à la biomasse souterraine du peuplement
et à son accroissement.
système racinaire / biomasse / accroissement de la biomasse / répartition de la biomasse / Fagus sylvatica
1. INTRODUCTION
The potential of trees and forests to sequester carbon
is of major concern today in relation to the continuous
increase of CO
2
in the atmosphere which contributes to
the general rise of the world temperature [7]. Several
research projects are being conducted to study CO
2
flux-
es for different forest types around the world [1]. This
study is part of a cooperative research project in which
measurements of CO
2
fluxes at the tree and stand levels
Ann. For. Sci. 58 (2001) 1–13 1
© INRA, EDP Sciences, 2001
* Correspondence and reprints
Tel. (33) 03 83 39 40 41; Fax. (33) 03 83 39 40 34; e-mail:
N. Le Goff and J M. Ottorini
2
are conducted in a beech stand to investigate the eco-
physiological factors governing carbon uptake and
growth of trees [24]. Biomass increment estimations are
compared with the carbon balance resulting from photo-
synthesis and respiration processes in a companion paper
[17].
Root systems are a major compartment of forest
stands in terms of accumulated biomass and yearly bio-
mass increment. Root biomass represents 15 to 20% of
total biomass as estimated for forests in the United States
[6, 23] and 19 to 36% of total biomass as revealed by the
carbon budget of the Canadian forest sector [23]. Root
biomass proportion depends on the species and ecologi-
cal conditions, but it may also depend on silvicultural
treatments and environmental change [22]. Therefore,
root biomass and root biomass increment need to be esti-
mated carefully in any attempt to quantify carbon
sequestration in trees and to compare the carbon incorpo-
rated annually in trees to the carbon balance resulting
from ecophysiological processes.
Biomass equations have been established recently for
beech [2, 32]. However, these equations only concern
the aerial compartments of trees (stem, branches and
leaves). This paper presents a set of biomass and bio-
mass increment equations which can be used to estimate
the root biomass and root biomass increment of beech
trees in the experimental stand under study. These equa-
tions are used to estimate the root biomass and the root
biomass increment at stand level. The results obtained
for the aerial parts of trees in the same stand will be pre-
sented in another paper so as to develop here with
enough details the methods used for the study of root
biomass and biomass increment.
2. MATERIALS AND METHODS
2.1. Study site
The study was conducted over two years (1996 and
1997) in the state forest of Hesse, located in the East of
France, about 80 km east of Nancy (48°40' N, 7°05' E;
altitude 300 m). The climate is semi-continental: mean
annual temperature averages 9.2 °C and total annual pre-
cipitation averages 820 mm.
The experimental stand – 0.6 ha in surface – belongs
to a management unit treated as high forest, 30 years old
approximately in 1996 (table I). Beech represents about
80% of the stems of the stand; other tree species repre-
sented are hornbeam (Carpinus betulus), silver birch
(Betula pendula), sessile oak (Quercus petraea), wild
cherry (Prunus avium), ash (Fraxinus excelsior) and
European Larch (Larix decidua). The main stand charac-
teristics before 1996 growing season were as follows: the
mean stand density is about 3500 stems ha
–1
, corre-
sponding to a basal area of 15.5 m
2
ha
–1
. The mean
height and the dominant height of the stand reached
respectively 13 and 15 m, while the mean diameter and
the dominant diameter of the stand were 7.6 and 15.3 cm
at breast height (1.30 m) respectively.
The topography of the experimental stand and of the
surrounding area is relatively flat with a gentle slope to
the south. The parent material is clay or sandstone with a
loam layer of varying depth. The soil is covered with a
mull-type humus.
2.2. Stand measurements
The experimental stand was divided into 60 plots of
approximately 0.01 ha. Among these 60 plots, a sample
of 12 plots was selected on a regular basis, but avoiding
particular areas (a track crossing the stand and parts of
the borders). These plots were used to inventory the
stand after 1996 and 1997 growing seasons by measuring
the girth and height of all the trees of each plot.
However, a complete tree girth inventory of all the trees
in the experimental stand was also performed before
1996 growing season [24].
The stand structure was characterized with Kraft clas-
sification to depict the social status of trees [28]. Four
crown classes were recognized in the stand (dominant,
codominant, intermediate and suppressed). Examination
of trees of each crown class allowed an estimation of the
girths corresponding to the lower bounds of the domi-
nant, codominant and intermediate tree classes. On this
basis, the inventory of the total stand revealed the fol-
lowing distribution of trees among crown classes [24]:
19.8% dominant (crown class 1), 33.0% codominant
(crown class 2), 21.0% intermediate (crown class 3) and
30.9% suppressed (crown class 4).
2.3. Tree sample
The proportional sampling of each crown class yield-
ed the same number of trees in each of the four crown
classes. Following this sampling scheme, 16 trees were
selected (11 in 1996 and 5 in 1997) outside the experi-
mental stand but in similar site and stand conditions,
equally distributed in each crown class, for a detailed
study of the root system (table I).
Root biomass and biomass increment of beech
3
2.4. Root data collection
The sampled trees were cut at ground level at the end
of the growing season for the biomass study of the aerial
parts of the trees. In the following spring, the root sys-
tems were excavated with a mechanical shovel so as to
minimize loss or breakage of roots. Then, the root sys-
tems were taken away and left on a lawn near the labora-
tory where they were washed to remove soil particles
and exposed to the open air to dry. Subsequently, root
systems were put under cover and placed upside down
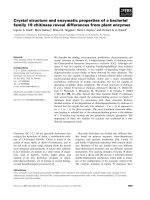
on a flat surface for measurement processing. Roots were
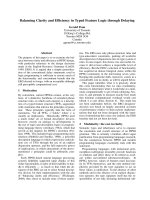
sorted into three size classes (figure 1) depending on the
cross-sectional diameter (d) of the roots [22]: coarse
roots (
d ≥ 5 mm), small roots (2 ≤ d < 5 mm) and fine
roots (
d < 2 mm).
On each root system, samples 10 cm in length (so-
called increment samples) of regular shape, were cut
from coarse and small roots to estimate the current annu-
al volume increments and biomass increments of the root
systems. One increment sample per root was generally
cut, but several could be taken on major roots along the
root length. A total of 106 increment samples were ana-
lyzed, the number of samples per root system being larg-
er on average for trees of dominant (10 per tree) and
codominant crown classes (6 per tree) than for trees of
intermediate and suppressed crown classes (5 per tree).
The length of each root increment sample and their
diameters measured along two perpendicular directions
through the pith, one being the direction of maximal
diameter, were recorded for each end of the increment
samples so as to evaluate the volume of the increment
sample over bark. The annual cross-sectional increments
of both ends were then measured every 45°, starting at
the major axis, by using a travelling stage microscope
with a 0.1 mm precision. On each increment sample sec-
tion, the annual radial increments measured in each
direction were synchronized and the geometric mean of
annual increments was calculated for each section. Then,
the mean annual radial increments of the root samples
were cross-dated for each tree by comparing their pattern
of variation with that of the annual radial increments
measured on the stump section for the study of the aerial
part of trees [20]. This allowed calculating the inside
bark mean diameter of both sections of the increment
samples for the year preceding the current year and the
corresponding volume. The inside bark current annual
volume increment of the increment samples was then
calculated as the difference between the inside bark vol-
umes of the increment samples for the current year and
the previous one.
Table I. Characteristics of the 4 sampled trees in each crown
class (mean and standard deviation sd).
Crown Age DBH Height
class* (years) (cm) (m)
mean sd mean sd mean sd
1 35 7 13.9 4.4 15.1 1.4
2 31 5 7.6 1.1 13.0 0.6
3 31 5 5.9 0.3 11.6 0.8
4 24 3 4.0 0.8 8.7 1.0
* Crown class: 1: dominant; 2: codominant; 3: intermediate; 4: sup-
pressed.
Figure 1. Diagram of a beech root sys-
tem with roots of various size classes and
a missing root end (in gray) whose bio-
mass characteristics are to be estimated.
A root increment sample is also shown.
N. Le Goff and J M. Ottorini
4
Although the root systems were excavated with cau-
tion, many roots were broken during excavation and
remained in the soil. Corrections for this loss of biomass
were obtained by tallying the diameters at the broken
ends and then applying a regression of root weight on
root end diameter to the tally of broken root ends, fol-
lowing the method reported by Santantonio [30]. In addi-
tion, specific relations were established to evaluate the
contribution of each root category to this missing bio-
mass. The diameters of broken root ends were measured
outside bark at the point of breakage, in two perpendicu-
lar directions including the major axis. Unbroken root
ends were sampled on each root system and cut at one,
two or three points so as to obtain unbroken root ends of
different diameters from a given sampled root end. For
each resulting piece of the unbroken root ends sampled,
the two perpendicular diameters at the cut end were mea-
sured outside bark, and the roots were sorted into the
three size classes defined for biomass measurements.
The root systems were oven-dried to a constant
weight at 105 °C, and the dry weight of each root catego-
ry – coarse, small and fine – was recorded separately for
each root system.
The term “biomass” will be used afterwards to refer to
the sum of wood dry weight and bark dry weight.
2.5. Root data processing
2.5.1. Biomass equations for missing root ends
First, a general equation for the roots of the different
categories was established with the pooled sample of
unbroken root ends, to relate the biomasses of root ends
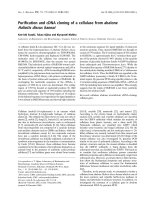
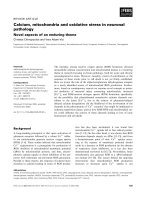
to the diameter at their origin. A linear model was
adjusted to root biomass data, after a two-sided logarith-
mic transformation (table III, figure 2):
ln(trb) = 3.0096 + 2.0949ln(d) (1)
where
trb is the total biomass of the root end (g) and d is
the mean diameter at the origin of the root end (cm).
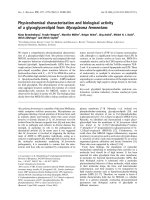
Then, for each sample root end, the biomass of each
root category was expressed as a fraction of the total root
end biomass and related to the diameter
d (cm) of the
root end (
tables II and III, figure 3).
For each tree root system, the missing biomass was
estimated for each root category from the diameter
inventory of broken roots with equation (1) and equa-
tions (2), (3) and (4) for coarse roots, equation (1) and
equations (5) and (6) for small roots and equations (1)
and (7) for fine roots. Equation (1) was inversely trans-
formed and the biomass values obtained were multiplied
by a factor equal to the exponential of the half mean
square error for bias correction [13]. The estimations
obtained for missing biomass were added to the biomass
quantities measured to obtain the biomass of each root
system sampled per root category.
Figure 2. Relationship between the total biomass of a root end
and the mean diameter of the cross-section at the base of the
root end.
Table II. Equations established for the different biomass fractions of the sample root ends classified in root categories.
Root end category Fractions of total root biomass (trb, g)
coarse root biomass (crb, g) small root biomass (srb, g) fine root biomass (frb, g)
Coarse roots (
d ≥ 0.5 cm) (2) (3) frb = trb – (crb + srb) (4)
Small roots (0.2 ≤
d < 0.5 cm) 0 (5) frb = trb – srb (6)
Fine roots (d < 0.2 cm) 0 0 frb = trb (7)
srb
trb
= 0.97354 –
0.1560
d
srb
trb
= 0.04543 +
0.19979
d
crb
trb
= 0.91206 –
0.36505
d
Root biomass and biomass increment of beech
5
The biomass estimated for missing root ends of a tree
represented about 13% of the biomass measured for the
different root systems excavated, but large variations
occurred, the percentage varying from 5 to 35% between
trees.
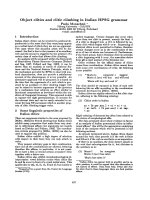
2.5.2. Biomass increment relations
The relative annual volume increment of root incre-
ment samples appeared to be independent of the root
cross-sectional area towards the stump side (figure 4a),
but dependent on the crown class of the sampled trees
(figure 4b).
Thus, for each crown class, we can write:
(9)
where
v
i
and dv
i
are the volume and the annual volume
increment of an elementary part of the root system
respectively, and k a constant. If V is the volume of the
whole root system of a tree, then:
(10)
and the annual volume increment dV of the whole root
system is:
(11)
which can be written using equations (9) and (10):
(12)
which gives:
(13)
The median of the relative annual volume increments of
the increment samples of each crown class was then used
as an estimate of the relative annual volume increment of
the whole root system of the trees of the given class, i.e.:
k = 0.084 for dominant trees, 0.067 for codominant trees,
0.051 for intermediate trees and 0.043 for suppressed
trees. Approximating the wood density of all parts of the
dV
V
=
k.
dV
=
kv
i
Σ
=
kv
i
Σ
=
kV
dV
=
dv
i
Σ
V
=
v
i
Σ
dv
i
v
i
=
k
Table III. Statistics of the biomass equations established for
sample root ends (
se: standard error of the predicted values; df:
degrees of freedom; R
2
: determination coefficient).
Equation se df R
2
1 0.1580 103 0.86
2 0.1143 86 0.60
3 0.0870 86 0.44
5 0.1442 13 0.76
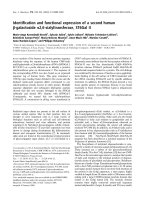
Figure 3. Coarse root biomass fraction (a) and small root bio-
mass fraction (b) in relation to the inverse of the basal diameter
of the root end for coarse roots (equations (2) and (3)). Small
root biomass fraction (c) in relation to the inverse of the diame-
ter of the root end for small roots (equation (6)).
N. Le Goff and J M. Ottorini
6
root system by a constant value, the relative annual root
biomass increment is equal to the relative annual volume
increment. Thus, the annual biomass increment of the
root systems of sampled trees was calculated as the prod-
uct of tree root biomass (coarse and small roots) by the
relative annual root biomass (volume) increment charac-
teristic of the crown class of the trees.
Fine root production, although an important part of
annual root biomass production [22] could not be
obtained from root systems analyzed at a given date
(time of excavation) as fine root mortality and produc-
tion occur all along the year [21]. However, an estima-
tion of fine root production could be calculated at the
stand level by using an annual turnover ratio of 0.6 and
using the method devised by MacClaugherty et al. [26]
to estimate annual fine root production. The turnover
ratio, defined here as the ratio between the production of
fine roots during the growing season and the biomass of
living fine roots at the end of the growing season, was
derived from data obtained by Farque on the same site
(unpublished data).
2.6. Root data analysis
2.6.1. Biomass and biomass increment of root systems
Relationships between tree dimensions and biomass
data were investigated. DBH appeared to be the best pre-
dictor of root system biomass and biomass increment, as
is commonly found for the biomass of aerial tree com-
partments [2, 14, 16, 25, 32, 37] and also for the few
studies dealing with root systems [9, 30]. Generally, lin-
ear relationships can be adjusted after a two-sided loga-
rithmic transformation [2, 4, 30, 35]. These transforma-
tions were applied to the dependent variable (biomass
and biomass increment) and to the independent variable
(DBH). Apart from the linearization of the relation, the
log transformation homogenized the variance of the
residuals. These properties gave good conditions for
adjusting the relations with the linear least squared
regression method.
To obtain biomass and biomass increment estimations
from the above equations, an inverse transformation was
Figure 4. (a) Relative annual volume growth rate in relation to basal cross sectional area for the samples of small and coarse roots
from trees of all crown classes. The regression line close to horizontal reveals the independence of both variables (b) Boxplots of the
relative annual volume growth rates of the root samples for each tree crown class. The line within each box represents the median of
relative annual volume increments for each crown class. Values outside the error bars (10% to 90% of the values) are shown as indi-
vidual points. Each box contains 50% of the observed values within the limits of first and third quartile.
Root biomass and biomass increment of beech
7
applied and the values obtained were multiplied by a fac-
tor equal to the exponential of the half mean square error
for bias correction [13].
2.6.2. Extension of biomass data at stand level
Biomass and biomass increment of roots at the stand
level were calculated for years 1996 and 1997 with the
equations adjusted between tree root biomass, biomass
increment and DBH, and the DBH inventories. The
results obtained with the inventory of trees carried out in
the whole experimental stand before the 1996 growing
season and the results obtained with the partial inventory
of the 12 sample plots realized after the growing season,
were compared. Biomass and biomass increment were
related to DBH before the growing season in the first
case, and to DBH after the growing season in the second
case. This comparison revealed an over-estimation of
stand characteristics when the inventory was based on
the 12 sample plots. The biomass and biomass increment
values obtained from the partial inventory based on the
12 sample plots had to be multiplied by a correction fac-
tor of 0.8 to match the values obtained with the complete
inventory. This correction factor was applied to the esti-
mations of root biomass and biomass increment for year
1997, as the inventory of trees was only done on the
12 subplots for that year.
3. RESULTS
3.1. Tree level
For each tree analyzed, the following data were
obtained: biomass of each root category – coarse, small
and fine – and total root system biomass, current annual
biomass increment of coarse and small roots (table IV).
The total annual biomass increments do not comprise
fine root production, which was not estimated at the tree
level.
3.1.1. Biomass and biomass increment equations
Root biomasses and root biomass increments of trees
were linearly related to DBH after a two-sided logarith-
mic transformation (table V).
No statistical difference was found between the para-
meters of the above equations adjusted separately for the
tree samples of years 1996 and 1997 and the parameters
adjusted with the data of all the trees pooled.
3.1.2. Biomass distribution
The biomass and biomass increments of the different
root categories – coarse, small and fine – were expressed
Table IV. Biomass and biomass increment values obtained from the analysis of the root systems of 4 sample trees in each crown class
(mean, standard deviation sd) and allocated to the different root fractions (coarse roots, small roots and fine roots).
Crown Biomass (kg) Biomass increment (kg year
–1
)
class
Coarse roots Small roots Fine roots Total Coarse roots Small roots Total*
Mean sd Mean sd Mean sd Mean sd Mean sd Mean sd Mean sd
1 18.9 15.7 1.2 1.0 1.0 0.7 21.1 17.3 1.6 1.3 0.1 0.1 1.7 1.4
2 3.4 1.4 0.3 0.2 0.3 0.1 4.0 1.7 0.2 0.1 0.02 0.01 0.2 0.1
3 1.6 0.1 0.18 0.02 0.16 0.01 1.9 0.1 0.08 0.01 0.009 0.001 0.09 0.01
4 0.7 0.3 0.09 0.03 0.07 0.03 0.8 0.3 0.03 0.01 0.004 0.001 0.03 0.01
* Total biomass increment does not include fine root biomass increment that could not be quantified at tree level.
Table V. Regression coefficients and statistics of the root bio-
mass and biomass increment equations which follow the form
ln Y (kg) = a + b ln DBH (cm).
Categories a b se df R
2
Biomass
Total –3.8219 2.5382 0.1316 14 0.99
Coarse roots –4.1302 2.6099 0.1356 14 0.99
Small roots –5.4415 2.0820 0.2284 14 0.95
Fine roots –5.7948 2.1609 0.2884 14 0.94
Biomass increment
Total –7.7313 3.0579 0.1633 14 0.99
Coarse roots –7.9314 3.1106 0.1711 14 0.99
Small roots –9.1765 2.5528 0.2128 14 0.97
N. Le Goff and J M. Ottorini
8
as fractions of total root system biomass in relation to
DBH by using the equations established in Section 3.1.1
(figure 5).
It appears that the proportion of coarse roots – in terms
of biomass – increases slightly with tree DBH and tree
dominance (figure 5a). On the contrary, the proportion of
small and fine roots decreases with increasing DBH and
tree dominance. The same pattern of variation was
observed with biomass increments of coarse and small
roots (figure 5b).
3.2. Stand level
3.2.1. Biomass and biomass increment
The stand biomass and the biomass increments of each
root category and of the entire root systems were calcu-
lated for 1996 and 1997 (table VI). Coarse roots consti-
tute the major part of the root system biomass; small root
and fine root biomass each represent a similar amount.
Root biomass increased from 1996 to 1997 with stand
Figure 5. Contributions of the root biomass (a) and biomass increment (b) of each root category (coarse, small and fine) to the total
per tree, in relation to DBH. The profiles of the mean trees of crown classes 1 to 4 (trees of diameter equal to the median of the diam-
eters of trees in each crown class) are represented at the same scale and situated on the X-axis according to the diameter of the mean
trees in each crown class. The following tree characteristics are represented: total height, height to the base of live crown, height and
width of the crown at its maximum extension.
Root biomass and biomass increment of beech
9
age. The relative contribution of the different root cate-
gories to root biomass increment show the same pattern
as for root biomass, except that the fine roots seem to
contribute much more than the small roots to root bio-
mass increment.
3.2.2. Biomass distribution among crown classes
The contribution of trees of different crown classes to
the biomass and biomass increment of the stand was
derived from the necessary equations and from the diam-
eter inventory of trees with distinction of crown classes.
The contribution of each crown class to root biomass and
root biomass increment and the contribution of each root
category in each crown class are illustrated for year 1996
(figure 6).
It appears that trees belonging to the dominant crown
class contribute for about 60% to stand root biomass (
fig-
ure 6a). Moreover, dominant and codominant trees con-
tribute together to more than 80% to stand root biomass;
intermediate and suppressed trees reveal then a low con-
tribution to stand root biomass. This pattern is even
emphasized for root biomass increment distribution,
dominant and codominant trees contributing together to
about 90% to stand biomass increment (figure 6b). The
contribution of coarse roots to stand root biomass and
biomass increment appears predominant in each crown
class.
4. DISCUSSION AND CONCLUSION
4.1. Tree root biomass and biomass increment
The excavation of the root systems of the sampled
beech trees caused the loss of some parts of the root sys-
tem. However, the biomass equations established from
pooled data of a sample of seemingly complete roots from
several root systems allowed the estimation of the bio-
mass of missing parts of each root system by root catego-
ry. The equations established between root biomass frac-
tions of sampled root ends and the diameter of the root
ends show that coarse root biomass fraction decreases
with root section diameter down to 0.5 cm which is the
limit for coarse roots (figure 3a). Small root biomass frac-
tion increases with root section diameter up to 0.5 cm
(figure 3c) and then decreases at the same time as coarse
roots biomass fraction increases (figure 3b). Missing
parts represented a varying proportion of the measured
root system biomass of trees: for 50% of trees, missing
parts represented between 10 and 20% of the measured
root biomass. The estimation of the biomass of missing
root parts appears essential when the excavation method
Table VI. Root biomass amounts and root biomass increments
of the experimental beech stand in Hesse forest for 1996 and
1997.
Biomass Biomass increment
Root (ton ha
–1
) (ton ha
–1
year
–1
)
fractions
1996 1997 1996 1997
Coarse roots 13.759 15.100 0.996 1.133
Small roots 1.138 1.209 0.078 0.086
Fine roots* 0.968 1.033 0.581 0.620
Total 15.863 17.335 1.655 1.839
* Fine root biomass increment at stand level was estimated from data on
fine roots dynamics obtained in the same site (see Sect. 2.5.2.).
Figure 6. Contributions of root biomass (a) and of root biomass
increment (b) of the trees of each crown class – dominant (1),
codominant (2), intermediate (3) and suppressed (4) – to the
total, at stand level. The contribution of each root category
(coarse roots, small roots and fine roots) in each crown class is
also represented. (Fine root biomass increment could not be rep-
resented for each crown class as it was estimated at stand level).
N. Le Goff and J M. Ottorini
10
is used to extract root systems: the proportion of missing
root biomass estimated is in the range of the one observed
with old-growth Douglas-fir trees [30].
The treatment of pooled available data obtained from
root samples taken on each sampled tree revealed the
independence of root biomass increment relatively to root
diameter. This allowed the estimation of root biomass
increment of coarse roots and small roots of each root
system by multiplying the root biomass of each root cat-
egory by the mean relative root biomass increment of
each crown class.
Tree DBH proved a good predictor of root biomass
and root biomass increment for the different root cate-
gories and for the entire root system of beech in the con-
ditions of the experimental stand. This is consistent with
already published results on beech and other species [8,
30]. For beech, an allometric relationship between total
root biomass and DBH was fitted to the data published by
Pellinen [29]. For this study, taking place in Germany, a
sample of 8 trees was selected in two close beech high
forest stands aged 100 and 115 years old and situated on
a calcareous plateau with limited soil depth (around
30 cm). The root biomass estimated for the 8 sampled
trees is thought to be underestimated due to the rather
rough methods employed for root system extraction and
to the nature of the bedrock [29]. Nevertheless, the rela-
tionship established with Pellinen’s data appears reason-
ably consistent with the equation established for total root
system biomass in the study site of Hesse (table V and fig-
ure 7). These results suggest that individual root biomass
of beech might be estimated confidently from tree DBH.
Data from trees of a larger range of age classes and sites
are necessary to obtain a more reliable relationship.
Tree root biomass increases with tree dimension
(tables I and IV, figure 7), varying from 1 to 45 kg in the
range of sampled trees representative of the different
crown classes of the experimental stand. In the same
range, the root biomass increment of trees varies between
0.04 and 3.6 kg year
–1
.
Data on root systems of beech are scarce. Figure 7,
which represents the relations between total root biomass
and DBH for trees of different ages (30 years old for this
study and about 100 years old for Pellinen’s study [29]),
suggests that total root biomass is closely linked to tree
dimensions and is independent of tree age, agreeing with
previously published results [8].
The root biomass distribution patterns show that large
trees in the stand had a higher proportion of coarse roots
than smaller ones (figure 5). As dominance classes are
closely linked to diameter classes, this means also that
dominant trees invest relatively more biomass in coarse
roots as compared to trees of lower social status. This
may be related to mechanical constraints, which impose
Figure 7. Comparison of the biomass equation established in this study for the whole root system of beech with the equation fitted
from data of 8 trees analyzed by Pellinen [29] in Germany.
Root biomass and biomass increment of beech
11
a relatively greater development of structural roots in
larger trees to ensure their stability and anchorage in the
soil [34]. The decline of fine root proportion with total
root biomass – or with tree DBH – was also observed by
Kurz [23] from data of different studies on hardwoods
and softwoods.
Fine root biomass was certainly underestimated
because it is difficult to record and measure missing ends
of fine roots and then obtain a corrected value of the fine
root biomass measured on excavated root systems.
However, this missing biomass should represent a very
small part of the total root system biomass. It must also
be recalled that fine root biomass may vary all along the
year in relation to fine root turnover [21, 31]. However, in
the study site of Hesse, the data obtained by Epron et al
[12] showed that the living fine root biomass varied only
slightly during the growing season.
4.2. Stand root biomass and biomass increment
Root biomass equations together with stand diameter
distribution allowed the estimation of the total stand root
biomass and biomass increment of the experimental
stand. Stand root biomass reached 16 to 17 tons ha
–1
,
whereas stand root biomass increment reached 1.6 to
1.8 tons ha
–1
year
–1
. Biomass data on root systems are
scarce and few are available for beech stands. For stands
aged between 100 and 116 years old on good productivi-
ty sites in Germany, Pellinen [29] found a root biomass
of 50 to 60 tons ha
–1
and a root biomass increment of 0.7
to 0.8 tons ha
–1
year
–1
(excluding fine root turnover). For
a beech stand aged 145 years old on a site of high pro-
ductivity in Belgium, Duvigneaud and Kestemont [11]
estimated a stand root biomass of 74 tons ha
–1
and a root
biomass increment of 1.86 tons ha
–1
year
–1
. Obviously,
root biomass increases with stand age as it is the case for
aboveground biomass [2]; root biomass variations may be
due also to differences in site fertility. Root biomass
increment data are relatively comparable for the different
stands considered, if we estimate a fine root turnover of
0.5 to 0.6 ton ha
–1
year
–1
to be added to stand root bio-
mass increment measured in the case of Pellinen’s study
[29]. This means that root system biomass continues to
increase at a steady rate with age, but also that the rate of
increase of root system biomass decreases dramatically
when the stands get older.
Stand root biomass increment in 1997 exceeded that of
1996 by 11%, which may be the result of several factors:
the natural rise of biomass increment with age at this
stage of stand development, the probable underestimation
of tree mortality from 1996 to 1997 and the better grow-
ing conditions in 1997 as compared to those of 1996. A
higher net ecosystem CO
2
exchange over the forest was
thus observed for year 1997, probably related to a lower
water stress during this year [18].
Coarse roots contribute most to total root system bio-
mass whereas small roots and fine roots contribute very
little to total root biomass. However, it appears that fine
root biomass of beech stands may vary considerably from
site to site and with stand age (
table VII). Moreover, large
differences can occur for the same site depending on the
methods employed to estimate fine root biomass, as that
was the case for the Hesse study site. However, with
Table VII. Fine root biomass and biomass increments in the total soil profile (except for the site of Aubure, depth of 0–40 cm) for
pure beech stands in different regions.
Region and source of data Stand age Upper diameter Standing root biomass Annual root biomass
(years) limit for fine increment
roots (mm) Method (g m
–2
) Method (g m
–2
)
Hesse (NE-France) 30 2
–this study excavation 96.8 soil cores 58.1
–same site [12] soil cores* 800.0 in-growth cores** 130.0
Veluwe (Netherlands) [19] 38 2 soil cores 720.0 - -
64 2 soil cores 960.0 - -
Hautes Fagnes (Belgium) [36] 90 1 soil cores 117.8 soil cores 382.0
5 soil cores 151.5 soil cores 439.0
Solling (Germany) [27] 120 2 soil cores 255.2 - -
Solling (Germany) [5] 145 2 soil cores 379.0 in-growth cores 390.0
Aubure (Vosges-France) [33] 150 1 soil cores 83.0 soil cores 137.0
* Soil coring is performed at different sampling dates so as to evaluate an average biomass of living roots and calculate a yearly production of fine
roots from the observed dynamics of live and dead roots.
** With in-growth cores, root production is measured from the recolonization of soil cores after the soil has been first cleared of pre-existing roots and
replaced afterwards in its original situation.
N. Le Goff and J M. Ottorini
12
regards to the carbon budget, fine root production is much
more important than standing fine root biomass [22]. The
fine root biomass increment estimated for the experimen-
tal stand represented 1/3 of the total stand root biomass
increment. Nevertheless, this estimate of fine root bio-
mass increment seems low compared to the value
obtained by Epron et al. [12] in the same site with a dif-
ferent approach (table VII). As for standing biomass, fine
root biomass increment varies widely from stand to stand,
tending to increase with stand age, except perhaps for the
site of Aubure, but not all the soil profile was considered
in this case (table VII).
The root biomass distribution that was observed
among tree crown classes, revealed the major contribu-
tion of dominant and codominant trees to stand root bio-
mass, whichever root category was considered. Although
the lower crown canopy was represented by a large num-
ber of trees in the stand – trees from crown classes 3 and
4 represent more than 50% of the total number of trees of
the stand – these trees are characterized by a low annual
root biomass increment and crown classes 3 and 4 repre-
sent a small proportion of stand root biomass increment.
Thus, it appears that trees from these crown classes can
survive in the stand but seem unable to increase their root
biomass, the most part of the products from photosynthe-
sis probably being allocated to the maintenance of the dif-
ferent tree compartments.
Acknowledgements: This study was supported by
funds from the Office National des Forêts (O.N.F.,
France). The authors thank R. Canta and L. Garros
(“Croissance et Production”, INRA, Nancy) for technical
assistance; they are also indebted to B. Clerc and F.
Willm (“Écophysiologie Forestière”, INRA, Nancy) for
field assistance. We also wish to thank L. Farque for pro-
viding access to the data that she collected in the experi-
mental stand studied for analyzing the dynamics of fine
roots of beech. Finally, our thanks go to the two anony-
mous reviewers for their constructive comments and
English corrections, which helped us greatly to improve
the manuscript.
REFERENCES
[1] Baldocchi D., Valentini R., Running S., Oechel W.,
Dahlman R., Stategies for measuring and modeling carbon
dioxide and water vapor fluxes over terrestrial ecosystems,
Global Change Biol. 2 (1996) 159–168.
[2] Bartelink H.H., Allometric relationships for biomass and
leaf area of beech (
Fagus sylvatica L.), Ann. Sci. For. 54 (1997)
39–50.
[3] Bartelink H.H., A model of dry matter partitioning in
trees, Tree Physiol. 18 (1998) 91–101.
[4] Baskerville G.L., Use of logarithmic regression in the
estimation of plant biomass, Can. J. For. Res. 2 (1972) 49–53.
[5] Bauhus J., Bartsch N., Fine-root growth in beech (
Fagus
sylvatica
) forest gaps, Can. J. For. Res. 26 (1996) 2153–2159.
[6] Birdsey R.A., Methods to estimate forest carbon storage,
in: Sampson R.N., Hair D. (Eds.), Forests and global change,
Vol. 1: Opportunities for increasing forest cover, American
Forests, Washington D.C., 1992, pp. 255–261.
[7] Cannell M.G.R., Growing trees to sequester carbon in the
UK: answers to some common questions, Forestry 72 (1999)
237–247.
[8] Drexhage M., Chauvière M., Colin F., Nielsen C.N.N.,
Development of structural root architecture and allometry of
Quercus petraea, Can. J. For. Res. 29 (1999) 600–608.
[9] Drexhage M., Colin F., Estimating root system biomass
from breast-height diameters using literature derived data,
Forestry (submitted).
[10] Duchaufour Ph., Pédologie 1. Pédogénèse et
Classification, 2nd edn., Masson, Paris, 1983.
[11] Duvigneaud P., Kestemont P., Productivité biologique
en Belgique, Duculot, Gembloux, 1977, 617 p.
[12] Epron D., Farque L., Lucot E., Badot P.M., Soil CO
2
efflux in a beech forest: the contribution of root respiration,
Ann. For. Sci. 56 (1999) 289–295.
[13] Flewelling J.W., Pienaar L.V., Multiplicative regression
with lognormal errors, For. Sci. 27 (1981) 281–289.
[14] Gallego H.A., Santa Regina I., Rico M., Biomass equa-
tions and nutrient distribution for
Quercus pyrenaica Willd.
Forests, Mésogée 53 (1993) 75–82.
[15] Gholz H.L., Grier C.C., Campbell A.G., Brown A.T.,
Equations for estimating biomass and leaf area of plants in the
Pacific Northwest, Oreg. State Univ. For. Res. Lab., Research
Paper No. 41, 1979.
[16] Gower S.T., Grier C.C., Vogt D.J., Vogt K.A.,
Allometric relations of deciduous (
Larix occidentalis) and ever-
green conifers (
Pinus contorta and Pseudotsuga menziesii) of
the Cascade Mountains in central Washington, Can. J. For. Res.
17 (1987) 630–634.
[17] Granier A., Ceschia E., Damesin C., Dufrêne E., Epron
D., Gross P., Lebaube S., Le Dantec V., Le Goff N., Lemoine
D., Lucot E., Ottorini J M., Pontailler J.Y., Saugier B., Carbon
balance of a young beech forest over a two-year experiment,
Funct. Ecol. 14 (2000) 312–325.
[18] Granier A., Biron P., Lemoine D., Water balance, tran-
spiration and canopy conductance in two beech stands, Agric.
For. Meteorol. 100 (2000) 291–308.
[19] Hendricks C.M.A., Bianchi F.J.J.A., Root density and
root biomass in pure and mixed forest stands of Douglas-fir and
Beech, Netherlands J. Agric. Sci. 43 (1995) 321–331.
[20] Krause C., Morin H., Changes in radial increment in
stems and roots of balsam fir (
Abies balsamea (L.) mill.) after
defoliation by spruce budworm, For. Chron. 71 (1995)
747–754.
[21] Kurz W.A., Kimmins J.P., Analysis of some sources of
error in methods used to determine fine root production in forest
Root biomass and biomass increment of beech
13
ecosystems: a simulation approach, Can. J. For. Res. 17 (1987)
909–912.
[22] Kurz W.A., Significance of shifts in carbon allocation
patterns for long-term site productivity research, in: Dyck W.J.,
Mees C.A. (Eds.), Proceedings of IEA/BE A3 Workshop,
Research strategies for long-term site productivity, Seattle, WA,
August 1988, Report No. 8, Forest Research Institute, New
Zealand, Bulletin 152 (1989).
[23] Kurz W.A., Beukema S.J., Apps M.J., Estimation of
root biomass and dynamics for the carbon budget model of the
Canadian forest sector, Can. J. For. Res. 26 (1996) 1973–1979.
[24] Lebaube S., Le Goff N., Ottorini J M., Granier A.,
Carbon balance and tree growth in a Fagus sylvatica stand, Ann.
For. Sci. 57 (2000) 49–61.
[25] Leonardi S., Santa Regina I., Rapp M., Gallego H.A.,
Rico M., Biomass, litterfall and nutrient content in
Castanea
sativa
coppice stands of southern Europe, Ann. Sci. For. 53
(1996) 1071–1081.
[26] MacClaugherty C.A., Aber J.D., The role of fine roots
in the organic matter and nitrogen budgets of two forested
ecosystems, Ecology 63 (1982) 1481–1490.
[27] Meyer F.H., Göttsche D., Distribution of root tips and
tender roots of Beech, in: Integrated Experimental Ecology –
Methods and Results of Ecosystem Research in the German
Solling Project, Springer-Verlag, Berlin, 1971, pp. 48–52.
[28] Oliver C.D., Larson B.C., Overview of stand develop-
ment patterns, in: Forest stand dynamics, John Wiley & Sons
Inc., New York, 1996, pp. 145–170.
[29] Pellinen P., Biomasseuntersuchungen im Kalk-
buchenwald, Dissertation Universität Göttingen, Germany,
1986, 134 p.
[30] Santantonio D., Hermann R.K., Overton W.S., Root
biomass studies in forest ecosystems, Pedobiologia 17 (1977)
1–31.
[31] Santantonio D., Hermann R.K., Standing crop, produc-
tion and turnover of fine roots on dry, moderate, and wet sites
of mature Douglas-fir in Western Oregon, Ann. Sci. For. 42
(1985) 113–142.
[32] Santa Regina I., Tarazona T., Calvo R., Aboveground
biomass in a beech forest and a Scots pine plantation in the
Sierra de la Demanda area of northern Spain, Ann. Sci. For. 54
(1997) 261–269.
[33] Stober C., Eckart G.A., Persson H., Root growth and
response to nitrogen, in: Schulze E D. (Ed.), Carbon and nitro-
gen cycling in European forest Ecosystems, Ecological Studies
142 (2000) Springer-Verlag, Heidelberg.
[34] Stokes A., Guitard D., Tree root response to mechanical
stress, in: Altman A., Waisel Y. (Eds.), The biology of root for-
mation and development, Basic Life Sciences, Plenum
Publishing Corporation, New York, 65 (1997) 227–236.
[35] Thies W.G., Cunningham P.G., Estimating large-root
biomass from stump and breast-height diameters for Douglas-fir
in Western Oregon, Can. J. For. Res. 26 (1996) 237–243.
[36] Van Praag H.J., Sougnez-Remy S., Weissen F., Carletti
G., Root turnover in a beech and a spruce stand of the Belgian
Ardennes, Plant and Soil 105 (1988) 87–103.
[37] Wang J.R., Zhong A.L., Simard S.W., Kimmins J.P.,
Aboveground biomass and nutrient accumulation in an age
sequence of paper birch (
Betula papyrifera) in the Interior
Cedar Hemlock zone, British Columbia, For. Ecol. Manage. 83
(1996) 27–38.
To access this journal online:
www.edpsciences.org