Báo cáo khoa học: "Leaf morphological differentiation between Quercus robur and Quercus petraea is stable across western European mixed oak stands" pptx
Bạn đang xem bản rút gọn của tài liệu. Xem và tải ngay bản đầy đủ của tài liệu tại đây (653.54 KB, 11 trang )
A. Kremer et al.Leaf morphological variation in European oaks
Original article
Leaf morphological differentiation between Quercus robur and
Quercus petraea is stable across western European mixed oak stands
Antoine Kremer
a*
, Jean Luc Dupouey
b
, J. Douglas Deans
c
, Joan Cottrell
d
, Ulrike Csaikl
e
,
Reiner Finkeldey
f
, Santiago Espinel
g
, Jan Jensen
h
, Jochen Kleinschmit
i
, Barbara Van Dam
j
,
Alexis Ducousso
a
, Ian Forrest
d
, U. Lopez de Heredia
k
, Andrew J. Lowe
c
, Marcela Tutkova
e
,
Robert C. Munro
c
, Sabine Steinhoff
i
and Vincent Badeau
b
a
Institut National de la Recherche Agronomique (INRA), Unité de Recherches Forestières, BP 45, 33611 Gazinet Cedex, France
b
Institut National de la Recherche Agronomique (INRA), Unité d’Écophysiologie Forestière, 54280 Champenoux, France
c
Centre for Ecology and Hydrology, Edinburgh, (CEH), Bush Estate, Penicuik, Midlothian, EH26 0QB, Scotland, U.K.
d
Forestry Commission (FC), Forest Research, Northern Research Station, Roslin, Midlothian, EH25 9SY, Scotland, U.K.
e
Austrian Research Centre (ARCS), Seibersdorf, 2444, Austria
f
Swiss Federal Research Institute WSL, Zürcherstrasse 111, Birmensdorf, Switzerland
g
NEIKER A.B., Granja Modelo-Arkaute, 01080 Vitoria-Gasteiz, Spain
h
Danish Forest and Landscape Research Institute (DFLRI), Hørsholm Kongevej, Hørsholm 2970, Denmark
i
Niedersächische Forstliche Versuschsanstalt Fortamstr. 6, 34355 Staufenberg-Escherode, Germany
j
ALTERRA, Green World Research Institute, Wageningen, The Netherlands
k
ETSI Agrarias, Universidad de Valladolid, Avda Madrid 57, 34004 Palencia, Spain
(Received 2 April 2001; accepted 8 November 2001)
Abstract – Leaf morphology was assessed in nine mixed oak stands (Quercus petraea and Q. robur) located in eight European countries.
Exhaustive sampling was used in an area of each stand where the two species coexisted in approximately equal proportions (about 170 trees/spe
-
cies/stand). Fourteen leaf characters were assessed on each of 5 to10 leaves collected from the upper part of each tree. Three multivariate statisti
-
cal techniques (CDA, canonical discriminant analysis; PCA, principal component analysis; MCA, multiple correspondence analysis) were used
in two different ways: first on the total set of leaves over all stands (global analysis) and second, separately within each stand (local analysis).
There was a general agreement of the results among the statistical methods used and between the analyses conducted (global and local). The first
synthetic variable derived by each multivariate analysis exhibited a clear and sharp bimodal distribution, with overlapping in the central part.
The two modes were interpreted as the two species, and the overlapping region was interpreted as an area where the within-species variations
were superimposed. There was no discontinuity in the distribution or no visible evidence of a third mode which would have indicated the exis
-
tence of a third population composed of trees with intermediate morphologies. Based on petiole length and number of intercalary veins, an “easy
to use” discriminant function applicable to a major part of the natural distribution of the species was constructed. Validation on an independent
set of trees provided a 98% rate of correct identification. The results were interpreted in the light of earlier reports about extensive hybridization
occurring in mixed oak stands. Maternal effects on morphological characters, as well as a lower frequency or fitness of hybrids in comparison
with parent species could explain the maintenance of two modes, which might be composed of either pure species or pure species and introgres
-
sed forms.
morphology / leaf / Quercus robur / Quercus petraea / taxonomy
Résumé – La différenciation morphologique des feuilles entre Quercus robur et Quercus petraea est stable à travers les peuplements mé
-
langés de chênes de l’ouest européen. La variabilité de la morphologie foliaire a été etudiée dans neuf peuplements mélangés de chênes (Quer
-
cus petraea et Q. robur) en Europe sur la base d’un échantillon exhaustif moyen de 170 arbres/espèce/peuplement. Trois méthodes d’analyses
multivariables ont été utilisées (ACD : analyse canonique discriminante ; ACP : analyse en composantes principales ; AFC : analyse factorielle
des correspondances). Les trois méthodes aboutissent à des résultats congruents. La première variable synthétique de chaque méthode se
Ann. For. Sci. 59 (2002) 777–787
777
© INRA, EDP Sciences, 2002
DOI: 10.1051/forest:2002065
* Correspondence and reprints
Tel: +33 5 57 97 90 74; fax: +33 5 57 97 90 88; e-mail:
caractérise par une distribution bimodale, chaque mode correspondant à une espèce. La distribution de la première variable ne manisfeste pas de
discontiunuité pouvant indiquer l’existence d’un troisième groupe, correspondant à des arbres avec des morphologies de type intermédiaire. Une
méthode d’identification rapide basée sur les deux caractères les plus discriminants (nombre de veines intercalaires et longueur du pétiole) a été
proposée et validée sur un autre jeu de données (98 % d’identifications correctes). La structure de la variation morphologique entre les deux es
-
pèces résulte sans doute de l’hybridation entre elles, et de l’hérédité des caractères morphologiques.
morphologie / feuille / Quercus robur / Quercus petraea / taxonomie
1. INTRODUCTION
Morphological variation in mixed oak stands composed of
Quercus petraea and Quercus robur has been of general in
-
terest in Europe for decades. The two species commonly co
-
exist in mixed stands and foresters need rapid “easy to use”
morphological screening methods which would help to dis
-
criminate between the species [9, 10, 14]. Dendrologists re
-
quire classification criteriafor taxonomic purposes [3, 17,18,
22, 25]. Forest biologists and ecologists seek unambiguous
traits which could be used for studying introgression between
these two interfertile species [15, 28, 29, 34]. The vast
amount of literature devoted to morphological variation in
mixed oak stands demonstrates the debate that has been
raised. In addition to efforts to define the most appropriate
morphological traits to be assessed [2, 26, 30, 31], investiga-
tions have been conducted on relevant statistical methods
[11, 12, 20]. However these reports have not led to general
agreement on the methods and traits to be used for distin-
guishing Quercus petraea from Q. robur, mainly because no
comparative studies were conducted across different coun-
tries. Key issues in the controversy were also the sampling
and analytical methods for assessing morphological variation
between two interfertile species, and particularly, the inclu
-
sion or not, of trees exhibiting intermediate “morphologies”.
In several cases, investigations were made on trees that were
a priori selected as belonging to groups with contrasting
morphologies, purposely excluding ambiguous trees. Sam
-
pling procedures or data analyses based on a priori grouping
inevitably introduced circularity in the taxonomic assign
-
ment procedure. Alternative methods for species identifica
-
tion have been explored in recent years using either isozymes
[4, 32, 35] or molecular techniques [7, 23, 24]. These meth
-
ods generally assume that species separation was known and
were used to compare frequencies of genetic markers be
-
tween the two species. In these studies, the original informa
-
tion used for species separation was leaf or fruit morphology,
and we were back to the initial problem. Even for molecular
markers to be used, there is a need for clarification of species
distinction between Q. petraea and Q. robur based on mor
-
phological traits.
Our contribution is an attempt to provide a unifying
method to assess morphological variation for species recog
-
nition that would be applicable across countries and forests.
This investigation formed a necessary step in a project aimed
at comparing gene diversity between the two species in
different European countries. As there was no general agree
-
ment on a method for taxonomic assignment of temperate
oaks, we combined protocols available in the literature in or
-
der to design a standard procedure which could be applied in
widely separated forests for taxonomic assignment prior to
the gene diversity investigation. With this general aim, we
proceeded in three successive steps. First we compared
multivariate statistical methods for the discrimination of
trees according to their leaf morphology. At this stage, there
was no a priori classification of the oak trees in two or three
groups. Only trees were the units to be separated. In a second
step, we verified that the morphological variation of trees
based on the statistical methods used was independent of geo-
graphical region. The procedure was therefore based on sam-
ples originating from widely separated stands throughout
western Europe. Lastly, we constructed a discriminant func-
tion that could be applied as an operational “easy to use” pro-
cedure over a wide geographic range for species recognition.
Finally, this function was tested on a totally independent set
of trees.
2. MATERIALS AND METHODS
2.1. Study stands
Nine mixed stands of Q. petraea and Q. robur were sampled in
9 regions of western Europe. The criteria used in the selection of the
stands were age, composition and size and origin. Only adult stands
of several hundred trees were selected. The stands were chosen so
that the two species were present in approximately equal propor
-
tions, if possible. All adult trees within a delineated area of the stand
were used for the morphological assessment: the sampling was ex
-
haustive, with no a priori selection of trees. The exception to this
rule was the stand of Salinasco, where local constraints did not per
-
mit studies to proceed as an exhaustive sampling. All other stands
contained on average 369 oak trees within the study area (table I). In
total 3025 trees were used for the leaf morphological assessment.
Only stands issued from natural origin were included in the sam
-
pling.
2.2. Assessment of leaf morphological traits
Up to 10 (usually 5) fully expanded leaves were sampled in the
mid- to upper crown of the trees. Asfaraswaspracticable, they were
insect and disease free, and were collected from the first flush of the
year. In total 16055 leaves were measured. The protocol of leaf
778 A. Kremer et al.
morphology assessment was based upon [16, 30] with some modifi
-
cations aimed at simplifying the procedure. The following variables
were assessed on each leaf.
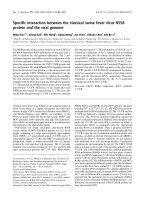
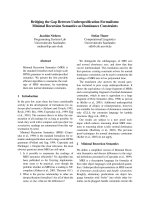
2.2.1. Five dimensional characters (figure 1a)
Lamina length (LL), petiole length (PL), lobe width (LW), sinus
width (SW), length of lamina at largest width (WP). WP and LW
were measured at the tip of the widest lobe of the leaf.
2.2.2. Two counted variables
Number of lobes (NL): total number of lobes including those on
the right and the left part of the leaf, except the terminal lobe (irri
-
gated by the midrib). A lobe was considered to be present when it
was clearly irrigated by an axillary vein. There was no size limit to a
lobe.
Number of intercalary veins (NV): an intercalary vein was a sec-
ondary vein irrigating a sinus and extending at least half way from
the midrib to the base of the sinus.
Leaf morphological variation in European oaks 779
Table I. Main characteristics of the 9 mixed oak stands.
Country Site Latitude Longitude Total number
of trees
Stand age Stand area (ha) Number of trees with
5 or more leaves
Average number
of leaves per tree
Austria Sigmundsherberg 48
o
41’ N 15
o
45’ E 395 100 4.5 395 5.1
Denmark Hald Ege 56
o
25’ N 9
o
21’ E 355 150 2.3 355 5.1
England Roudsea Wood 54
o
13’ N 3
o
20’ W 272 > 90 8 218 4.7
France Petite Charnie 48
o
05’ N 0
o
10’ W 422 90 5.8 83 3.5
Germany Escherode 51
o
20’ N 9
o
24’ E 321 145 5 321 10.0
Holland Meinweg 51
o
07’ N 6
o
44’ E 380 250 1 373 5.0
Scotland Dalkeith 55
o
55’ N 3
o
02’ W 399 500 10 399 5.0
Spain Salinasco Mendia 42
o
58’ N 2
o
33’ W 77 > 100 2.5 77 5.0
Switzerland Buren 47
o
07’ N 7
o
23’ E 404 > 150 9 390 5.0
Total 3025 2611 5.3
LL
PL
WP
LW
SW
Observation of PU
Intercalary vein
a
Figure 1. (a) Description of the dimensional leaf morphological traits in Quercus petraea and Q. robur. LL: lamina length; PL: petiole length;
LW: lobe width; SW: sinus width; WP: length of lamina from base to widest point; PU: abaxial laminar pubescence. (b) Scoring of the basal
shape of the lamina (BS) of Quercus petraea and Q. robur.
b
2.2.3. Two observed variables
– Basal shape of the lamina (BS): this was scored as an index
varying from 1 to 9 as indicated in figure 1b.
– Abaxial laminar pubescence (PU): a scoring of the density of
pubescence was made using Kissling’s grading system from 1 (no
pubescence) to 6 (dense hairiness) [16]. Pubescence was assessed
with a stereomicroscope (×30) and took into account both stellate
and simple hairs.
2.2.4. Five transformed variables
Lamina shape or obversity (OB): OB = 100 × WP/LL
Petiole ratio (PR): PR = 100 × PL / (LL + PL)
Lobe depth ratio (LDR): LDR = 100 × (LW–SW)/LW
Percentage venation (PV): PV = 100 × NV/NL
Lobe width ratio (LWR): LWR = 100 × LW/LL
2.3. Data analysis
Three different multivariate procedures were used for analyzing
the data: (i) canonical discriminant analysis (CDA) of the 14 origi
-
nal variables, using the tree as the classification variable; (ii) princi
-
pal component analysis (PCA) of the 14 variables; (iii) multiple
correspondence analysis (MCA) of the 14 variables, each variable
being divided into 15 classes of nearly equal weight [6]. The three
methods aimed at combining the original variables into independent
synthetic variables that explained the greatest part of the total varia-
tion observed among the trees. The units that were discriminated
were the trees: there was no a priori grouping into two or any other
number of groups. The differences among the different methods
were related to the criteria used to construct the synthetic variables:
– In CDA, the synthetic variables (canonical variates) were lin-
ear combinations of the original variables, constructed so that the ra-
tio (variance between trees / variance within trees (between leaves))
was maximal. Variables taking integer values only, such as counted
variables, could introduce bias in the calculation because within tree
variance was frequently null. This was the case for pubescence,
which displayed a null variance among leaves in half of the sample
of trees. Thus, this variable was discarded from all CDA analyses.
– In PCA, the synthetic variables (principal components) were
also linear combinations of the original variables (mean values of
the five leaves per tree) that were constructed so that they displayed
the largest variance between trees. Computations were performed
on the correlation matrix between original variables.
– In MCA, the synthetic variables (principal axes of inertia or
factorial axes (Benzécri, 1992)) also had the largest variance be
-
tween trees. Computations were performed on the indicator matrix
with trees as rows and categories of variables as columns. In contrast
to PCA, the synthetic variables included non linear relationships be
-
tween the original variables.
The three multivariate methods were then applied in two differ
-
ent ways:
– on the overall data set using all 3025 trees of the 9 sites (global
analysis). In this case, CDA was based on the 14 variables ×
16055 leaves, PCA on the 14 × 14 correlation matrix computed from
the 14 × 3025 trees table, and MCA on the 14 variables × 3025 trees
table, each variable being divided into 15 classes of nearly equal
weight;
– on each separate study stand (local analysis). The three statis
-
tical methods were applied separately within each stand by using
only the data of that stand (but maintaining the same 15 classes
boundaries for all variables in MCA across all sites).
3. RESULTS
3.1. Leaf size effect
Because the data originated from widely separated stands,
it was suspected that the original variables might be affected
by the size of the leaves. Hence the correlation between LL
(Lamina length) and all other traits was computed at the leaf
level over the whole data set (table II). As expected, the di
-
mensional traits showed positive correlations, whereas all
other traits were not influenced by size effects. There was
however, an important variation between dimensional traits:
LW and WP were strongly correlated with LL, whereas SW
and PL were only moderately correlated. The transformation
of the original variables, which consisted mostly in taking ra
-
tios between dimension traits, reduced the correlations as can
be seen by the low correlations between OB, PR, LDR and
LWR with LL. An interesting observation was that the mor
-
phological traits that were traditionally used in the literature
for species separation (PL or PR, NV or PV, BS) showed only
weak correlations with LL.
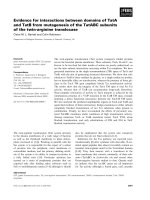
3.2. Multivariate analyses over the whole data set
(global analysis)
The three methods were applied over all of the 3025 trees
and the distributions of the synthetic variables were plotted
for each method (figure 2). In each method, the first synthetic
variable contributed to a major part of the total variation
(table III) as expected,but in addition, the next synthetic vari
-
ables (2nd and 3rd) exhibited a much lower contribution.
Whatever the statistical method used, the distribution of the
first synthetic variable showed a bimodal distribution as
shown by figure 2. The whole set of trees was therefore
780 A. Kremer et al.
Table II. Correlation between the variables used and the size of the
leaf (lamina length) at the leaf level (16055 leaves).
Variable Coefficient of Correlation
PL 0.26
LW 0.77
SW 0.45
WP 0.73
NL 0.23
NV 0.09
BS –0.10
PU 0.03
OB –0.07
PR –0.09
LDR 0.07
LWR –0.16
PV 0.02
Leaf morphological variation in European oaks 781
-6
-4
-2
0
2
4
6
8
CDA1
-6 -4 -2 0 2 4 6 8
PCA2
-6
-4
-2
0
2
4
6
8
PCA1
-6 -4 -2 0 2 4 6
-1.5
-1.0
-0.5
0.0
0.5
1.0
1.5
MCA1
-1.0 -0.5 0.0 0.5 1.0
Numbe r o f t r e e s
0
20
40
60
80
100
120
140
CDA1
-6-4-202468
Numbe r o f t r ee s
0
20
40
60
80
100
120
140
160
PCA1
-6 -4 -2 0 2 4 6
Numbe r o f t r e e s
0
20
40
60
80
100
120
140
160
MCA1
-1.0 -0.5 0.0 0.5 1.0
A
B
C
D
E
F
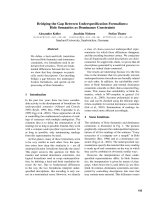
Figure 2. Distribution of the first two synthetic variables according to the different multivariate analyses of leaf morphological traits in Quercus
petraea and Q. robur. A, C and E correspond to the diagram of thetrees along the first two synthetic variables (1st variable as x axis, secondvari
-
able as y axis); B, D and F represents the distribution of the first synthetic variable; A and B: canonical discriminant analysis (CDA1 and CDA2
are the first two synthetic variables of CDA); C and D: principal component analysis (PCA1 and PCA2 are the first two synthetic variables of
PCA); E and F: multiple correspondence analysis (MCA1 and MCA2 are the first two synthetic variables of MCA).
composed of two populations that were partially overlapping
(figure 2). There was a strong similarity between the position
of the trees derived from the three methods, as shown by the
rank correlation of their values for the first synthetic variable
(table IV). CDA provided slightly less congruent results.
3.3. Multivariate analyses within each stand
(local analysis)
The same analyses that were conducted over the whole
data set were applied to each individual stand. Again in each
stand, whatever the statistical method used, the first synthetic
variable showed a bimodal distribution (data not shown). The
bimodality was less apparent in Dalkeith and Hald Ege,
mainly due to the unbalanced representation of the two spe
-
cies in these two stands, as shown later (table VIII). To exam
-
ine whether the distribution of the trees along the first
synthetic variable in the local analysis was congruent with
the distribution observed in the global analysis, the rank cor
-
relations between the first synthetic variables between the
two analyses were computed (table V). These correlations re
-
mained extremely high, except for Hald Ege, suggesting that
the analyses for each stand provided the same distribution
along the first synthetic variables as the analyses conducted
over the whole data set.
3.4. Biological significance of the synthetic variables
The two analyses (over the whole data set, and within each
separate stand) and the three statistical methods, indicated
that the sample of trees that was analysed in this study was
composed of two populations that corresponded to the two
modes observed in figure 2. There was neither discontinuity
in the distribution nor an additional mode that would corre
-
spond to the existence of a third population. However, the
two bell shaped distributions overlapped at their tails. It was
more likely that the overlapping region encompassed the
within population variation rather than corresponding to a
third separate population. In order to characterise the two
populations, we focused on the biological significance of the
first synthetic variables that discriminated the groups, by
computing the correlations between the synthetic and origi-
nal variables for the global analyses (table VI). The original
variables that exhibited the highest correlations with the first
synthetic variable were the same for the three statistical
methods used: petiole length (PL and PR), intercalary vena-
tion (NV and PV), pubescence (PU) and sinus width (SW and
LDR). The basal shape of the lamina (BS) and number of
lobes (NL) contributed moderately to the first synthetic vari-
able. Other morphological variables were only weakly corre-
lated with the first synthetic variable. Interestingly, the
original variables showing the highest correlation with the
first synthetic variables were those that are traditionally used
782 A. Kremer et al.
Table III. Proportion of total variance explained by the first synthetic
variable of the multivariate analyses (CDA: canonical discriminant
analysis; PCA: principal component analysis; MCA: multiple corre
-
spondence analysis).
CDA PCA MCA
Axis 1 46% 37% 2.9%
Axis 2 13% 20% 1.6%
Axis 3 11% 10% 1.3%
Table IV. Spearman rank correlation between the first synthetic vari
-
ables computed with different statistical methods (ID refers to the
dicriminant function based on PL and NV (see text)).
PCA MCA ID
CDA 0.94 0.90 0.97
PCA 0.97 0.94
MCA 0.90
Table V. Spearman rank correlations between the local and global
analyses for the first synthetic variables, for each statistical method
(1).
Stand CDA PCA MCA
Sigmundsherberg 0.97 0.99 0.95
Hald Ege 0.76 0.58 0.64
Roudsea Wood 0.96 0.97 0.83
Petite Charnie 0.99 0.99 0.96
Escherode 0.99 0.93 0.93
Meinweg 1.00 0.99 0.96
Dalkeith 0.86 0.89 0.87
Salinasco Mendia 0.94 0.96 0.93
Buren 0.99 0.98 0.95
(1) Correlations between synthetic variables calculated over the whole data set (global ana
-
lysis) and within each stand separately (local analysis).
Table VI. Correlation between variables and the first synthetic vari
-
able (global analysis).
CDA PCA MCA
LL 0.05 0.25 0.28
PL 0.87 0.82 0.87
LW 0.00 0.13 0.16
SW 0.43 0.74 0.74
WP –0.09 0.03 –0.11
NL 0.50 0.62 0.66
NV –0.74 –0.82 –0.86
BS –0.49 –0.55 –0.61
PU – 0.66 0.70
OB –0.16 –0.30 –0.35
PR 0.89 0.78 0.84
LDR –0.50 –0.75 –0.75
LWR –0.07 –0.18 –0.19
PV –0.76 –0.87 –0.89
for species identification in oaks. Thus, the first synthetic
variable could be interpreted as a gradient between Q. robur
and Q. petraea. There were some slight discrepancies be
-
tween the three statistical methods in regard to the contribu
-
tion of the original variables to the synthetic variables. MCA
and PCA were fully congruent, but the first synthetic variable
in CDA was characterized by a lower contribution of all vari
-
ables except for PL and PR; the contribution of sinus width
(SW or LDR) was especially low in comparison with the
other two methods.
The next synthetic variables (2nd and 3rd) showed a con
-
tinuous distribution in contrast to the first one (data not
shown). The second synthetic variables of MCA and PCA
were mostly correlated with dimensional traits (LL, LW and
WP) and were therefore interpreted as a leaf size gradient. In
the case of CDA, the second synthetic variable was still cor
-
related with traits that exhibited species differences. In sum
-
mary, among the 14 original morphological variables, 7 were
strongly correlated with the first synthetic variable (whatever
the statistical method used), 3 were correlated with the sec
-
ond axis that corresponded to leaf size, and the remaining 4
were distributed among the remaining 12 synthetic variables.
3.5. Operational method for species assignment
Because the three multivariate statistical methods pro-
vided the same bimodal distribution along the species gradi-
ent (figure 2), and because these results were congruent
across stands (table V), we attempted to construct an opera-
tional species assignment procedure, that had the following
criteria (i) easy to use, (ii) applicable across a large geo-
graphic range and (iii) with minimal misclassification.
The following “consensus” clustering procedure was used
in order to define typical Q. robur and Q. petraea trees: for
each of the three multivariate methods separately, trees were
classified as either Q. robur or Q. petraea according to their
position along the first synthetic axis, using the standard k-
means clustering algorithm (procedure FASTCLUS of SAS,
[33]). Then, trees classified in the same species by all three
methods were retained as typical of this species, the other
ones being considered as unclassified trees (4.7% of the total,
table VII). Once again, there was strong agreement between
the three methods, CDA being slightly distinct from MCA
and PCA (table VII). A stepwise discriminant analysis was
performed using these two groups of “typical” trees as the
classification variable. The first discriminant variables
selected were PR, PV, PU and BS, with partial R
2
of 64, 44,
13 and 16% respectively. Only the first two “easy to assess”
variables PR and PV were retained, but we substituted NV for
PV and PL for PR (easier to measure and only slightly less ef
-
ficient). Based on NV and PL, the following discriminant
function for oak identification was proposed:
ID = 357 – (97 × PL) + (205 × NV) (PL in mm).
This function gave positive ID values for Q. robur and
negative values for Q. petraea. The percentage of
misclassifications was as low as 1% in the calibration set of
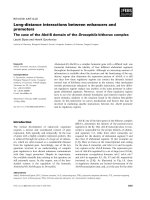
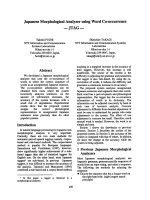
“typical” trees (table VII). Figure 3 shows the distribution
of ID values among all the 3025 trees measured, and figure 4
presents the position of Q. robur and Q. petraea trees (classi
-
fied according to the consensus clustering procedure) as a
function of NV and PL values.
We used a resampling procedure to assess the effect of the
number of leaves on the ID values. Subsamples were built
from the initial total sample by randomly reducing the num
-
ber of leavesper tree to four, three,two or one. New ID values
for each tree were computed using this number of leaves, and
compared with IDvalues based on 5 leaves per tree. The aver-
age tree misclassification percentages over 1000 iterations of
the random selection process increased slowly when the
number of leaves taken into account decreased: 1.1%, 1.8%,
2.9% and 5.6% for four, three, two and one leaves per tree, re-
spectively. However, the intra-specific order of ID values
changed faster when the number of leaves decreased: what-
ever the species, the Spearman rank correlation with ID val-
ues based on 5 leaves per tree were 0.98, 0.95, 0.90 and 0.80,
respectively. A sample of three leaves per tree seemed to be
an optimum compromise.
Finally, the discriminant function was validated using an
independent sample of 773 oaks from northeastern France
[12], a region not covered by the present study. In that study,
trees had been classified as either Quercus robur, Quercus
petraea, Quercus pubescens or intermediate based on a MCA
analysis. Using our discriminant function and 5 leaves per
tree, only 1.6% of the Q. robur and Q. petraea trees were not
correctly classified. Interestingly, 98% of the Q. pubescens
trees were classified as Q. petraea and intermediate trees
were distributed between Q. robur (27%) and Q. petraea
(73%).
The proportion of trees belonging to the Q. robur, Q.
petraea or unclassified groups (according to the consensus
clustering procedure) varied according to the geographic lo
-
cation of the stands (table VIII). Whereas stands from south
-
ern, western and central Europe displayed a very low
proportion of unclassified trees (2% or less), those from The
Netherlands, Denmark and Great Britain had between 5 and
13% unclassified trees. This higher proportion of unclassi
-
fied trees in northern stands was due to a higher morphologi
-
cal similarity between trees from the two species in these
stands than elsewhere in Europe. Q. petraea trees from north
-
ern stands had shorter petioles than in other parts of Europe
Leaf morphological variation in European oaks 783
Table VII. Percentage of the total number of trees (3025) not classi
-
fied in the same species when using two different methods (ID refers
to the discriminant function based on PL and NV).
PCA MCA ID
CDA 4.7% 4.2% 3.8%
PCA 1.1% 3.5%
MCA 3.1%
784 A. Kremer et al.
Number of
trees
0
10
20
30
40
50
60
70
80
90
100
110
120
130
140
150
160
ID value
-2000 -1000 0 1000 2000
NV
0
2
4
6
8
10
12
PL
0 5 10 15 20 25 30 35
Figure 3. Distribution of the discriminant function values according to the species. Each tree was assigned to either Q. petraea or Q. robur when
the three multivariate methods provided congruent results. When there was a discrepancy among the methods the tree was considered as unclas-
sified (see text).
Figure 4. Distribution of the 3025 trees according to petiole length (PL, horizontal axis) and number of intercalary veins (NV, vertical axis).
Q. petraea (ᮀ); Q. robur (∨); Unclassified (). The line represents the zero value of the discriminant function separating the two species.
(11.3 and 15.2 mm respectively), while Q. robur displayed
greater pubescence (3.6 and 1.4, respectively).
4. DISCUSSION
The three multivariate statistical methods clearly demon-
strated that the 9 mixed oak stands that were analyzed in this
study consisted of 2 populations, as indicated by the bimodal
distribution of the synthetic variables. A closer examination
of the morphological characters included in the synthetic
variables showed that the two modes in the double bell
shaped curves corresponded to Q. petraea and Q. robur. The
conclusions of this study were reinforced by the congruence
of the results across sites. Whether the data were analyzed
separately within each site or on the total set of leaves over all
sites, the same results were obtained: the bimodality was ob-
served within each analysis and the distribution of the trees
for the first synthetic variables were highly correlated among
the local and global analysis (table V). The only exceptions to
this were Hald Ege (in Denmark) and, to a lesser extent, Dal
-
keith (in Scotland), because of an unbalanced distribution of
trees between the two species (in each case, more than 90% of
the trees belonged to one species). The robustness of the re
-
sults was also due to the congruence of the conclusions drawn
from three separate multivariate analyses (table IV). There
were only a few discrepancies among the three methods, par
-
ticularly between CDA and the two other methods (MCA and
PCA). Because CDA also included the within tree variation,
it was less affected by the “noise” due to sampling of leaves
within trees. As a result, among the three statistical methods
tested, CDA provided slightly more congruent results be
-
tween the global and local analyses (table V). These results
were comparable with other investigations using multivariate
analysis conducted in various parts of western Europe ([14]
in the centralpart of France; [12] in the eastern part of France;
[15] in the Netherlands), central Europe ([1] in Germany and
Poland) and eastern Europe [8], although they differed in
their sampling strategy. All these case studies also showed a
strong bimodal distribution of the synthetic variables.
The sharp bimodality does not provide evidence for the
existence of a third population composed of intermediate
phenotypes. The general picture of the total diversity of leaf
morphology in the Q. petraea – Q.robur oak complex was
rather the coexistence of two populations with some overlap
-
ping in theirmorphological distribution (figure 2), rather than
the coexistence of three populations, the additional one being
composed of intermediate phenotypes. If a third population
had to be defined it would have to rely on some a priori limits
that would be difficult to identify from the distribution on the
synthetic axis (figure 1). Alternatively, it could be based on
morphological variables other than the ones we used in this
study, although we took into account most of the leaf mor
-
phological variables known to discriminate between the two
species. Our data rather suggested that trees exhibiting inter
-
mediate phenotypes corresponded actually to either
Q. petraea or Q. robur or to introgressed forms. If the two
species have been sympatric over several generations, re
-
peated backcrosses would have resulted in a complete spec
-
trum of introgressed forms and consequently to a continuous
range of morphological variation that is no more distinguish
-
able from the intraspecific variation. This raised the question
of species assignment in the overlapping region of the distri-
butions (figure 2). There was a region of uncertainty in the
tails of the distributions, where species assignment was sub-
ject to error. A statistical procedure to estimate the error rate
could be calculated after fitting theoretical distribution
curves to the empirical distribution observed in figure 2.An
alternative way would have been to include additional diag-
nostic characters available for taxonomic identification. In a
number of different reports intermediate phenotypes have re-
ceived special attention, first by delineating a specific class
of intermediate phenotypes in comparison to reference popu-
lations [13, 15, 30] and then by designating these trees as
introgressed forms. Natural hybridization has been shown by
mating system analysis with gene markers in natural mixed
populations [5, 21]. Depending on the marker system used
(isozymes or microsatellites) the species and the pollination
season, the estimated rate of hybridization varies from 3% to
32%. Furthermore, interspecific hybridization was also dem
-
onstrated by controlled crossings; [19] reported from 5 to
13% success in interspecific crossing experiments as com
-
pared to 17% to 20% for within species success. However
there was no experimental evidence that introgressed forms
exhibited intermediate morphology. In a review of plant hy
-
bridization, [27] challenged the usual assumption of hybrid
intermediacy for morphological characters. In their survey,
they noticed that hybrids were a mosaic of phenotypes with
parental and intermediate characters rather than just interme
-
diate ones; they stated that “from a systematic perspective,
the unpredictability of hybrid character expression dimin
-
ishes the utility of morphological characters for hybrid iden
-
tification”. Observations exploring these ideas were made in
F1 families of interspecific crosses between Q. petraea and
Q. robur [20]. These authors showed that F1 juvenile hybrids
(2 to 5 years old) exhibited leaf morphologies that were
Leaf morphological variation in European oaks 785
Table VIII. Percentage of trees in each species and stand according
to the consensus clustering procedure.
Stand Quercus petraea unclassified Quercus robur
Sigmundsherberg 57 2 41
Hald Ege 94 5 1
Roudsea Wood 65 13 21
Petite Charnie 47 2 51
Escherode 34 2 65
Meinweg 41 11 49
Dalkeith 3 7 91
Salinasco Mendia 60 0 40
Buren 19 2 79
similar to the female parent rather than intermediate, whether
the female parent was Q. petraea or Q. robur. At least at the
juvenile stage, these maternal effects suggested that F1 hy
-
brids did not exhibit intermediate phenotypes. However ob
-
servations on older material that could have sustained the
same conclusions are missing. Maternal effects could de
-
crease as trees get older, and hybrids could exhibit intermedi
-
ate phenotypes at the mature stage. An alternative
interpretation to our results, in comparison to the extensive
hybridization that has been observed, was disruptive selec
-
tion. If there were numerous hybrid seedlings produced, and
if local site conditions favored parental phenotypes, hybrids
would have been progressively eliminated as the stand grew
older. There is no existing experimental data supporting that
hybrids were selected against. However there are numerous
reports of a higher proportion of trees with intermediate
morphologies at the edges of the natural distribution, particu
-
larly under northern latitudes [10, 25], and our results con
-
firmed this. If one accepted that intermediate morphologies
corresponded to introgressed trees despite the review by [27],
and that hybrids had higher fitness in new environmental con
-
ditions, than Cousens’ and Olsson’s observations could indi
-
cate that disruptive selection could vary according to site
conditions.
To sum up, our conclusions about the separation of mixed
stands in two populations (the two bell shaped curves in fig-
ure 1) corresponding to the two species based on adult leaf
morphology, were not in contradiction with the occurrence of
natural hybridization. Either hybrids did not persist until the
adult stage due to disruptive selection, or, hybrids exhibited
parental morphologies even at the mature stage. However,
the genetic compositionof the two populations thatwe identi-
fied with the multivariate statistical techniques, would have
been quite different according to the inheritance of the leaf
morphological traits and the existence or not, of disruptive
selection. If there was disruptive selection, whatever the in
-
heritance of leaf morphology traits was, the two populations
would have been composed of pure species with no
introgressed forms. If morphological traits exhibited pre
-
dominantly maternal effects and there was no disruptive se
-
lection, then the two populations would have been composed
of different genetic entities, pure species and introgressed
forms. If there was biparental inheritance and no disruptive
selection, then the intermediate trees would have been
introgressed forms and there would have been three popula
-
tions (the two parental ones plus the introgressed forms, the
latter being infrequent or indistinguishable from the two oth
-
ers). Further investigations based on a common assessment
of molecular markers of species differences and leaf mor
-
phology, as well as the study of hybrid fitness in mixed
stands, are needed in order to choose among these alterna
-
tives.
Acknowledgements: The study has been carried out with finan
-
cial support from the Commission of the European Communities,
Agriculture and Fisheries (FAIR) specific RTD programme, CT-
FAIR 1 PL95–0297, “Synthetic maps of gene diversity and prove
-
nance performance for utilization and conservation of oak genetic
resources in Europe”. It does not necessarily reflects its views and in
no way anticipates the Commission’s future policy in this area. We
are grateful to Cathleen Baldwin, Jan Bovenschen, Fabienne
Bourquin, Cédric Demeurie, Viggo Jensen, Adrian Jordan, Gert
Kranenborg, Thomas Küno, Jean Marc Louvet, to the technical Re
-
search Unit of the Forestry Commisssion and INRA for assistance in
labelling, mapping trees, and measuring leaf morphology, to Tom
Connolly for statistical advice during the comparative analysis of
data sets, and to the owners of the forests for giving access to the
study stands.
REFERENCES
[1] Aas G., Taxonomical impact of morphological variation in Quercus ro
-
bur and Q. petraea: a contribution to the hybrid controversy, Ann. Sci. For. 50
(1993) 107–114.
[2] Aas G., Die Behaarung der Blätter von Traubeneiche und Stieleiche
(Quercus petraea und Quercus robur): Variabilität und taxonomische Bedeu
-
tung, Mitt. Fortsl. Versuchanst. Rheinland-Pfalz 34 (1995) 297–309.
[3] Aas G., Friedrich K., Untersuchungen zur morphologischen Unters
-
cheidung von Stiel-und Traubeneicheln, Forstw. Cbl. 110 (1991) 349–357.
[4] Bacilieri R., Ducousso A., Kremer A., Genetical, morphological, eco
-
logical and phenological differentiation between Quercus petraea (Matt.)
Liebl. and Q. robur L. in a mixed stand of northwest of France, Silvae genet.
44 (1995) 1–10.
[5] Bacilieri R., Ducousso A., Petit R.J., Kremer A., Mating system and
asymmetric hynridization in a mixed stand of European oaks, Evolution 50
(1996) 900–908.
[6] Benzécri J.P., Correspondence analysis handbook, Dekker M., New
York, 1992, 665 p.
[7] Bodénès C., Joandet S., Laigret F., Kremer A., Detection of genomic
regions differentiating two closely related oak species Quercus petraea
(Matt.) Liebl. and Q. robur L., Heredity 78 (1997) 433–444.
[8] Borovics A., Separability of pedunculate oak and sessile oak aggre
-
gate: a contribution to the hybrid and small species estimation, Proceedings of
the Forest Research Institute 89 (1999) 93–110.
[9] Carlisle A., Brown A.M.F., The assessment of the taxonomic status of
mixed oaks (Quercus ssp.) populations, Watsonia 6 (1965) 120–127.
[10] Cousens J.E., Variation of some diagnostic characters of the sessile
and pedunculate oaks and their hybrids in Scotland, Watsonia 5 (1963)
273–286.
[11] Dupouey J.L., Le Bouler H., Discrimination morphologique des
glands de chênes sessile (Quercus petraea (Matt.) Liebl) et pédonculé (Q. ro
-
bur L.), Ann. Sci. For. 46 (1989) 187–194.
[12] Dupouey J.L., Badeau V., Morphological variability of oaks (Quercus
robur L., Quercus petraea (Matt.) Liebl. and Q. pubescens Willd) in northeas
-
tern France: preliminary results, Ann. Sci. For. 50 (1993) 35–40.
[13] Elsner G., Preliminary variability of oak stands (Quercus petraea and
Quercus robur) in northern Germany, Ann. Sci. For. 50 (1993) 228–232.
[14] Grandjean G., Sigaud P., Contribution à la taxonomie et à l’écologie
des chênes du Berry, Ann. Sci. For. 44 (1987) 35–66.
[15] Iestwaart J.H., Feij A.E., A multivariate analysis of introgression bet
-
ween Q. robur and Q. petraea in The Netherlands, Acta Bot. Neerl. 38 (1989)
313–325.
[16] Kissling P., Les poils des quatre espèces de chênes du Jura (Quercus
pubescens, Q. petraea, Q. robur et Q. cerris), Ber. Schweiz. Bot. Ges 87
(1977) 1–18.
[17] Kissling P., Un réseau de corrélations entre les chênes (Quercus L.)
du Jura, Ber. Schweiz. Bot. Ges. 90 (1980a) 1–28.
[18] Kissling P., Clef de détermination des chênes médio-européens
(Quercus L.), Ber. Schweiz. Bot. Ges. 90 (1980b) 29–44.
786 A. Kremer et al.
[19] Kleinschmit J., Kleinschmit J.G.R., Quercus robur-Quercus petraea:
a critical review of the species concept, Glas. sumske Pokuse 37 (2000)
441–452.
[20] Kleinschmit J.R.G., Bacilieri R., Kremer A., Roloff A., Comparison
of morphological traits of pedunculate oak (Q. robur L.) and sessile oak (Q.
petraea (Matt.) Liebl., Silvae Genet. 44 (1995) 256–269.
[21] Kremer A., Petit R.J., Ducousso A., Structure of gene diversity, gene
flow and gene conservation in Quercus petraea, in: Turok J., Kremer A., de
Vries S. (Eds.), First Euforgen meeting on social broadleaves, IPGRI, 1998,
pp. 133–144.
[22] Minihan V.B., Rushton B.S., The taxonomic status of oaks (Quercus
ssp.) in Breen Wood, Co Antrim, Northern Ireland, Watsonia 15 (1984)
27–32.
[23] Moreau F., Kleinschmit J.R.G., Kremer A., Molecular differentiation
between Q. petraea and Quercus robur assessed by random amplified DNA
fragments, Forest. Genet. 1 (1994) 51–64.
[24] Muir G., Fleming C.C., Schlötterer C., Species status of hybridizing
oaks, Nature 405 (2000) 1016.
[25] Olsson U., A morphological analysis of phenotypes in populations of
Quercus (Fagaceae) in Sweden, Bot. Not. 128 (1975a) 55–68.
[26] Olsson U., The structure of stellate trichomes and their taxonomic im
-
plication in some Quercus species (Fagaceae), Bot. Not. 128 (1975b)
412–424.
[27] Rieseberg L.H., Ellstrand N.C., What can molecular and morphologi
-
cal markers tell us about plant hybridization, Crit. Rev. Plant Sci. 12 (1993)
213–241.
[28] Rushton B.S., Quercus robur L. and Quercus petraea (Matt.) Liebl.: a
multivariate approach to the hybrid problem. 1. Data acquisition, analysis and
interpretation, Watsonia 12 (1978) 81–101.
[29] Rushton B.S., Quercus robur L. and Quercus petraea (Matt.) Liebl.: a
multivariate approach to the hybrid problem. 2. The geographical distribution
of population types, Watsonia 12 (1979) 209–224.
[30] Rushton B.S., An analysis of variation of leaf characters in Quercus
robur L. and Quercus petraea (Matt.) Liebl. population samples from Nor
-
thern Ireland, Irish Forest. 40 (1983) 52–77.
[31] Safou O., Saint Martin M., Le trichome de quelques Quercus périmé
-
diterranéens, Bull. Soc. Bot. Fr. 136 (1989) 291–304.
[32] Samuel R., Pinsker W., Ehrendorfer F., Electrophoretic analysis of
genetic variation within and between populations of Quercus cerris, Q. pubes
-
cens, Q. petraea, and Q. robur (Fagaceae) from eastern Austria, Bot. Acta 108
(1995) 290–299.
[33] SAS Institute Inc., SAS/STAT User’s Guide, Version 6, SAS Insti
-
tute Inc., Cary, NC, 4th ed., Vol. 2, 1989, 1848 p.
[34] Wigston D.L., The distribution of Q. robur L., Q. petraea (Matt.)
Liebl. and their hybrids in southwestern England. 1. The assessment of the
taxonomic status of populations from leaf characters, Watsonia 10 (1975)
345–369.
[35] Zanetto A., Roussel G., Kremer A., Geographic variation of inter-spe
-
cific differentiation between Quercus robur L. and Quercus petraea (Matt.)
Liebl., Forest genet. 1 (1994) 111–123.
To access this journal online:
www.edpsciences.org
Leaf morphological variation in European oaks 787