Báo cáo khoa học: "Density and population structure of the natural regeneration of Scots pine (Pinus sylvestris L.) in the High Ebro Basin (Northern Spain)" ppt
Bạn đang xem bản rút gọn của tài liệu. Xem và tải ngay bản đầy đủ của tài liệu tại đây (183.26 KB, 12 trang )
Original article
Density and population structure of the natural
regeneration of Scots pine (Pinus sylvestris L.)
in the High Ebro Basin (Northern Spain)
Santiago C. González-Martínez
#,
* and Felipe Bravo
Departamento de Producción Vegetal y Silvopiscicultura, University of Valladolid at Palencia,
Avda. de Madrid, 57, 34004 Palencia, Spain
(Received 18 February 2000; accepted 21 August 2000)
Abstract – This paper presents the analysis of 11 natural regenerated stands in native Scots pine forests located in the High Ebro
Basin (Northern Spain). The natural regeneration showed a continuous age distribution, early height differentiation and a high stabili-
ty in the height position of seedlings. Total density and main crop (trees selected for future commercial harvest) density models were
developed to study the relationship between natural regeneration and site variables. Soil sand content was an important ecological
factor distinguishing two groups of plots. Hardwood and Ericaceae species competition were the main factors that explained total
density but only in soils with low sand content. Intensive herbivore grazing was proposed to produce a strong reduction of viable
seedlings. Thus, vegetation-control treatments and limitation of cattle grazing in regeneration areas are highly recommended in the
native Scots pine forests of the High Ebro Basin.
natural regeneration / population structure / Pinus sylvestris / Mediterranean region / Spain
Résumé
– Densité et structure des peuplements de Pin sylvestre (Pinus sylvestris L.) régénérés naturellement dans le Haut-
Bassin de l’Ebre (Nord de l’Espagne).
Dans cet article sont analysés 11 peuplements régénérés naturellement, situés dans les forêts
autochtones de Pin sylvestre du Haut-Bassin de l’Ebre (Nord de l’Espagne). La régénération naturelle a été caractérisée par une dis-
tribution continue de l’âge, une différenciation en hauteur précoce et une stabilité dans les classes de hauteur des plantules. Des
modèles ont été développés pour étudier les relations entre la densité de la régénération naturelle et les variables du site. La densité
totale et la densité moyenne de la récolte (la densité d’arbres sélectionnés qui constitueront la récolte commerciale future) ont été étu-
diées. Le contenu en sable du sol s’est révélé un facteur écologique important, permettant de distinguer deux groupes de sites. La
compétition entre le résineux, les feuilleux et les espèces du genre Ericaceae a représenté le facteur principal qui expliquait la densité
totale, mais seulement dans les sols peu sableux. Le pâturage intensif dû aux herbivores semble avoir produit une forte réduction des
plantules viables. Par conséquent, les traitements pour contrôler la végétation adventice et la limitation du pâturage dans les zones de
régénération sont très recommandés à l’intérieur des forêts autochtones de Pin sylvestre du Haut-Bassin de l’Ebre.
régénération naturelle / structure des peuplements / Pinus sylvestris / région Méditerranéenne / Espagne
Ann. For. Sci. 58 (2001) 277–288 277
© INRA, EDP Sciences, 2001
* Correspondence and reprints
Tel. (34) 91 347 6857; Fax. (34) 91 357 2293; e-mail:
#
Present address: Department of Biotechnology and Breeding, Centre of Forest Research (CIFOR-INIA), P.O. Box 8111, 28080,
Madrid, Spain.
S.C. González-Martínez and F. Bravo
278
1. INTRODUCTION
The demand for natural landscapes, the multi-resource
use of forests and the high cost of plantations focus
European foresters’ attention on natural regeneration [1,
2, 19, 24]. Works studying the population structure and
the main factors affecting natural regeneration in Scots
pine (Pinus sylvestris L.) are abundant in the literature.
Most of them refer to boreal or Atlantic forests whereas
studies in the Mediterranean or Atlantic-Mediterranean
transition context are scarce. The climatic range is
important because it influences the type and structure of
soils, the composition of vegetal communities and the
natural regeneration process. The climate affects the
quantity and quality of seed crop [31] and determines the
elongation of flower primordia [27], flowering phenolo-
gy [20, 36] and pollen dispersal. The climatic factors are
also important during germination and early develop-
ment of seedlings. In Mediterranean forests, the summer
length and climatic irregularity are the main causes of
failure of natural regeneration, so that the combination of
seed production and favourable climatic conditions for
seedling establishment only occurs every 20–40 years
[28, 33]. Other main factors that affect regeneration suc-
cess are herbivory and interspecific competition.
Herbivore grazing reduces population density and height
growth up to 30%, and early growth losses are not made
up with time [12]. Interspecific competition of vegeta-
tion groups like trees and shrubs [14], Ericaceae [17]
and grasses [23] are reported to have different effects
upon natural regeneration so they are studied indepen-
dently in this paper.
The characteristics of natural regeneration of Scots
pine in the southern limit of the distribution area for the
species are poorly studied. Discussion of the important
elements for natural regeneration density can be utilised
to define the silviculture of Scots pine in Mediterranean
areas where low-intensity forest management and in situ
genetic resources conservation have increasing interest
[16, 39]. The aim of this work was: (1) the analysis of
population structure of natural regeneration, (2) the study
of density of Scots pine seedlings in relation to site vari-
ables and (3) the construction of predictive models for
natural regeneration density.
2. MATERIALS AND METHODS
2.1. Site description
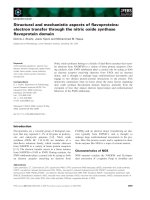
The Scots pine forests studied were situated at
710–910 masl in High Ebro Basin (Northern Spain) cov-
ering 13 000 ha (figure 1). Silviculture in the area is
based on natural regeneration following a shelterwood
system and silvicultural interventions are not frequent at
early stages of development. A site preparation consist-
ing in a light soil scarification was in common practice
in the area from the 1950s to the 1980s and so affected
all the stands older than 10 years. The climate shows
both Atlantic and Mediterranean influences, with an
annual average rainfall of 787 mm (123 mm in summer)
and an average annual temperature of 11.2 °C, without
pronounced droughts (figure 1). The high interannual
variation of temperature and precipitation typical of
Mediterranean climates is moderated by the Atlantic
influence. The soils are calcareous cambisols evolving to
luvisols in humid sites. The floristic community is com-
posed of mixed Atlantic and Mediterranean elements.
Quercus faginea Lamk. and Fagus sylvatica L. appear in
soils with low sand content and some edaphic moisture,
being substituted by Quercus ilex L. in xeric soils. In
sites with a low pH, heather (Daboecia cantabrica
(Hudson) C. Koch., Calluna vulgaris (L.) Hull., Erica
vagans L. and Erica cinerea L.), gorse (Ulex europaeus
L. and Ulex gallii L.) and fern (Pteridium aquilinum (L.)
Kuch.) formations are frequent.
2.2. Measurements
The sample included 11 stands that represented the
ecological variability of the study area (table I). A wide
range of altitude (750–900 masl), slope (8–45%) and
overstorey basal area (1.20–16.80 m
2
ha
–1
), and different
soil types (from cambisols to luvisols) were sampled.
Sampling within the stands was conducted systematical-
ly based on a random start (100 × 100 m grid). A total
number of 80 plots were measured (table I). The plots
were circular with a fixed radius of 2.5 meters (19.6 m
2
).
Age and total height were measured on all Scots pine
seedlings with diameter at breast height (1.30 m) less
than 75 mm. The age of the individuals was assessed by
calculating the number of nodes. In some cases, there
were not a clear differentiation of nodes and the
seedlings were cut in order to estimate the age by ring
counting. The seedlings were scored considering height
position (dominant/codominant/intermediate/suppressed)
and damage by grazing, stamping and pests (healthy/low
damage/moderate damage/highly damaged). The term
“main crop seedling”, that is the trees selected to become
a component of a future commercial harvest, referred to
those seedlings with the highest score in both variables
(dominant and healthy). The Stocked Quadrats method,
with quadrats size of 4.9 m
2
, was used for stocking esti-
mation. In this method, plots are divided in four quarters
(the quadrats) and stocking is defined as the percentage
of quadrats with at least one healthy and dominant
seedling [26].
Natural regeneration of Scots pine
279
The site variables measured were classified into phys-
iographic data (altitude, slope and aspect), edaphic data
(texture and thickness of the humus layer), vegetation
data (cover and mean height of different vegetation
groups), and forest management data (residual basal
area, distance from the nearest seed source and soil
preparation). The description of site variables is shown
in
table II. Soil was evaluated following a field categori-
cal method based on moistened samples collected at
20 cm depth [30]. Four sand content categories were dif-
ferentiated: below 40%, between 40 and 65%, between
65 and 80% and higher than 80%. Some samples
(18.75%) were also analysed in the laboratory in order to
check the accuracy of field estimations. Cover of the dif-
ferent groups of plants was visually scored using
schematic diagrams illustrating covers from 0 to 100%
Figure 1. Walter-Lieth Climate
Diagram and location map show-
ing High Ebro Basin and its posi-
tion related to the boundary
between Atlantic and Mediter-
ranean climates (dotted line) in
Spain. The shadow area in the map
indicates the native Northern
Iberian distribution of Scots pine.
Climate Diagram legend; dark
shading: period of relative
drought; light shading: period of
relative humid season; T: annual
average temperature; P: annual
average rainfall; k: relative
drought period/relative humid
period ratio; a: period of relative
drought in months.
Table I. Description of the stands.
Stand Area Number Overstorey basal Altitude Slope Aspect
number (ha) of plots area (m
2
ha
–1
) (masl) (%)
1 4.30 5 4.30 800 8 S-W-N
2 7.25 8 11.30 885 8 W
3 5.90 6 3.40 750 21 N-E
4 5.20 5 6.12 760 33 N-E
5 11.42 12 3.05 840 9 S-W-N-E
6 4.25 5 1.20 850 36 N
7 8.59 9 1.79 760 11 W-N-E
8 5.03 5 3.00 800 45 S-W
9 6.07 6 1.58 810 15 N
10 8.72 9 1.70 900 24 S-W-N-E
11 10.11 10 16.80 875 16 S-E
S.C. González-Martínez and F. Bravo
280
(5% step) under different spatial patterns. Mean height
of the different groups was measured as follows: for each
group of species the plot was divided into portions each
having roughly constant height, separate mean heights
were obtained for each portion by measuring a sample of
at least 10 individuals (when available), and the values
were combined in a weighted mean [13]. The variable
Time, defined as the number of years from the beginning
of the regeneration process (known by management
records), was used in order to know if density increased,
decreased, or remained constant during the regeneration
period.
2.3. Data analysis
The data analysis was conducted in two steps. The
first step was the analysis of population structure of nat-
ural regeneration. Then, the selection and interpretation
of the main factors that affected density and the con-
struction of predictive models were made.
The population structure of each stand was analysed
by means of total density, main crop density and stock-
ing calculations. Pattern, height and age structure analy-
sis were also performed. Pattern analysis was based on
Blackman’s coefficient [13]. This test makes use of the
equality of mean and variance of the Poisson distribu-
tion. If the ratio of variance to mean is less than one, a
regular pattern is indicated, if greater than one, a
clumped pattern. Deviations from a random spatial pat-
tern were tested using the Student t-test. Height and age
structure analysis was carried out comparing the mean
height of seedlings belonging to consecutive age-classes.
Student t-tests comparing consecutive age-classes were
done for each stand following Schepper [37]. Only age-
classes with more than five trees were included. In addi-
tion, box-and-whisker plots for total height and age dis-
tributions were plotted. The whole set of data (80 plots)
was used is this first step.
Explanatory interpretation of factors affecting density
of natural regeneration was made by multiple regression
analysis, adjusting models between total density and
main crop density, and the site variables in
table II.
Because vegetation variables were strongly correlated
(Pearson’s correlation coefficient higher than 0.75 in
some cases), principal component analysis (PCA) was
used to get a set of independent variables from these
data. The number of factors retained in the PCA was
determined using the factors/eigenvalues plot [15]. Three
principal components, explaining a 69.24% of the total
Table II. Description of the site variables included in the regression models.
Variable Type Range Classes Description
Physiographic data
ALT Quantitative 700–900 – Altitude above sea level (m).
SLO % 0–90 – Slope measured with a clisimeter located in the middle of the plot.
ASP Binary –
asp1 Exposition of the plot, a binary variable that indicates Northern exposition.
Edaphic data
TEXT Categorical – text1 Sand content of the soil following a field categorical method. Dummy variable for sand
content higher than 80%.
–
text2 Sand content of the soil following a field categorical method. Dummy variable for sand
content between 65% and 80%.
–
text 3 Sand content of the soil following a field categorical method. Dummy variable for sand
content between 40% and 65%.
THIC Quantitative 0–9 – Thickness of the humus layer (cm).
Vegetation data
PC 1 Quantitative – –
(1)
Principal Component 1. Related to cover and mean height of hardwood species.
PC 2 Quantitative – –
(1)
Principal Component 2. Related to cover and mean height of Ericaceae plants.
PC 3 Quantitative – –
(1)
Principal Component 3. Related to cover of grasses.
Forest management data
BAS Quantitative 0–31 – Overstorey basal area (m
2
ha
–1
).
DIST Quantitative 1–80 – Distance from the seed source (m).
PREP Binary –
prep1 Site preparation, a binary variable that indicates when site preparation has been made.
TIME Quantitative 0–23 – Time from the beginning of the regeneration process in each stand (years).
(1)
See further explanation in the text.
Natural regeneration of Scots pine
281
variance, were included in the models. Principal
Component 1 (PC 1) had a high correlation with cover
(0.93) and mean height (0.91) of the hardwood species
present in the study area (mainly Quercus faginea,
Quercus ilex and Fagus sylvatica), Principal
Component2 (PC 2) was strongly correlated with the
cover (0.88) and mean height (0.86) of plants of the
Ericaceae group (Daboecia cantabrica, Erica cinerea,
Erica vagans and Calluna vulgaris) and Principal
Component 3 (PC 3) was correlated with the cover
(0.95) of grasses present in each plot (mainly
Brachypodium phoenicoides (L.) Roemer and Schultes,
Dactylis glomerata L., Holcus lanatus L. and
Arrhenatherum elatius (L.) Beauv.). Categorical vari-
ables with k classes were included in the models defining
(k – 1) dummy variables. Starting from the saturated
model where the effect of continuos variables is allowed
to vary across all categories, the significance of interac-
tions was tested by gradually simplifying the model.
Only the dummy variable text1 (soil sand content higher
than 80%) had a significant interaction both in the total
density and main crop density models, thus suggesting
different performance of the quantitative variables for
plots with different sand content. There were not enough
plots, only eight, in sites with high sand content to adjust
any model, so they were dropped for further analysis.
Once the plots that caused the interaction effect were
dropped, the following linear model was constructed:
y =
β
0
+
β
1
x
1
+
β
2
x
2
+ … +
β
n
x
n
+
ε
where y was the total density or main crop density
depending on the model; x
1
, x
2
, … x
n
were the site vari-
ables;
β
0
,
β
1
,
β
2
, …
β
n
were the parameters to estimate;
and
ε
was the experimental error. Linear models were
estimated by weighted least-squares regression. This
method does not alter the model structure and produces a
near-constant variance of the residuals. The weighting
factor was the inverse of the variance. Two thirds of the
data (47 plots, after removing sandy plots) were used for
the final model construction and one-third for its valida-
tion (25 plots).
The normality, linear independence and homogeneity
of variance of the residuals were studied using the
Shapiro-Wilk test, the normal probability plot and the
residual values/predicted values plot. The variables were
transformed, x = (x + 0.5)
0.5
, to approach normality. This
transformation is normally used with data that include
many zero values [13, 38]. Percentage data were nor-
malised using the logit transformation: z = log{p/(1 –
p)}. The logit transformation modifies a variable having
a range 0 to 1 to a variable with no restrictions, similar to
one that is normally distributed. Zero values were
replaced with 25/n and 100-percent values with 100-
(25/n), where n was the sample size [4]. The atypical and
influential points were detected by analysing the
Studentized residuals and Cook’s D, Dfbeta and
Covratio values which measure the effect of an individ-
ual observation on the dependent variable, the regression
coefficients and the variance-covariance matrix of the
parameter estimates, respectively [32]. Validation of the
models was done by studying the distribution, mean and
variance of residuals of 25 plots not used in model con-
struction. SAS
®
version 6.0 program was used for statis-
tical analysis.
3. RESULTS
3.1. Population structure of natural regeneration
The mean total density was 0.51 ± 0.15 seedlings m
–2
,
with a minimum and maximum values of 0.13 and
0.93 seedlings m
–2
, respectively (table III). Main crop
density accounted for 46% of the total density. The
stocking ranged from 18% in Stand 2 to 78% in Stand 7.
Only 20% of plots had full stocking but 45% of plots
were above 50% of stocking. The spatial pattern was
clumped in all sites except in Stand 1, which showed a
regular distribution.
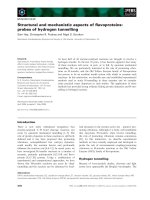
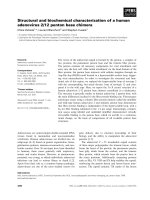
The natural regeneration showed a nearly continuous
age distribution (figure 2). There was a large difference
between minimum and maximum individual tree age in
each stand, with an uppermost range of 19 years
(Stand 8) and 20 years (Stand 7). Although the upper
stratum generally corresponded to the oldest seedlings,
some new individuals had established during late stages
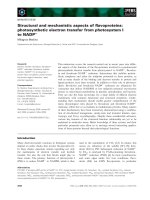
of the regeneration phase. For instance, differences of
10 years between dominant trees could be found in
Stand 9 (figure 3). However, there was a notable differ-
ence in mean height between consecutive age-classes
(19 from 37 t-tests with p < 0.05) indicating a marked
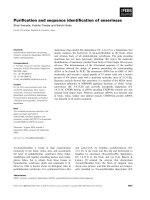
stability of the height position of seedlings. Within each
age, the difference between the upper and the lower
quartile for total height increased with age. In a particu-
lar and extreme case it was found a difference of 2 m in
two seedlings that were both 13 years old (Stand 6).
3.2. Main factors affecting density of seedlings
The saturated models showed an interaction between
soils with sand content higher than 80% (text1) and the
other variables included in the models (table IV; only
variables included in the final predictive models are
shown). This result suggested a different pattern in soils
with sand content above and below 80%. Field
observations showed that the site preparation and the
S.C. González-Martínez and F. Bravo
282
interspecific competition (both important in the plots
with sand content below 80%) were apparently not
affecting natural regeneration density in plots with high
sand content. However, there were not enough plots in
sites with sand content higher than 80% (only eight) to
undertake the modelling of this group and, therefore, no
conclusive results could be obtained. These plots were
removed from the data set to allow the estimation of
main effects in the final predictive models that are only
valid for plots with sand content below 80% (
table V).
The total density model, which accounted for 54% of
the variation, included overstorey and understorey vege-
tation cover and mean height (PC1 and PC2, respective-
ly) and the time from the beginning of the regeneration
process. Total density of natural regeneration was posi-
tively correlated with the time from the beginning of the
regeneration phase and negatively correlated with cover
and mean height of hardwood and
Ericaceae species.
The magnitude of the correlation between each group of
species and total density was similar, as shown by the
parameter estimates. With respect to the main crop
Table III. Main characteristics and population structure parameters of natural regeneration in the study area.
Stand Density Main crop Mean age H
m
Stocking (%) Pattern
(seedlings m
–2
) density (years) (m) 0 25 50 75 100
1 0.23 ± 0.12 0.12 ± 0.07 13.20 ± 2.09 1.94 ± 0.76 0 1 2 0 2 0.69
ns
2 0.13 ± 0.18 0.10 ± 0.13 1.43 ± 1.65 0.05 ± 0.05 4 2 2 0 0 1.84 **
3 0.28 ± 0.10 0.13 ± 0.56 8.00 ± 3.24 1.21 ± 0.50 1 1 0 3 1 2.06 **
4 0.59 ± 0.92 0.52 ± 0.89 4.50 ± 3.25 0.24 ± 0.16 1 1 2 0 1 2.63 **
5 0.50 ± 0.29 0.45 ± 0.29 1.44 ± 0.47 0.12 ± 0.03 2 0 3 3 4 4.31***
6 0.41 ± 0.16 0.14 ± 0.12 10.40 ± 1.71 1.64 ± 0.49 0 0 2 3 0 2.76***
7 0.69 ± 0.32 0.10 ± 0.10 12.07 ± 2.08 0.84 ± 0.29 0 0 3 2 4 4.44***
8 0.33 ± 0.15 0.10 ± 0.10 10.00 ± 5.29 1.14 ± 0.64 1 0 2 2 0 6.27***
9 0.23 ± 0.03 0.09 ± 0.04 18.50 ± 2.81 2.26 ± 0.53 0 1 2 3 0 1.74 *
10 0.93 ± 0.86 0.40 ± 0.45 3.83 ± 2.30 0.29 ± 0.21 3 0 1 3 2 7.03***
11 0.82 ± 0.62 0.38 ± 0.31 3.60 ± 1.66 0.25 ± 0.14 3 1 2 1 3 10.49***
H
m
: Mean height; Stocking: Number of plots with 0, 25, 50, 75 and 100% stocking. Pattern: Blackman’s coefficient and test of deviation from random
distribution.
Table IV. Saturated models showing interaction effects between the dummy variable text1 (soils with sand content higher than 80%)
and the variables included in the final predictive models for total density and main crop density.
Model (Adj–r
2
) Variable d.f. Parameter estimate Standard error t
TOTAL DENSITY CONSTANT 1 10.714 2.129 0.0388
(
0.3988) TIME 1 2.075 0.846 0.0181
PC 1 1 –11.496 5.503 0.0424
PC 2 1 –5.652 5.432 0.3037
Text1 1 222.066 62.094 0.0008
Text1 * TIME 1 –16.589 7.991 0.0437
Text1 * PC 1 1 21.596 14.909 0.1544
Text1 * PC 2 1 30.224 44.077 0.4964
MAIN CROP DENSITY CONSTANT 1 10.226 6.452 0.1203
(
0.4940) Prep1 1 27.576 8.380 0.0020
PC 1 1 –5.980 4.983 0.2367
PC 3 1 –10.602 6.236 0.0963
Text1 1 74.384 19.194 0.0004
Text1 * Prep1 1 –36.834 35.294 0.3025
Text1 * PC 1 1 18.648 9.452 0.0550
Text1 * PC 3 1 13.327 22.279 0.5528
Natural regeneration of Scots pine
283
density, the model showed a positive correlation between
the establishment of successful seedlings and site prepa-
ration. In fact, holding constant the other factors (equal
to the average in the study area), the model predicts an
increase in the number of main crop seedlings from 0.03
to 1.30 seedlings m
–2
when site preparation is made. On
the contrary, grasses cover (PC 3) and cover and mean
height of hardwood species (PC 1) were negatively cor-
related with the density of main crop seedlings.
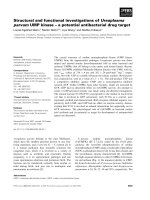
The residual analysis of the final predictive models
showed no violations of the assumptions (
figure 4).
Because atypical values were representative of the high
ecological variability of the sampled area, they were not
removed from the models. With respect to the validation
analysis, the residuals showed a normal distribution both
in the total density (Shapiro-Wilk’s test = 0.98) and main
crop density (Shapiro-Wilk’s test = 0.93) models. The
means of the residuals were 0.69 and 0.78 in the total
Figure 2. Age structure of 11 natural regenerated stands in the High Ebro Basin (Northern Spain). White bars indicate suppressed or
injured seedlings.
S.C. González-Martínez and F. Bravo
284
Figure 3. Box-and-Whisker Plots of the total height by age-class and stand. Stands with a mean age of less than two years have been excluded (Stands 2 and 5).
Natural regeneration of Scots pine
285
density and main crop density models, respectively, and
not differed significantly from zero as shown by Student
t-tests. In addition, the variances of the residuals were
not different than the mean square errors of the models.
4. DISCUSSION
4.1. Population structure of natural regeneration
Multicohort stand dynamics were outlined by Oliver
and Larson [29] for the single-species case, suggesting
that the loss of vitality and death of shrubs and grasses
due to the effect of minor disturbances allowed the
establishment of new seedlings and produced nearly con-
tinuous age distributions. Complex stand structures and
continuos age distributions due to episodic partial distur-
bances have been also found in mixed-species stands [9].
In contrast, in cases of severe disturbances, like a fire,
the occupation of all the growing space in the first two-
three years and the non viability of later settlers have
been reported. For instance, Lust [25] indicated a regen-
eration period of only four years after a fire in a 600 ha
Scots pine forest (High Campine, Belgium). A similar
process to that described by Oliver and Larson [29]
enhanced by the climatic irregularity of the area could
produce the natural regeneration structure observed in
the High Ebro Basin. A continuous series of climatic
data (1951–1992; National Meteorological Agency,
“Duero” Regional Centre) showed variation in climatic
types from dry Mediterranean (during 7 years) to typical
Atlantic (during 16 years) and a great variety of transi-
tional types. Annual weather fluctuations have been
reported as minor disturbances that are of great impor-
tance in the first stages of stand development [29]. The
establishment of new seedlings in the stands may be
caused by the loss of vitality and death of shrubs, grasses
and other tree seedlings due to the effect of drought in
dry years. The variation in height growth of Scots pine
seedlings has been suggested to be caused mostly by the
spatial heterogeneity of the stand [21]. Differences in
microsite variables affecting height growth could explain
the possibility of promotion of later settlers to the
Table V. Weighted linear regression models for total density and main crop density.
Model (Adj–r
2
) Variable d.f. Parameter estimate Standard error t
TOTAL DENSITY CONSTANT 1 14.012 8.154 0.0931
(
0.5378) TIME 1 2.738 0.699 0.0003
PC 1 1 –11.831 2.120 0.0001
PC 2 1 –9.512 4.408 0.0367
MAIN CROP DENSITY CONSTANT 1 11.534 2.948 0.0003
(
0.5087) Prep1 1 20.912 4.284 0.0001
PC 1 1 –5.136 1.475 0.0012
PC 3 1 –8.877 2.164 0.0002
Figure 4. Residual values versus predicted values plot for total
density and main crop density models.
S.C. González-Martínez and F. Bravo
286
dominant stratum. Limited recruitment of tree seedlings
due to low seed production or seed predation could also
explain the observed population structure. Seed preda-
tion has important effects in the availability of seeds of
Pinus species, being a key factor in small size popula-
tions [22]. As much as a 90% of pre-dispersal predation
and a 61–96% of post-dispersal predation has been
reported in relict stands of Pinus sylvestris in southeast-
ern Spain [6]. However, seed availability does not seem
a limiting factor in the High Ebro Basin where seed pro-
duction is usually high and seed predation is reduced by
the existence of other major food sources (e.g. Fagus
sylvatica, Quercus spp).
The difference of height between consecutive age-
classes indicates a high stability of the seedlings height
positions. Ruha et al. [34] showed that the height posi-
tions are primarily established during the first 5–10 years
at a mean height of less than 0.5–1 m and might be
determined even by the height growth of the very first
year. Early differentiation favours the natural selection
of seedlings increasing the total yield at harvest time
[14]. In the study area, the stability of the height posi-
tions is favoured by the heterogeneous pattern and the
low-medium density of trees. In contrast, in high density
stands of 6 to 15-year-old Scots pine, Ganther [11]
observed trees moving from one height class to another.
The early height differentiation and the stability of
height positions allow an early selection of trees in the
study area. In precommercial thinning, the height posi-
tion of a tree could be used as an important criterion in
the selection of the remaining trees.
4.2. Main factors affecting density of seedlings
Limited recruitment of seedlings in forest species due
to interspecific competition is well-stated in the litera-
ture. The climatic conditions of the study area are suit-
able for the establishment of hardwood species (mainly
Q. faginea and F. sylvatica). Schepper [37] showed con-
stant growing rates for Scots pine in comparison with
exponential growing rates for initial stages of oak
species. This causes a clear initial competitive disadvan-
tage for pine regeneration and poorly stocked stands as
in the study area. The competition from broad-leaved
species also seems to be the main limiting factor for
Scots pine recruitment in Northern Italy [5]. The models
assign a relevant role to the presence of Ericaceae in the
natural regeneration success. Inhibition of germination
of red clover by phenolic compounds from the aerial
parts and roots of Erica vagans, Calluna vulgaris and
Daboecia cantabrica has been reported in laboratory
assays [3]. Other plants with potential allelopathic
effects on Scots pine regeneration – like Vaccinium myr-
tillus or Pteridium aquilinum – are not likely to be of
importance in the area because they have inhibitory com-
pounds which are relatively more soluble than those
from Ericaceae species [17] or their stocking is low in
the study area. Lust [25], studying natural regeneration
after a fire, pointed out the importance of physiographic
factors (aspect, slope). In our study, physiographic fac-
tors were not significant probably due to a greater impor-
tance of interspecific competition and the absence of
large disturbances [29, 40]. On the other hand,
Scandinavian authors reported the importance of neigh-
bouring seed-producing stands for regeneration success
[2, 35, 41]. The extreme temperatures of Northern
Europe limit Scots pine’s flowering and cone production
[18], whereas in High Ebro Basin seed production is usu-
ally abundant.
The grass layer is a physical barrier preventing fallen
seeds from contacting the mineral soil. It also means a
strong competition with settled seedlings. For instance, a
16% of height growth reduction has been observed in
Pinus taeda with grass seeding of Festuca arundinacea
applied at a rate of 2.8 g m
–2
[10]. Competition intensity
with herbaceous vegetation is likely to increase in envi-
ronments with low water availability [7]. In the study
area, tree seedling success may be strongly influenced by
competition for water during dry years. In addition, live-
stock and herbaceous plants are in close interrelation.
Continuous cattle grazing changes the floristic communi-
ty producing a dense pasture enriched with palatable
species where cattle tend to concentrate. A strong reduc-
tion of main crop seedlings due to herbivores grazing
and stamping in forest regeneration areas is common in
the High Ebro Basin. In these cases, injured plants are
frequent and the density of main crop seedlings is
reduced. Cattle pressure produces reductions of growth,
vigour and quality of wood in the Scots pine seedlings.
Gong et al. [12] reported that in native pinewoods at
Glen Tanar, Aberdeenshire (Scotland), the dominant
seedlings, defined as the tallest 10 percent of seedlings in
each plot, when aged 12 (61.5 cm height) were 22 cm
higher in fenced than in unfenced plots. Slow-growing
Scots pine plants are less able to compensate for biomass
losses and, therefore, they have less chances to survive
when attacked [8]. In consequence, damage is more
detrimental in poor sites, thus increasing regeneration
difficulties. Fencing seems to be, in the long term, the
only reliable way of securing the development of natural
regeneration in these areas.
Acknowledgements: The authors wish to thank A.
Picardo for valuable discussions and encouragement; R.
Alía, D. Agúndez, G. Montero, S. Mutke and E. Castro
for comments on the manuscript and F. Merino, C. Gil, I.
López and M.E. Abril for generous field assistance. The
Natural regeneration of Scots pine
287
comments of two anonymous referees were greatly
appreciated. Finally, thanks to P.C. Grant, J. Pajares and
J. Hamann who checked the English, and to M. Ribeiro
and S. Mariette who made the French abstract.
REFERENCES
[1] Ackzell L., A comparison of planting, sowing and natur-
al regeneration for
Pinus sylvestris (L.) in boreal Sweden, For.
Ecol. Manage. 61 (1993) 229–245.
[2] Ackzell L., Natural regeneration on planted Clear-Cuts
in Boreal Sweden, Scand. J. For. Res. 9 (1994) 245–250.
[3] Ballester A., Vieitez A.M., Vieitez E., Allelopathic
potential of
Erica vagans, Calluna vulgaris and Daboecia
cantabrica
, J. Chem. Ecol. 8 (1982) 851–857.
[4] Bartlett M.S., The use of transformations, Biometrics 3
(1947) 39–52.
[5] Bucci G., Borghetti M., Understorey vegetation as a use-
ful predictor of natural regeneration and canopy dynamics in
Pinus sylvestris forests in Italy, Acta Oecologica 18 (1997)
485–501.
[6] Castro J., Gómez J.M., García D., Zamora R., Hódar
J.A., Seed predation and dispersal in relict Scots pine forests in
Southern Spain, Plant Ecol. 145 (1999) 115–123.
[7] Davis M.A., Wrage K.J., Reich P.B., Competition
between tree seedlings and herbaceous vegetation: support for
a theory of resource supply and demand, J. Ecol. 86 (1998)
652–661.
[8] Edenius L., Danell K., Nyquist A., Effects of simulated
moose browsing on growth, mortality, and fecundity in Scots
pine: relations to plant productivity, Can. J. For. Res. 25 (1995)
529–535.
[9] Fajvan M.A., Seymour R.S., Canopy stratification, age
structure, and development of multicohort stands of eastern
white pine, Eastern hemlock, and red spruce, Can. J. For. Res.
23 (1993) 1799–1809.
[10] Fredericksen T.S., Zedaker S.M., Smith D.V., Seiler
J.R., Kreh R.E., Early stand dynamics in a field competition
experiment with loblolly pine, red maple, and black locust, in:
Sixth biennial Southern silvicultural research conference,
Memphis, 1990, pp. 630–640.
[11] Ganther S., Untersuchung über die Wuchsdynamik,
Nachbarschaft, soziologische Umsetzung und
Qualitätsentwicklung in natürlich verjüngten Föhren-
Jungwäldern in der Gemeinde Glattfelden, Schweiz. Z.
Forstwes. 134 (1983) 905–914.
[12] Gong Y.L., Swaine M.D., Miller H.G., Effects of fenc-
ing and ground preparation on natural regeneration of native
pinewood over 12 years in Glen Tanar, Aberdeenshire,
Forestry 64 (1992) 157–168.
[13] Greig-Smith P., Quantitative Plant Ecology,
Butterworths, London, 1983.
[14] Hari P., Kellomäki S., Mäkelä A., Ilonen P., Kanninen
M., Korpilahti E., Nygrén M., Metsikön varhaiskehityksen
dynamiikka, Acta For. Fenn. 177 (1991) 1–42.
[15] Hatcher L., A step-by-step approach to using the SAS
®
system for factor analysis on structural equation modelling,
SAS Institute Inc., Cary, 1994.
[16] Hattemer H.H., Concepts and requirements in the con-
servation of forest genetic resources, Forest Genetics 2 (1995)
125–134.
[17] Jäderlund A., Zackrisson O., Nilssön M.C., Effects of
bilberry (
Vaccinium myrtillus L.) litter on seed germination and
early seedling growth of four boreal tree species, J. Chem.
Ecol. 22 (1996) 973–986.
[18] Kellomäki S., Väisänen H., Model computations on the
impact of changing climate on natural regeneration of Scots
pine in Finland, Can. J. For. Res. 25 (1995) 929–942.
[19] Kinnunen K., Combination on Natural and Artificial
Seeding in Regeneration of Scots Pine, Invest. Agrar. Sist.
Recur. For., Fuera de serie 3 (1994) 125–132.
[20] Koski V., Generative reproduction and genetic process-
es in nature, in: Giertych M., Mátyás Cs. (Eds.), Genetics of
Scots pine, Elsevier, Amsterdam, 1991, pp. 59–73.
[21] Kuuluvainen T., Hokkanen T.J., Järvinen E., Pukkala
T., Factors related to seedling growth in a boreal Scots pine
stand: a spatial analysis of a vegetation-soil system, Can. J.
For. Res. 23 (1993) 2101–2109.
[22] Lanner R.M., Seed dispersal in
Pinus, in: Richardson
D.M. (Ed.), Ecology and biogeography of
Pinus, Cambridge
University Press, Cambridge, 1998, pp. 281–295.
[23] Larson M.M., Schubert G.H., Root competition
between Ponderosa pine seedlings and grass. USDA Forest
Service, Rocky Mountain Forest and Range Experiment
Station, RM-54, 1969.
[24] Leikola M., Kotisaari A., How to study natural regener-
ation, in: IUFRO Working Groups SI.01-2 and SI.05-08,
Mountain Silviculture in the Southern Alps, 1989, pp. 1–5.
[25] Lust N., Analysis of a natural regeneration of Scots
pine forest in the High Campine after a fire, Silva Gandavensis
53 (1988) 3–28.
[26] Matney T.G., Hodges J.D., Evaluating Regeneration
Success, in: Duryea M.L, Dougherty P.M., (Eds.), Forest
Regeneration Manual, Kluwer Academic Publishers,
Dondrecht, 1991, pp. 321–331.
[27] Mátyás Cs., Seed Orchards, in: Giertych M., Mátyás
Cs., (Eds.), Genetics of Scots pine, Elsevier, Amsterdam, 1991,
pp. 125–147.
[28] Montero G., Generalities on silviculture of
Pinus
sylvestris
L. in Spain, Invest. Agrar. Sist. Recur. For., Fuera de
serie 3 (1994) 251–259.
[29] Oliver C.D., Larson B.C., Forest Stand Dynamics, John
Wiley and Sons, New York, 1996.
[30] Porta J., López-Acevedo M., Roquero de Laburu C.,
Edafología para la agricultura y el medio ambiente, Mundi-
Prensa, Madrid, 1994.
[31] Pukkala T., Simulation model for natural regeneration
of
Pinus sylvestris, Picea abies, Betula pendula and Betula
pubescens
, Silva Fennica 21 (1987) 37–53.
[32] Rawlings J.O., Applied regression analysis. A research
tool, Wadsworth and Brooks/Cole, Belmont, 1988.
S.C. González-Martínez and F. Bravo
288
[33] Rojo A., Montero G., Ortega C., Natural regeneration
in
Pinus sylvestris L., Invest. Agrar. Sist. Recur. For., Fuera de
serie 3 (1994) 107–125.
[34] Ruha M., Hökkä H., Varmola M., Salminen H.,
Stability of height positions in young naturally regenerated
stands of Scots pine, For. Ecol. Manage. 97 (1997) 155–163.
[35] Saksa T., Natural regeneration on prepared areas. Some
reason for the variation, Invest. Agrar. Sist. Recur. For., Fuera
de serie 3 (1994) 231–240.
[36] Sarvas R., Investigations on the flowering and seed
crop of
Pinus sylvestris, Commun. Inst. For. Fenn. 53 (1962)
1–198.
[37] Schepper (De) C., Typology of the natural regeneration
in a middle-aged Scots Pine Forest, Silva Gandavensis 53
(1988) 29–60.
[38] Steel R.G.D., Torrie J.H., Principles and procedures of
statistics: a biometrical approach, McGraw-Hill, New York,
1980.
[39] Thompson J.D., Population differentiation in
Mediterranean plants: insights into colonization history and the
evolution and conservation of endemic species, Heredity 82
(1999) 229–236.
[40] Wagner R.G., Radosevich S.R., Interspecific competi-
tion and other factors influencing the perfomance of Douglas-
fir saplings in the Oregon Coast Range, Can. J. For. Res. 21
(1991) 829–835.
[41] Yazdani R., Lindgren D., Gene dispersion after natural
regeneration under a widely-spaced seed-tree stand of
Pinus
sylvestris
, Silvae Genet. 41 (1992) 1–5.
To access this journal online:
www.edpsciences.org