Báo cáo khoa học: "Synthesis and analysis of biomass and net primary productivity in Chinese forests" docx
Bạn đang xem bản rút gọn của tài liệu. Xem và tải ngay bản đầy đủ của tài liệu tại đây (1.6 MB, 34 trang )
Original article
Synthesis and analysis of biomass and net primary
productivity in Chinese forests
Jian Ni
a,b,*
, Xin-Shi Zhang
a
and Jonathan M.O. Scurlock
c
a
Laboratory of Quantitative Vegetation Ecology, Institute of Botany, Chinese Academy of Sciences,
Xiangshan Nanxincun 20, 100093 Beijing, P. R. China
b
Department of Ecology, Plant Ecology, Lund University, Sölvegatan 37, 22362 Lund, Sweden
c
Environmental Sciences Division, Oak Ridge National Laboratory, PO Box 2008, Oak Ridge, TN 37831-6407, USA
(Received 27 January 2000; accepted 5 October 2000)
Abstract – An extant dataset is presented on biomass and net primary productivity (NPP) of 6 forest biomes, including 690 stands from
17 forest types of China. Data onlatitude, longitude, elevation, field measurements of stand age, leaf area index (LAI) and total biomass
were collected for 29 provinces from forestry inventory data of the Forestry Ministry of China, as well as a wide range of published lite-
rature. The individual site-based NPP was estimated from field biomass measurements based on a common methodology. The range of
measured LAI, biomass and estimated NPP is from 0.17 to 41.78 m
2
m
–2
(mean = 8.94), from 31.14 to 1569.85 t ha
–1
(means = 185.41),
and from 2.41 to 40.27 t ha
–1
yr
–1
(mean = 14.4), respectively. Analyses and synthesis between NPP and environmental factors showed
that, ineastern China, NPP of forests increases from north to south, whereas NPP of major forests insouthern China decreases in relation
to longitude from east to west. In mountainous areas, the distribution of NPP is related to elevation. On a regional basis, the NPP of Chi-
nese forests is highly correlated with annual mean temperature and rainfall, as well as the annual potential evapotranspiration, especially
on thebasis of site-based comparison. Strong positive correlation also existedbetween NPP and growing degree-days on a 0 °C base and
on a 5 °C base. These all indicated that temperature and moisture are the dominant factors controlling the spatial distribution of NPP in
China. A site-based comparison betweenestimated NPP and NPP modelledby the BIOME3 model showeda fair agreement with alinear
regression. Ahigher correlationoccurred inthe forest-based comparison between estimated and modelled NPP, whereas the highest cor-
relation was found in the plant functional type (PFT)-based comparison. However, there are many limitations in the current data set and
methodologies, suchas the lack of some components of biomass and NPP, especiallywith respect to root production. More detailed field
measurements and methodologies covering all components of NPP should be addressed in China in the future.
biomass measurement / Chinese forests / environmental factors / estimate and comparison of net primary productivity /
spatial patterns
Résumé – Analyses et synthèse relatives à la biomasse et à la productivité nette primaire dans des forêts chinoises. Ce travail pré-
sente un ensemble de données relatives à la productivité nette primaire (NPP) et à la biomasse incluant des mesures pour 690 stations ré-
parties dans 17 types de forêts en Chine. Six biomes forestiers sont représentés. Les données de latitude, longitude, altitude ainsi que les
mesures de terrain sur l’âge des peuplements, l’indice de surface foliaire (LAI) et la biomasse totale ont été rassemblées pour 29 provin-
ces à partir de ce qui est disponible dans l’Inventaire forestier du ministère des Forêts chinois et de données contenues dans un grand
nombre de publications. La productivité nette primaire(NPP) pour chaque site a été estiméeà partirde mesures de terrain surla biomasse
basées sur une méthodologie identique. Les valeurs minimales et maximales sont, respectivement, pour l’indice de surface foliaire
Ann. For. Sci. 58 (2001) 351–384
351
© INRA, EDP Sciences, 2001
* Correspondence and reprints
Tel. +49 3641 64 3787, Fax. +49 3641 64 3775, e-mail:
Present address: Global Ecology Group, Max Planck Institute for Biogeochemistry, PO Box 10 01 64, 07701 Jena, Germany.
(LAI).: 0,17 et 41,78 m
2
m
–2
(moyenne = 8,94), pour la biomasse.: 31,14 et 1569,85 t ha
–1
(moyenne = 185,410) et pour la productivité
(NPP).: 2,41 et 40,27 t ha
–1
an
–1
(moyenne = 14,4). Les analyses sur le rapport entre productivité nette primaire (NPP) et facteurs envi-
ronnementaux ont montré que, dans l’est de la Chine, la productivité (NPP) augmente du nord au sud alors que pour la plupart des forêts
de Chine du Sud, la productivité (NPP) décroît selon un gradient longitudinal, d’est en ouest. Pour les régions de montagne, une relation
entre productivité (NPP) et altitude a pu être établie. À l’échelle régionale, la productivité (NPP) des forêts chinoises ici étudiées est
fortement corrélée avec la température et les précipitations moyennes annuelles ainsi qu’avec l’évapotranspiration potentielle. Une forte
corrélation positive existe également entre la productivité (NPP) et les sommes de température journalières (GDD) aussi bien à partir de
0 °C que de 5 °C. L’ensemble des analyses montre que la température et l’humidité sont les facteurs majeurs qui contrôlent la répartition
spatiale de productivité (NPP) en Chine. La comparaison entre la productivité (NPP) estimée et la productivité modélisée (utilisation du
modèle BIOME 3) en chaque site est satisfaisante (bonne corrélation linéaire). Une corrélation plus marquée existe quand on compare la
productivité (NPP) estimée et la productivité modélisée en se situant non plus au niveau stationnel mais au niveau des massifs forestiers.
La corrélation la plus élevée a été trouvée dans le cas d’une comparaison basée sur des types fonctionnels (PFT). Cependant les données
actuelles et les méthodologies utilisées comportent de nombreuses limitations comme l’absence de certains composants relatifs à la pro-
ductivité (NPP) et à la biomasse, notamment les éléments concernant la production racinaire. Dans le cadre d’études ultérieures en
Chine, il sera nécessaire d’envisager des mesures de terrain plus détaillées et des méthodologies de mesure couvrant tous les composants
de la productivité (NPP).
mesures de biomasse / forêts chinoises / facteurs environnementaux / évaluation et comparaison de la productivité nette
primaire (NPP) / répartitions spatiales
1. INTRODUCTION
Net primary productivity (NPP) is a key ecosystem
variable and an important component of the global car-
bon cycle. It plays a key role in our understanding of car-
bon exchange between biota and atmosphere, both
currently and under climate change conditions caused by
the human-induced increase in atmospheric CO
2
concen-
tration [26, 29, 39]. However, progress in estimating or
modelling the global carbon cycle is seriously inhibited
by the lack of adequate observational data or by signifi-
cant uncertainties in model parameterisation and valida-
tion, such as NPP from field measurements [8, 9, 36].
The challenge is to take extensive but incomplete data
sets and makethem usable for analyses andmodels by es-
timating total NPP in a consistent manner, but there are
many cited difficulties in comparing model predictions
with the limited number of worldwide NPP estimates
currently available [4, 30, 31, 32, 35, 36, 38].
Forest ecosystems play a very important role in the
global carbon cycle and consequently in global climatic
change. Forest biomass data used in earlier studies were
mainly selected from the set of direct field measurements
on small plots obtained by IBP, the International Biologi-
cal Program [10]. Recent studies have estimated forest
biomass at regional and national levels based on forest
inventory data [e.g. 1, 2, 3, 16, 37]. Many studies have
also simulated forest NPP at regional or global scale
driven by different models [e.g. 11, 21, 22, 24, 25, 33, 34,
39]. In the Global Primary Production Data Initiative
(GPPDI), NPP field measurements and associated envi-
ronmental data in boreal and tropical forests of the world
were identified for extrapolation to various spatial scales
[7, 19]. Selection of appropriate methodology is central
in the calculation of accurate results for biomass and NPP
estimations at different scales, i.e.,regional, nationaland
global scales.
Chinese forests, which cover about half of the total
area of China, contain perhaps the widest range of types
in the world, rangingfrom boreal forest and mixed conif-
erous broad-leaved forest in the north, temperate decidu-
ous broad-leaved forest and coniferous forest in the
central region, to subtropical evergreen broad-leaved
forest, warm temperate coniferous forest, tropical rain
forest and seasonal forest in the south [13]. They are
thought to have a significant influence on the carbon
budget both regionally and globally [15, 16]. Several
methods such as biomass-volume relationships, mean
biomass density and mean ratio of biomass to stem vol-
ume have been used to estimate biomass and NPP ofChi-
nese forests based on forest inventory data sets [14, 16,
17], but theyprobably over- or under-estimated theforest
biomass of China to different degrees [16]. Data- and
model-based estimates of Chinese forest NPP, moreover,
have not been compared. Developing a better under-
standing and accurate characterisation of NPP, espe-
cially in Chinese forests which lack more basic
information, will be fundamental for realistic regional
and global carbon budgets, for projecting how these will
be affected by changing global climate and atmospheric
composition, and for validating and calibrating global
biogeochemical models.
This paper presents an extant dataset on biomass and
NPP of 6 biomes, including 17 major forest types of
352 J. Ni et al.
China, and their analyses and synthesis. First, we intro-
duce the existing methodologies for field measurements
of biomass and for estimates of total forest NPP, and then
we comment on these methodologies and validation of
data. Finally, we analyse the spatial changes of forest
NPP associated with environmental factors, and compare
estimated NPP with the output of the model BIOME3
[20]. The objective ofthis paper is to investigate thelarge
spatial patterns of NPP in Chinese forests, their relation-
ships with climate and the comparisons with model-
based simulations rather than the individual site-based
estimates.
2. MATERIALS AND METHODS
2.1. The dataset
The data on biomass and NPP of major Chinese forest
types were originally extracted from the Ph. D. disserta-
tion of Luo [23]. Mostof these datacame from theinven-
tories of the Forestry Ministry of China between 1989
and 1993 [18, 23]. Additional data were obtained from
published forest reports [12], as well as over 60 Chinese
journals (Acta Botanica Sinica, Acta Phytoecologica
Sinica, Acta Ecologica Sinica, Chinese Journal of Ecol-
ogy, Forestry Science of China, etc.), and some unpub-
lished literature up to 1994.
The dataset includes for each record the site name, lat-
itude, longitude, elevation, stand age, measured total
LAI, total biomass, and estimated NPP (see Appendix),
and all of theavailable informationincluding thecompo-
nents of biomass and NPP [23]. These data are distrib-
uted between 6 forest biomes, including 17 major forest
types of China (table I).
2.2. Measurement of biomass
Aboveground biomass of trees was measured by de-
structive harvesting and weighing within a given area.
The size of this sample area varies with stand condition,
different forest type and the aims of the observer. In gen-
eral, the area of sample plots is 100–400 m
2
for boreal
and temperate forests, 400–1 000 m
2
for subtropical for-
ests, and 1 000–2 000 m
2
for tropical forests. The major-
ity of the measurements for tree biomass commonly
followed one of three methods:
i) All of the trees within a sample plot were cut down
and weighed for various component tissues (stem,
bark, branch, leaf, flower and fruit etc.). Total bio-
mass was then calculated based upon the area of the
sample plot.
ii) Several “standard” trees within a plot were selected
for felling and weighing of component parts. The
number of trees selected depended upon species, for-
est type and density. Total biomass was then calcu-
lated based on total tree numbers.
iii) “Standard” trees within a plot are felled and weighed
as in ii) above, then regression functions were estab-
lished, relating biomass of various tissues to certain
tree size indices, such as diameter at breast height
(DBH – 1.3 m) and/or tree height (H). Total above-
ground biomass was then estimated for individual
trees using one of the following equations:
BM
tree
= a × DBH
b
BM
tree
= a × (DBH
2
× H)
b
where, BM
tree
is total biomass of the tree, DBH is di-
ameter at breast height, H is tree height, and a and b
are constants.
Belowground biomass of trees was measured by one of
two methods: (i) all roots of 6–8 standardsample trees by
different diameter classes were excavated after measure-
ment of aboveground biomass. Total belowground bio-
mass was calculated based on measurements of standard
trees; (ii) 4–6 soil pits were excavated within the central
area of root distribution and the surroundings throughout
the tree stand. The area of the soil pit was commonly
2 500 cm
2
associated with sufficient depth to sample the
majority (75–90%) of the root profile. Roots were parti-
tioned into different diameter classes, i.e., coarse roots,
medium-sized roots and fineroots, for estimation of total
belowground biomass.
Shrub and herb above- and belowground biomass
were measured by the harvest method within the larger
tree samples – typically, 10–30 smaller plots were set up
inside a single tree plot, with areas of 16–25 m
2
for shrub
plots and 1–4 m
2
for herb plots. Aboveground tissues
were clipped and belowground roots collected for differ-
ent diameter classes. From the dry weight of these tis-
sues, thetotal biomass was calculatedbased on plot area.
Litterfall was estimated by monthly collection from
10–20 square litter traps, 1 × 1 × 0.25 m, laid out within
the tree plots. Litterfall components, such as leaf, branch,
flower and fruit, were dried and weighed separately, and
summed to determine total litterfall.
Biomass and NPP of Chinese forests 353
354 J. Ni et al.
Table I. Ecological characteristics of Chinese forests (from Editorial Committee for Vegetation of China, 1980). T is annual mean temperature (°C). T
cm
is mean tempera-
ture of the coldest month (°C). T
wm
is mean temperature of the warmest month (°C). P is annual precipitation (mm).
Forest type Latitude
(°)
Longitude
(°)
Elevation
(m)
Dominants T (°C) T
cm
(°C) T
wm
(°C) P (mm)
1. Boreal forest
Boreal Larix forest >26
(mainly
54–42.5)
<1500
2100–4000
1400–2600
Larix gmelinii, L. sibirica,
L. principis-rupprechtii
–2 to –5 –28 to –38 16–20 350–550
600–1000
Boreal and subalpine Abies-Picea forest 54–22.5 1100–4300 Abies georgei,
Picea wilsonii
0–8 –8 to 0 10–16 (300)600–1000
Boreal Pinus sylvestris var. mongolica
forest
54–46.67 112–125 300–900 Pinus sylvestris
var. mongolica
0 to –5 –25 to –35 15–20 400–550
Cold-temperate mixed coniferous
broad-leaved deciduous forest
50.3–40.75 134–124.75 300–1300 Pinus koraiensis,
Tilia, Betula, Acer
2–8 –25 to –10 20–24 500–800(1100)
2. Temperate deciduous broad-leaved forest
Typical temperate deciduous broad-leaved
Forest
34–42 <1500 Quercus,Tilia,Carpinus,
Alnus, Ulmus, Acer
9–14 –2 to –14 24–28 500–900
Montane Populus-Betula forest >35 Populus, Betula <8 400–800
Temperate Tugai forest 30–50 500–900 Populus enphratica,
P. pruinosa
8–14 30–60, 200–300
3. Subtropical evergreen broad-leaved forest
Typical subtropical evergreen
broad-leaved forest
23.67–32 99–123 200–2800 Cyclobalanopsis,
Lithocarpus,Castanopsis,
Machilus, Schima
16–18 3–8 28–30 1400–2100
Subtropical mixed evergreen-deciduous
broad-leaved forest
34–23 <1800 Quercus, Castanopsis,
Cyclobalanopsis
14–22 2–13 28–29 800–3000
Subtropical sclerophyllous evergreen
broad-leaved forest
26–32 90–103 2600–4000 Quercus <10 600–900
Biomass and NPP of Chinese forests 355
Forest type Latitude
(°)
Longitude
(°)
Elevation
(m)
Dominants T (°C) T
cm
(°C) T
wm
(°C) P (mm)
4. Tropical rain forest & monsoon forest
Tropical rain forest & monsoon forest 18–23 <500–1000
<500–600
Vatica, Hopea,
Parashorea
22–26
20–25
18
10–13
2000–3000(5000)
1000–1800(3000)
5. Temperate coniferous forest
Pinus tabulaeformis forest 31–43.55 103.3–124.8 1200–1800 Pinus tabulaeformis <14 <900
6. Subtropical coniferous forest
Pinus armandii, P. taiwanensis and
P. densata forest
28–33 93–104 1000–3000
700–1750
2000–4000
Pinus armandii,
P. taiwanensis,
P. densata
14–18 0–8 26–28 >900
Cunninghamia lanceolata forest 23–34 98–120 <800–2000 C. lanceolata 17–20 7–10 27–28 1400–1800
Pinus massoniana forest 20–34 100–124 <1000 Pinus massoniana 14–21 800–1800
Pinus yunnanensis and P. khasya forest 23–29
23–25
93.5–106.5
100–102
1500–2800
1000–1900
Pinus yunnanensis,
P. khasya
17
1300–1600
Cupressus forest 26–30 105–120 300–3000 Cupressus funebris,
C.duclouxan,C. didantea
>16 >1000
Table I (continued).
2.3. Estimate of NPP
Total forest NPP was estimated by the following
equation:
NPP=P
s
+P
b
+P
l
+P
r
+P
u
where, NPP is net primary productivity of a forest, P
s
,P
b
,
P
l
and P
r
are annual net increments of tree stem, branch,
leaf and root, respectively, and P
u
is annual net increment
of shrub and herb.
In order to estimate annual net increment, growth rate
of trees within a recent 3–5 year period was calculated
using a biomass-volume growth rate model for different
geographical regions and various tree species [23]. The
annual net increments of stem, branch and root were ob-
tained by multiplication of the proportion of tree biomass
represented by the tissue and their growth rate, respec-
tively, based on an assumption of allocation among dif-
ferent tissue types. The total annual net increment of
stem, branch and root in a forest was summed based on
that of all trees. The annual net increment of leaves was
derived from leaf biomass by dividing by leaf age (resi-
dence time) of different trees. Annual net increments of
all leaves were summed for the different tree types in a
forest. The leaf residence time of deciduous coniferous
and deciduous broad-leaved trees was estimated at
1 year, and 1.5 years for the evergreen broad-leaved
trees, 5 years for Picea spp. and Abies spp., 4 years for
Pinus koraiensis and Cryptomeria japonica, 3 years for
P. tabulaeformis, P. Taiwanensis and Cupressus spp.,
2 years for P. sylvestris var. mongolica, P. Armandii
and Cunninghamia lanceolata, and 1.5 years for
P. massoniana, P. yunnanensis and P. khasya. Leaf resi-
dence time for other coniferous trees is estimated at ap-
proximately 2 years.
Estimation of annual net increment of shrub and herb
was by the same method as for trees. Where field mea-
surements were lacking, estimated shrub and herb incre-
ments were based upon generalised relationships
between shrub, herb and tree biomass for each forest
type. The average NPP of the shrub and herb layers was
estimated by dividing their biomass by their average
stand age [23].
2.4. Calculation of LAI
One hundred leaves of each tree species were col-
lected to measure their specific leaf area. Projected leaf
area of broad-leaved trees was measured by cutting and
weighing paper replicates. For needle leaves, the follow-
ing equationswere used to calculatedprojected leaf area:
S=(a + b) × L(Picea, Pinus)
S=(a + b) × L/2 (Abies, Larix)
where, S is projectedleaf area of a needle leaf, a and b are
the width of a leaf at top and bottom, respectively, and L
is the length of a needle leaf.
The specific leaf area of each tree species was then
calculated based on the relationship between leaf weight
and projected leaf area. Total leaf area index (LAI) of a
forest was summed up from that of each tree, which was
calculated by the following equation:
LAI = (projected leaf area/leaf weight) × total leaf
biomass.
2.5. Climatic factors
To investigate the role that different climatic variables
may play in determining regional patterns of NPP, we
analysed the relationships between annual NPP and envi-
ronmental data, such as mean annual temperature (T),
growing degree-days on a 0 °C basis (GDD
0
) and on a
5 °C basis (GDD
5
), annual precipitation (P), and annual
potential evapotranspiration (PET).
Monthly mean temperature, absolute minimum tem-
perature, precipitation, and percent of sunshine were
used for 841 standard weather stationsfrom 1951 to 1980
[5]. Data were interpolated to a 10′ latitude × 10′ longi-
tude grid by the smoothing spline method (Wolfgang
Cramer, Potsdam Institute for ClimaticImpact Research,
personal communication). Grid cell data for each NPP
estimation site were extracted to calculate GDD
5
, GDD
0
and PET using the methods of BIOME3 [20]. All NPP
comparisons to climatic factors used the grid cell data.
2.6. BIOME3 model
The equilibrium terrestrial biosphere model BIOME3
[20] represents an attempt to combine the biogeography
and biogeochemistry modelling approaches within a sin-
gle global framework, to simulate vegetation distribution
and biogeochemistry (NPP). The logic of BIOME3
model is as follows. Ecophysiological constraints deter-
mine which plant functional types (PFTs) may poten-
tially occur. A coupled carbon and water flux model is
then used to calculate, for each PFT, the LAI that maxi-
mises NPP, subject to the constraint that NPP must be
sufficient to maintain this LAI. Competition between
356 J. Ni et al.
PFTs is simulated by using the optimal NPP of each PFT
as an index of competitiveness, with additional rules to
approximate the dynamic equilibrium between natural
disturbance and succession driven by light competition.
Canopy conductance is treated as a function of the calcu-
lated optimal photosynthetic rate and water stress. Re-
gional evapotranspiration is calculated as a function of
canopy conductance, equilibrium evapotranspiration
rate, and soil moisture using a simple planetary boundary
layer parameterization. This scheme resultsin a two-way
coupling of the carbon and water fluxes through canopy
conductance, allowing simulation of the responseof pho-
tosynthesis, stomatal conductance, and leaf area to envi-
ronmental factors including atmospheric CO
2
.
Model inputs consist of latitude, soil texture class,and
monthly climate (temperature, precipitation, and sun-
shine) data. Model output consists ofa quantitative vege-
tation state description terms of the dominant PFT,
secondary PFTs present, and the total LAI and NPP for
the ecosystem. Comparisons with the mapped distribu-
tion of vegetation and with NPP have shown that the
model successfully reproduced the broad-scale patterns
in potential natural vegetation distribution and NPP
worldwide [20] and within China [27, 28].
3. RESULTS
3.1. Biomass and NPP
The forests of China are mainly distributed in the east-
ern and southern parts of the country and in thesoutheast-
ern periphery of the Tibetan Plateau. A few of them are
scattered in the higher mountains and along the rivers in
the desert area of the western part of China [13]. The
study covered 6 distinct biomes in relation to increasing
thermal and moist gradients from north to south (table I),
i.e., boreal forest, temperate deciduous broad-leaved for-
est, temperate coniferous forest, subtropical evergreen
broad-leaved forest, subtropical coniferous forest, tropi-
cal rain forest and monsoon forest, including 17 forest
types ranging across a substantial land area from the far
north-east (Heilongjiang Province, ca. 53° N, 122° E)
and north-west of China (Xinjiang Autonomous Region,
ca. 48° N, 86° E) to the southerly Yunnan Province (ca.
22° N, 100° E) and the southernmost part of China
(Hainan Island, ca. 18° N, 108° E).
The elevation of the forest study sites ranges from 10
to 4 240 m (mean = 1 385 m), and stand age from 3 to
350 years (mean = 66 years). Estimates of LAI range
from 0.17 to 41.78 (mean = 8.94), biomass from 31.14 to
1 569.85 t ha
–1
(mean = 185.41 t ha
–1
), and NPP from 2.41
to 40.27 t ha
–1
yr
–1
(mean = 14.4 t ha
–1
yr
–1
). The lowest
and highest biomass and NPP occur in the tugai forest in
the western desert region, and the rain and monsoon for-
ests in the southern tropical region, respectively (ta-
ble II). In order ofbiome, the biomass of tropical rain and
monsoon forest (mean = 440.04 t ha
–1
) is greater than that
of subtropical evergreen broad-leaved forest (mean =
232.27), boreal forest (mean = 180.51), subtropical co-
niferous forest (mean = 155.89), temperate deciduous
broad-leaved forest (mean = 106.9) and temperate conif-
erous forest (mean = 106.05). NPP of tropical forests
(mean = 27.1 t ha
–1
yr
–1
) is greater than that of subtropical
forests (evergreen broad-leaved forest,mean = 16.18, co-
niferous forest, mean = 14.22), temperate forests (decid-
uous broad-leaved forest, mean = 10.23, coniferous
forest, mean = 9.86), and boreal forest (mean = 8.85).
3.2. Spatial pattern
The boreal deciduous coniferous (Larix) forest is
mainly distributed in the far north east and north west of
China, and scattered in the mountainous area of central
China. The estimated NPP of this forest varies in differ-
ent regions (north east China < 10 t ha
–1
yr
–1
, north west
China 10.5, and central China 15.0) in relation to various
elevations (figure 1a). The NPP of boreal and cool tem-
perate coniferous (Abies-Picea) forest that is distributed
in the higher mountains in the north east, north west of
China and south east of Tibet is mostly less than
10tha
–1
yr
–1
(figure 1b). The Pinus sylvestris var.
mongolica forest with a lower NPP is distributed in the
extreme north eastof China (figure 1c). The mixedconif-
erous broad-leaved deciduous forest is distributed in the
north east China near Russia and Korea (figure 1d), with
a low to moderate NPP (<15 t ha
–1
yr
–1
). The typical de-
ciduous broad-leaved forest in central and northern areas
of east China mostly has a moderate NPP of
10.5 t ha
–1
yr
–1
(figure 1e). Montane Populus-Betula for-
est, distributed from northeastern to southwestern China
shows a range of NPP, from <10 to 30 t ha
–1
yr
–1
(fig-
ure 1f). The tugai Populus forest along the riverside in
western desert region has the lowest NPP (figure 1g).
The typical evergreen broad-leaved forest, mixed ever-
green-deciduous broad-leaved forest and sclerophyllous
evergreen broad-leaved forest which are mainly distrib-
uted in south east China and the southerly Tibetan pla-
teau, however, have larger NPP, ranging mostly from 15
to 30 t ha
–1
yr
–1
(figure 1h ). The NPP of tropical rain for-
est and monsoon forest in Hainan Island and the
Biomass and NPP of Chinese forests 357
358 J. Ni et al.
Table II. Statistics of leaf area index (LAI), total biomass and annual net primary productivity (NPP) of 17 Chinese forests. Mean is the average value for each item in each forest.
S.D. is the standard deviation. Min and max are the minimum and maximum values, respectively for each item.
Forest type Latitude (°) Longitude (°) Elevation
(m)
Age
(yr)
LAI Biomass (t ha
–1
) NPP(t ha
–1
yr
–1
)
mean S.D. min max mean S.D. min max mean S.D. min max
Larix 28.50–52.63 86.83–131.87 441–4240 30–193 7.01 3.44 2.73 15.69 159.13 83.18 53.38 397.11 10.32 3.39 3.77 17.35
Abies-Picea 25.90–52.63 81.10–131.87 410–4180 46–350 10.98 6.51 3.29 40.69 264.51 172.22 69.98 1569.85 8.47 2.60 3.76 16.97
Pinus sylvestris
var. mongolica
43.52–53.02 112.05–126.38 500–900 53–180 5.83 0.41 5.09 6.58 125.13 23.39 94.82 157.99 6.66 0.78 5.44 8.14
Mixed conife-
rous-broad-leaf
40.87–50.72 123.88–133.53 233–770 20–238 8.74 3.01 4.59 17.48 173.27 82.39 42.47 279.20 9.94 2.70 5.40 15.10
Deciduous
broad-leaf
27.97–51.70 103.08–134.00 177–2600 20–157 6.67 1.95 4.11 11.39 120.32 42.02 58.16 247.33 10.90 2.45 5.46 14.82
Populus-Betula 26.03–52.53 85.27–134.00 150–3500 25–110 8.27 2.57 3.12 13.95 142.51 49.75 49.73 298.16 14.33 4.84 5.69 27.67
Tugai 37.15–48.03 78.00–88.03 500–950 25–53 0.85 0.96 0.17 2.87 57.89 21.52 34.06 91.37 5.47 2.49 2.41 9.05
Evergreen broad-
leaf
20.68–30.27 85.35–120.17 80–3460 3–200 11.18 6.35 3.97 41.78 248.58 111.65 50.86 659.43 21.92 5.25 10.06 33.19
Mixed ever-
green-deciduous
broad-leaf
25.38–33.78 96.68–117.48 470–2600 20–130 11.27 4.98 5.12 27.29 200.34 90.35 80.82 374.32 15.20 2.98 8.72 23.12
Sclerophyllous
evergreen broad-
leaf
27.80–29.88 86.00–101.52 2375–3800 76–232 7.07 1.60 3.89 9.50 247.90 53.67 167.97 331.81 11.41 1.55 8.56 13.71
Rain and monso-
on
18.70–22.02 100.80–109.83 450–875 22–160 7.90 6.08 4.10 16.88 440.04 290.93 108.27 765.02 27.10 9.16 19.04 40.27
Pinus tabulaefor-
mis
32.65–42.65 103.67–129.53 240–3200 15–95 8.56 3.68 3.68 16.51 106.05 57.64 31.14 285.36 9.86 2.37 5.67 13.40
Pinus armandii,
P. taiwanensis
and P. densata
26.07–34.62 85.27–119.38 718–3558 20–160 10.90 3.00 5.13 15.81 143.62 63.64 31.26 337.44 11.91 3.31 5.48 17.79
Cunninghamia
lanceolata
18.70–33.07 103.37–121.20 20–1910 16–55 6.86 3.34 3.02 18.33 139.08 80.38 46.74 495.13 16.66 7.15 6.91 35.13
Pinus massonia-
na
21.57–37.98 105.22–120.03 10–1420 15–101 6.92 2.69 2.66 14.47 154.85 77.49 38.42 415.84 17.48 5.25 7.95 30.13
Pinus yunnanen-
sis and P. khasya
24.30–28.63 97.48–106.57 970–3050 22–110 7.78 2.57 5.08 14.05 176.88 74.92 99.37 364.28 12.71 2.48 8.32 16.28
Cupressus 25.37–33.62 85.27–113.08 200–3500 15–220 12.19 4.44 7.28 22.72 165.04 79.51 69.14 293.92 12.36 4.22 7.21 21.54
Summary 18.70–53.02 78.00–134.00 10–4240 3–350 8.94 4.94 0.17 41.78 185.41 116.45 31.14 1569.85 14.40 6.61 2.41 40.27
Biomass and NPP of Chinese forests 359
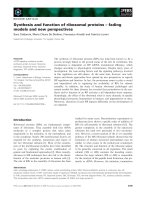
Figure 1 (continued on next page). Geographical patterns of NPP in each forest of China. (a) Larix forest; (b) Abies-Picea forest; (c)
Pinus sylvestris var. mongolica forest; (d) Mixed coniferous broad-leaved deciduous forest; (e) Typical deciduous broad-leaved forest;
(f) Montane Populus-Betula forest; (g) Tugai forest; (h) Typical evergreen broad-leaved forest; (i) Mixed evergreen-deciduous broad-
leaved forest; (j) Sclerophyllous evergreen broad-leaved forest; (k) Rain forest and monsoon forest; (l) Pinus tabulaeformis forest; (m)
Pinus armandii, P. taiwanensis and P. densata forest; (n) Cunninghamia lanceolata forest; (o) Pinus massoniana forest; (p) Pinus
yunnanensis and P. khasya forest; and (q) Cupressus forest.
360 J. Ni et al.
Figure 1 (continued).
Xishuangbanna area of Southern China is the highest, at
20 to 40 t ha
–1
yr
–1
(figure 1k). Coniferous forests usually
have lower NPP than broad-leaved forests in the same
climatic zone. The temperate Pinus tabulaeformis forest
with a similar distribution to temperate deciduous broad-
leaved forest has lower NPP, <15 t ha
–1
yr
–1
(figure 1l).
The subtropical Pinus armandii, P. taiwanensis and
P. densata forest, Cunninghamia lanceolata forest,
P. massoniana forest, P. yunnanensis and P. khasya for-
est, and Cupressus forest, which are distributed in south
east China, have larger NPP, mostly from 15 to
30tha
–1
yr
–1
(figure 1m–q).
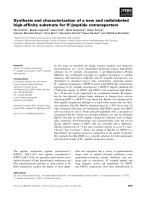
Generally, the NPP of Chinese forests increases from
north to south in relation to the increasing temperature
and precipitation, and increases from west to east in rela-
tion to the moisture gradient (figure 2a). In mountainous
areas, NPP decreases with elevation (figure 2b).
3.3. Environmental factors controlling NPP
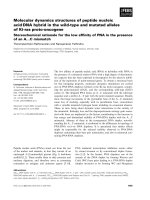
The estimated NPP of the 690 individual forest sites
showed no clear relationships with stand age (fig-
ure 3a1), LAI (figure 3b1) and biomass (figure 3c1), but
these relationships were more well-defined in a forest
type-based comparison (figures 3a2, b2, c2).
Five climatic variables,T, GDD
0
, GDD
5
and P, aswell
as PET were compared to actual NPP estimates. On a re-
gional basis, forest NPP of China is highly correlated
with annual mean temperature (figures 3c1, c2) and rain-
fall (figures 3g1,g2), especially on the basisof site-based
comparison, as well as the annual PET (figures 3h1, h2)
which expresses the potential atmospheric demand for
moisture. Strong positive correlation also existed be-
tween NPP and growing degree-days on a 0 °C base (fig-
ures 3d1, d2) and on a 5 °C base (figures 3f1, f2). These
results all suggest that temperature and moisture are
among the dominant factors controlling the spatial distri-
bution of NPP in China. The importance of each variable
in influencing NPP was determined by least-squares re-
gression and correlation analysis (SPSS software). Cor-
relation analysis (correlation significant at P < 0.01)
showed that spatial distributions of Larix forest and typi-
cal evergreen broad-leaved forests correlate most highly
with T and PET; mixed coniferous broad-leaved decidu-
ous forest, typical evergreen broad-leaved forest, Pinus
Biomass and NPP of Chinese forests 361
Figure 2. Distribution patterns of Chinese forest
NPP classes in relation to the longitude and lati-
tude (a), and elevation (b).
362 J. Ni et al.
Figure3 (continued on nextpage). Relationshipsbetween NPP andenvironmental variables:(a) stand age (years); (b) LAI; (c) biomass
(t ha
–1
); (d) annual mean temperature (°C); (e) growing degree- day on 0 °C base; (f) growing degree-day on 5 °C base; (g) annual pre-
cipitation (mm); (h) estimated annual potential evapotranspiration (mm). Left column, 690 sites- based comparison (1); right column,
17 forest types-based comparison (2).
Biomass and NPP of Chinese forests 363
Figure 3 (continued).
armandii, P. taiwanensis and P. densata forest, and P.
massoniana forest with P; and typical evergreen broad-
leaved forest with GDD
0
, GDD
5
and annual PET.
3.4. Comparison of estimated NPP to BIOME3-
modelled NPP
Reliable field-derived NPP data from terrestrial eco-
systems are needed for validating and calibratingglobal
biogeochemical models. These data are also potentially
useful to mechanistically model carbon dynamics at
global and regional scales. For illustrative purposes,
field estimated NPP was compared to NPP modeled us-
ing BIOME3 [20]. BIOME3 predictions of total NPP
were obtained for each grid cell containing a Chinese
forest NPP site, and compared with these 690 site-spe-
cific estimates of forest NPP [28]. The resulting com-
parison showed a fair degree of agreement between the
predicted and estimated NPP, based upon linear regres-
sion: y = 0.85x + 254.38, n = 690, r
2
= 0.31 [28].
However, forest type-based and PFT-based compari-
sons are more valuable to simulation of large-scale
vegetation dynamic. A higher correlation occurred in
the forest-based comparison between estimated NPP
and NPP modelled by BIOME3: y = 1.67x – 0.47, n = 17,
r
2
= 0.80 (figure 4a), whereas the highest correlation ex-
ists in the PFT-basedcomparison: y = 2.13x – 7.60, n=7,
r
2
= 0.95 (figure 4b). Generally, modelled NPP was
larger than PFT-basedestimates of forest NPP(figure 4c)
because the model simulated the average NPP of all veg-
etation types over a grid cell.
4. DISCUSSION
4.1. Limitations of data and methodology
The biomass and NPP data sets used in this study were
derived from the dissertation of Luo [23]. They are not
the original data sets and do not contain all the compo-
nents of biomass and NPP. Further description and analy-
sis of biomass andNPP components is needed, especially
for root production, althoughthese are not available here,
since we focussed onlyon synthesis and analysis. A more
detailed biomass and NPP database is under develop-
ment and analysis (Zhou, personal communication).
The types of field measurements of biomass and NPP
that are available for biomes worldwide depend largely
on plant growthform and life cycle length. NPP is gener-
ally calculated as the sum of the positive increments of
biomass. Loss of tissue by death or grazing is not always
well accountedfor, and belowground productionis rarely
estimated [31, 32]. Measurements are also lacking for
some components in the Chinese forestry data set, such
as mortality, grazing, belowground biomass, and espe-
cially fine root production [23]. Some of these compo-
nents are customarily estimated from empirical
equations based on the relationship between above- and
364 J. Ni et al.
Figure 4. Comparisons between estimated NPP and NPP mod-
elled by BIOME3 [20]: (a) based upon 17 forest types; (b)
based upon 7 plant functional types (PFTs); (c) comparison by
PFT. The PFTs are tropical evergreen (TE), temperate broad-
leaved evergreen (TBE), temperate summergreen (TS), temper-
ate evergreen coniferous (TC), boreal evergreen coniferous
(BEC), boreal summergreen (BS), and temperate grass (TG).
The occurrence of TG, a non-forest PFT, is due to some forests
that are scattered in the temperate region of northern China
where TG is the dominant PFT.
belowground biomass [23]. Calibrated allometric equa-
tions are used to estimate aboveground standing bio-
mass. Wood production is estimated by subtracting the
standing biomass value for the preceding time interval,
sometimes with corrections for litter and branch fall.
Root biomass is rarely available and root production is
hardly ever measured directly most estimates being
based on the relationships between above- and below-
ground production [23]. Detailed ecophysiological mea-
surements occur at very few sites. Therefore, we were
unable to determine certain allometric relationships
among them because of the lack of some NPP compo-
nents. Methods ofcalculating totalNPP from partial data
sets have recently emerged from a series of workshops,
which developed correlative relationships using those
more complete data sets [6, 7, 19]. In China, the biomass-
volume method of estimating forest NPP has been devel-
oped using those better data sets that contain most com-
ponents of NPP [e.g. 16].
Clark et al. [6] examined how forest NPP (above- and
below-ground) may be estimated at ecosystem level
based on field measurements. To date, field measure-
ments have been mostly restricted to certain aspects of
NPP, and methodsare still lacking for fieldassessment of
other NPP components. Past studies suggest confusion
about the types of measurements needed, and, as a result,
existing field-based estimates of forest NPP are likely to
be significant underestimates [6].NPP estimatesfor Chi-
nese forests also have these shortcomings and are there-
fore likely to be underestimates.
Thus the methodology for the individual site-based
estimates of NPP could indeed be improved, but the indi-
vidual errors inthis large-scaleanalysis are probably lost
in the overall mass of data points.
4.2. Comparison with other estimates in China and
in the world
Fang et al. [16] estimated the forest biomass of China
based on the relationship between stand biomass and vol-
ume and using 1984–1988 forest inventory data (ta-
ble III). However, NPP was not estimated in this study.
Feng et al. [17] also estimated the biomass and NPP of
forest ecosystems in China based on common methodol-
ogy, using data published since the 1960 (table III). For
each of theclimate zones, the forest biomassaccording to
Fang et al. was much lower than that of Feng et al. and
Biomass and NPP of Chinese forests 365
Table III. Mean values of forest biomass and NPP of China in different climate zones.
Climate
zone
Fang et al. (1998) [16] Feng et al. (1999) [17] This study
Biomass
(t ha
–1
)
Forest type Biomass
(t ha
–1
)
NPP
(t ha
–1
yr
–1
)
Forest type Biomass
(t ha
–1
)
NPP
(t ha
–1
yr
–1
)
Forest type
Boreal 134.48 Larix, Picea, Abies, Pi-
nus sylvestris
var. mongolica
176.12 5.82 Larix, Pinus sylvestris
var. mongolica
180.51 8.85 Boreal forests
Temperate 69.87 Deciduous oaks, Betula,
Pinus koraiensis, mixed
coniferous and deci-
duous forests
253.64 7.94 Mixed coniferous-broad-
leaf, Larix, Pinus, Abies-
Picea, Quercus, Fraxinus,
Populus
106.48 10.05 Temperate deci-
duous
broad-leaved forests
Warm
temperate
82.77 Lucidophyllous and
mixed deciduous
forests, nonmerchan-
table woods
Cunninghamia, Pinus
armandii,
P. yunnanensis, Tsuga,
Sassafras
364.62 16.11 Cunninghamia lanceola-
ta, Pinus massoniana,
P. yunnanensis, P. kha-
sya, Cupressus, Bamboo
184.63 14.89 Subtropical ever-
green
broad-leaved forests
and coniferous fo-
rests
Tropic 145.40 Tropical forests 382.66 18.78 (tree
layer only)
Rain forest, seasonal fo-
rest, mangrove
440.04 27.10 Rain and monsoon
forests
also lower than the value of the present study (table III).
In the temperate and warm temperate zones, the forest
biomass estimates of Feng et al. were higher than those
of this study,although their estimates for boreal and trop-
ical zones were slightly lower (table III). However, esti-
mates of forest NPP are higherin the present study that in
Feng et al. [17], with the exception of the warm temper-
ate zone (table III).
These differences in estimates of forest biomass and
NPP may be attributed to, firstly, different estimation
methods although Feng et al. [17] and this study show
only small differences, Fang et al. [16] uses quite a dif-
ferent methodology. Furthermore, the three studies treat
stand age differently, including only mature forests in
some forest types, yet identifying young, middle-aged
and mature forests within other types. Lastly, the systems
of forest classification differ between the studies.
Lieth and Whittaker [21] summarised the biomass and
NPP of major forest ecosystems in the world (table IV).
According to the present study (table III), the biomass of
Chinese forests is lower than these world averages (table
IV). However, their NPP is quite similar (slightly lower
or higher on average) for boreal, temperate deciduous
and warm temperate evergreen forests (table III, table
IV), but the NPP ofChinese tropical forests is higher than
the world mean value.
4.3. NPP and climate
Many studies have shown that climatic factors, spe-
cifically temperature and precipitation, were among the
major controlling factors of NPP at a large spatial scale
[e.g., 21, 33, 34]. In eastern China, mean annualtempera-
ture (from –5 to 26
o
C) and precipitation (from 350 to
3 000 mm) increase significantly from north tosouth part
of China (table I) where major forests are distributed.Es-
timated forest NPP also increases from ca. 6 to 27 t ha
–1
yr
–1
, associated with the increase of temperature and pre-
cipitation (table II, figure 3). A fair and a good agree-
ment, respectively, existedbetween climate data andsite-
based and foresttype-based NPP (figure 3). However,the
climate data used in this study are an interpolation from
weather station records, rather than actual measurements
from the study sites or nearby weather stations. Errors in
the interpolation of climate data due to the low density of
weather stations in some areas, and the influence of sharp
changes in elevation may lead touncertainties in therela-
tionship between climate and NPP.
The methodologies or models that were developed to
estimate the total NPP generally require independent
variables, such as climate. This places a qualifying re-
striction on the suitability of the secondary data sets to
which the rules may be applied – if these ancillary data
are not available and cannot be provided, then the sec-
ondary data set cannot be used to estimate total NPP with
that rule [31, 32]. Thus, in addition to total system NPP
(above- and belowgrond) on an annual time scale, field
data should ideally include as complete a picture of NPP
as possible, such as the driving variables (e.g. climate,
soil, species composition, location, and other informa-
tion needed to estimate parameters). It is clear that more
and better data are needed from Chinese forest biomes
before confidence can be placed inscaled-up estimates of
NPP for this sector of the world's terrestrial ecosystems.
4.4. Estimated and modelled NPP
It is recognised that there are many problems associ-
ated with comparisons of estimated and modelled NPP,
including the quality of the data and the fact that the
model is simulating the average NPP over a grid square
while NPP measurements are made at particular sites
[20]. Despite these problems, a positive relationship ex-
isted between estimated NPP and NPP simulated by
BIOME3, especially for the forest type-based and PFT-
based comparisons rather than the site-based comparison
(figure 4). However, there was poor overall agreement
between estimated and simulated NPP. Differences be-
tween estimated and BIOME3 modelled forest NPP may
be due to:
i) Spatial reasons. BIOME3 NPP estimates are based on
land areas represented by the gridded input data sets
used by the model, whereas actual NPP estimates are
366 J. Ni et al.
Table IV. Biomass and NPP of forest ecosystems in the world
(from Lieth and Whittaker, 1975).
Forest ecosystem Biomass (t ha
-1
) NPP (t ha
-1
yr
-1
)
Range Means Range Means
Boreal forest 60–400 200 4–20 8
Temperate deciduous
forest
60–600 300 6–25 12
Temperate evergreen
forest
60–2000 350 6–25 13
Tropical seasonal forest 60–800 350 10–25 16
Tropical rain forest 60–800 450 10–35 22
based on the quadrat areas actually sampled at each
site. This is very important because the model simu-
lated the average NPP of all vegetation types over a
grid square, and because the issue of scaling-up of
biomass and NPP from the sampling area to agrid cell
should be taken carefully into account.
ii) Errors and uncertainties in NPP estimates, which ex-
ist for reasons discussed above.
iii) Shortcomings of the model. Each biogeography or
biogeochemistry model has its limitations and
BIOME3 is no exception.
For these reasons, it is recommended to perform and
learn from model inter-comparison with respect to vari-
ous key variables, using common input datasets at global
and regional scales [9].
Acknowledgements: This research was funded by the
National Natural Science Foundation of China (NSFC
No. 39970154) and was also conducted as a contribution
to the Worldwide Net Primary Production Working
Group supported by the National Center for Ecological
Analysis and Synthesis (NCEAS), a Center funded by
National Science Foundation of America (Grant #DEB-
94-21535), the University of California at Santa Barbara,
and the State of California, USA. Jonathan Scurlock was
supported by the Terrestrial Ecology Program, Office of
Earth Science, US National Aeronautics and Space Ad-
ministration, under Interagency Agreement No. 2013-
I096-A1, under Lockheed Martin Energy Research Cor-
poration contract DE-AC05-96OR22464 with the US
Department of Energy. We would like tothank two anon-
ymous reviewers for their valuable comments on the
manuscript and Jean-Pierre Sutra and François Houllier
for editing the French abstract.
REFERENCES
[1] Alexeyev V., Birdsey R., Stakanov V., Korotkov T., Car-
bon in vegetation of Russian forests: methods to estimate storage
and geographical distribution, Water Air Soil Pollut. 82 (1995)
271–282.
[2] Brown S., Lugo A.E., Aboveground biomass estimates
for tropical moist forests of the Brazilian Amazon, Interciencia
17 (1992) 8–18.
[3] Brown S., Gillespie A.J.R., Lugo A.E., Biomass of tropi-
cal forests of south and southeast Asia, Can. J. For. Res. 21
(1991) 111–117.
[4] Cannel M.G.R., World forest biomass and primary pro-
duction data, Academic Press, New York, 1982.
[5] Chinese Central Meteorological Office, Meteorological
Data of China, Meteorology Press, Beijing, 1984.
[6] Clark D.A., Brown S., Kicklighter D.W., Chambers J.Q.,
Thomlinson J.T., Ni J., Measuring net primary production in fo-
rests: concepts and field methods, Ecol. Appl. 11 (2001)
356–370.
[7] Clark D.A., Brown S., Kicklighter D.W., Chambers J.Q.,
Thomlinson J.R., Ni J., Holland E.A., NPP in tropical forests: an
evaluation and synthesis of existing field data, Ecol. Appl. 11
(2001) 371–384.
[8] Cramer W., Moore III B., Sahagian D., Data needs for
modelling global biospheric carbon fluxes: lessons from a com-
parison of models, IGBP Newsletter 27 (1996) 13–15.
[9] Cramer W., Kicklighter D.W., Bondeau A., Moore III B.,
Churkina G., Nemry B., Ruimy A., Schloss A.L., The Partici-
pants of the Potsdam NPP Model Intercomparison, Comparing
global models of terrestrial net primary productivity (NPP):
overview andkey results, Glob. Change Biol. 5 (Suppl. 1) (1999)
1–15.
[10] DeAngelis D.L., Gardner R.H., Shugart H.H., Producti-
vity of forest ecosystems studied during the IBP: the woodlands
data set, in: Reichle D.E. (Ed.), Dynamics of Forest Ecosystems,
Cambridge University Press, Cambridge, 1981, pp. 567–672.
[11] Dixon R.K., Brown S., Houghton R.A., Solomon A.M.,
Trexler M.C., Wisniewski J., Carbon pools and flux of global fo-
rest ecosystems, Science 263 (1994) 185–190.
[12] Editorial Committee of Forest Series for Different Pro-
vinces, Forest of Anhui, Fujian, Guangdong, Guizhou, Hebei,
Hubei, Hunan, Inner Mongolia, Jiangxi, Jilin, Liaoning, Ning-
xia, Qinghai, Shanxi, Shaanxi, Shandong, Sichuan, Xinjiang and
Xizang, China Forestry Press, Beijing, 1985–1993.
[13] Editorial Committee for Vegetation of China, Vegeta-
tion of China, Science Press, Beijing, 1980.
[14] Fang J.Y., Liu G.H., Xu S.L., Biomass and net produc-
tion of forest vegetation in China, Acta Ecologica Sinica 16
(1996) 497–508.
[15] Fang J.Y., Liu G.H., Xu S. L., Carbon cycle of terrestrial
ecosystems in China and its global significance, Science in Chi-
na (in press).
[16] Fang J.Y., Wang G.G., Liu G.H., Xu S.L., Forest bio-
mass of China: an estimate based on the biomass-volume rela-
tionship, Ecol. Appl. 8 (1998) 1084–1091.
[17] Feng Z.W., Wang X.K., Wu G., Biomass and primary
productivity of forest ecosystems in China, Science Press, Bei-
jing, 1999, 241 p.
[18] Forestry Ministry of China, Summary of Forest Resour-
ces in China (1989–1993), The Forestry Ministry of China, Bei-
jing, 1994.
[19] Gower S.T., Krankina O., Olson R.J., Apps M., Linder
S., Wang C.K., Net primary production and carbon allocation
patterns of boreal forest ecosystems, Ecol. Appl. (in press).
[20] Haxeltine A., Prentice I.C., BIOME3: an equilibrium
terrestrial biosphere model based on ecophysiological cons-
traints, resource availability, and competition among plant func-
tional types, Glob. Biogeochem. Cycles 10 (1996) 693–709.
Biomass and NPP of Chinese forests 367
[21] Lieth H., Whittaker R.H. (Eds.), Primary productivity of
the biosphere, Springer-Verlag, New York, 1975.
[22] Long S.P., Hutchin P.R., Primary productivity in grass-
lands and coniferous forests with climate change: an overview,
Ecol. Appl. 12 (1991) 139–156.
[23] Luo T.X., Patterns of biological production and its ma-
thematical models for main forest types of China, Ph.D. Disser-
tation, Committee of Synthesis Investigation of Natural
Resources, Chinese Academy of Sciences,Beijing, 1996, 211p.
[24] McGuire A.D., Melillo J.M., Kicklighter D.W., Pan Y.,
Xiao X., Helfrich J., Moore III B., Vorosmarty C.J., Schloss
A.L., Equilibrium responses of global net primary production
and carbon storage to doubled atmospheric carbon dioxide: sen-
sitivity to changes in vegetation nitrogen concentration, Glob.
Biogeochem. Cycles 11 (1997) 173–189.
[25] Melillo J.M., McGuire A.D., Kicklighter D.W., Moore
III B., Vorosmarty C.J., Scholss A.L., Global climate change and
terrestrial net primary production, Nature 363 (1993) 234–240.
[26] Melillo J.M., Prentice I.C., Schulze E D., Farquhar G.,
Sala O., Terrestrial biotic responsesto environmental change and
feedbacks to climate, in: Houghton J.T., Meira Filho L.G., Cal-
lender B.A., Harris N., Kattenberg A., Maskell K. (Eds.), Cli-
mate change 1995: The science of climate change, Cambridge
University Press, Cambridge, 1996, pp. 445–482.
[27] Ni J., A simulation of biomes on the Tibetan Plateau and
their responses to global climate change, Mountain Res. Dev. 20
(2000) 80–89.
[28] Ni J., Sykes M.T., Prentice I.C., Cramer W., Modelling
the vegetation of China using the process-based equilibrium ter-
restrial biosphere model BIOME3, Glob. Ecol. Biogeogr. 9
(2000) 463–479.
[29] Olson J.S., Watts J.A., Allison L.J., Carbon in live vege-
tation of major world ecosystems, ORNL 862, Oak Ridge Natio-
nal Laboratory, Oak Ridge, 1983.
[30] Olson R.J., Prince S.D., Global primary Production Data
Initiative Update, Glob. Change Newslett. 27 (1996) 13.
[31] Olson R.J., Scurlock J.M.O., Cramer W., Prince S.D.,
Parton W.J., From sparse field observations to a consistent glo-
bal dataseton net primary production, IGBP-DIS Working Paper
No.16, IGBP-DIS, Toulouse, 1997, 23 p.
[32] Prince S.D., Olson R.J., Dedieu G., Esser G.,Cramer W.,
Global primary production data initiative project description,
IGBP-DIS Working Paper No. 12, IGBP–DIS, Toulouse, 1995,
38 p.
[33] Raich J.W., Rastetter E.B., Melillo J.M., Kicklighter
D.W., Steudler P.A., Peterson B.J., Grace A.L., Moore B.III, Vo-
rosmarty C.J., Potential net primary productivity in South Ame-
rica: application of a global model, Ecol. Appl. 1 (1991)
399–429.
[34] Rosenzweig M.L., Net primary productivity of terres-
trial communities: prediction from climatological data, Am. Nat.
102 (1968) 67–74.
[35] Schimel D.S., Emanuel W., Rizzo B., Smith T.,
Woodward F.I., Fisher H., Kittel T.G.F., McKeown R., Painter
T., Rosenbloom N., Ojima D.S., Parton W.J., Kicklighter D.W.,
McGuire A.D., Melillo J.M., Pan Y., Haxeltine A., Prentice I.C.,
Sitch S.,Hibbard K., Nemani R., Pierce L., Running S., Borchers
J., Chaney J., Neilson R., Braswell B.H., Continental scale varia-
bility in ecosystem processes: models, data and the role ofdistur-
bance, Ecol. Monogr. 67 (1997) 251–271.
[36] Scurlock J.M.O., Cramer W., Olson R.J., Parton W.J.,
Prince S.D., Terrestrial NPP: towards a consistent data set for
global model evaluation, Ecol. Appl. 9 (1999) 913–919.
[37] Turner D.P., Koepper G.J., Harmon M.E., Lee J.J., A
carbon budget for forests of the conterminous United States,
Ecol. Appl. 5 (1995) 421–436.
[38] VEMAPMembers, Vegetation/Ecosystem Mapping and
Analysis Project (VEMAP): a comparison of biogeography and
biogeochemistry models in the context of global change, Glob.
Biogeochem. Cycles 9 (1995) 407–437.
[39] Woodward F.I., Smith T.M., Emanuel W.R., A global
land primary productivity and phytogeography model, Glob.
Biogeochem. Cycles 9 (1995) 471–490.
368 J. Ni et al.
APPENDIX
Data on stand age, leaf area index (LAI), total biomass and net primary productivity (NPP) for each sampling site of 17 forest types in
China, which was obtained from the Ph.D. Dissertation of Luo [23]. The biome classification and characteristics of each forest type are
showed in table I. The methods of measuring LAI, biomass and estimating NPP are described in the Materials and Methods section.
Sites (Province, site name) Latitude
(degree)
Longitude
(degree)
Elevation
(m)
Age
(yr)
LAI
(m
2
m
–2
)
Biomass
(t ha
–1
)
NPP
(t ha
–1
yr
–1
)
1. Boreal forest biome
Larix forest
heilogjiang dahailin 43.58 129.35 800 114 9.55 247.42 13.75
heilongjiang tahelinqu 52.32 124.73 550 111 3.62 89.25 4.74
heilongjiang humahanjiayuan 52.07 125.73 441 75 4.26 96.28 7.32
heilongjiang liangshuilinqu 46.53 131.87 590 108 6.33 143.15 8.08
Biomass and NPP of Chinese forests 369
Sites (Province, site name) Latitude
(degree)
Longitude
(degree)
Elevation
(m)
Age
(yr)
LAI
(m
2
m
–2
)
Biomass
(t ha
–1
)
NPP
(t ha
–1
yr
–1
)
heilongjiang mulenggonghecun 44.12 130.18 800 158 10.16 251.96 12.55
heilongjiang nanwonghe 51.20 125.33 590 104 7.73 196.37 11.65
heilongjiang tahemengke mt. 52.63 124.17 876 53 6.91 125.05 10.49
heilongjiang xunkexian 49.55 128.47 500 85 5.68 137.90 9.08
jilin changbai mt. 42.03 128.13 880 177 15.08 247.16 16.20
neimeng daxianganlinqu 49.43 121.67 650 100 3.24 56.10 3.77
neimeng daxinganlingjiwen 50.58 123.18 700 55 4.33 100.63 9.22
neimeng daxinganlingqigan 52.17 120.75 800 171 4.66 142.04 6.42
neimeng tulihe 50.47 121.65 800 59 3.33 76.01 7.47
neimeng eergunaxian 50.33 120.50 781 136 6.72 171.32 9.65
neimeng jiagedaqi 50.40 126.07 637 136 5.29 130.05 7.26
neimeng zhuoer 48.40 121.33 820 37 5.53 113.59 11.60
neimeng zhuoer mt. 49.15 122.78 1280 39 2.95 66.86 7.24
neimeng deerbuer 50.98 121.02 812 39 4.91 105.63 10.55
neimeng jiwen 50.58 123.18 676 36 3.35 68.16 7.44
neimeng jinhe 51.30 121.47 774 43 4.20 81.08 8.08
neimeng keyihe 50.65 122.45 810 47 4.44 97.76 8.75
neimeng kuduer 50.00 121.53 887 50 5.49 118.32 10.08
neimeng mangui 52.05 122.15 660 59 6.14 124.68 10.19
neimeng moerdaoga 51.28 120.72 737 31 4.83 96.36 10.99
neimeng wuerqihan 49.53 121.32 846 53 5.39 116.20 9.76
shanxi guandi mt, xiaowen mt. 37.88 111.48 2055 53 7.50 179.47 16.68
shanxi ningwunangoumiao 34.90 111.57 2300 55 7.84 177.53 17.35
shanxi pangquangou reserve 37.20 110.77 1850 31 7.99 159.78 16.17
sixhuan xiaojinrilonggou 30.88 101.88 3638 193 6.54 149.82 7.83
sichuan xiaojinxianlinqu 30.98 102.35 3600 164 7.26 163.81 8.52
xinjiang aletaihalama 47.83 88.20 1650 30 2.73 53.38 8.07
xinjiang balikunxian 43.60 93.02 2100 132 6.60 154.86 6.86
xinjiang buergenbailegen 48.12 87.17 1900 71 11.74 243.95 13.25
xinjiang buerjinbiliuti 47.68 86.98 1883 172 11.12 276.82 12.36
xinjiang buerjinbiliute 46.72 86.83 1700 177 14.20 379.51 15.58
xinjiang fuhaixianfuhai 47.78 88.65 1946 107 9.08 199.50 9.56
xinjiang fuyunxian 47.03 89.48 1871 157 15.69 397.11 15.97
xinjiang hamixian 42.83 93.47 2298 139 14.02 314.88 12.88
yunnan deqin 28.50 98.92 4240 100 7.06 156.26 9.10
Mixed coniferous-broadleaved forest
heilongjiang baishilizi 50.72 127.23 300 21 8.89 50.83 7.73
heilongjiang chaihe 44.75 129.68 400 181 6.64 247.45 8.50
heilongjang dailinglizi 47.03 129.03 350 101 4.59 107.03 5.40
heilongjiang donglinliangshui 46.53 131.87 378 124 6.00 197.79 9.20
heilongjiang hulindumuhe 46.35 133.53 264 191 5.55 214.22 7.93
heilongjiang huliwanda mt. 46.33 133.00 240 204 4.79 211.57 7.24
heilongjaing linkouxianqingshan 45.63 132.68 450 21 7.31 42.47 6.84
heilongjaing mulengzhongxin mt. 47.68 125.32 600 238 7.19 245.96 7.79
370 J. Ni et al.
Sites (Province, site name) Latitude
(degree)
Longitude
(degree)
Elevation
(m)
Age
(yr)
LAI
(m
2
m
–2
)
Biomass
(t ha
–1
)
NPP
(t ha
–1
yr
–1
)
heilongjiang niandahailin 44.35 129.47 514 227 9.26 253.48 8.57
heilongjiang shangzhimaoer mt. 45.27 127.50 300 23 11.06 81.94 11.39
heilongjiang yichunwuying 48.13 129.22 403 185 7.27 242.15 8.64
jilin antuxianbaihe 42.47 128.13 650 150 11.25 279.20 14.74
jilin antuxianbaishan 42.10 128.08 770 166 6.09 270.88 12.24
jilin changchunjingyuetan 43.90 125.32 250 48 11.38 104.64 9.12
jilin dongfengxiandayang 42.52 125.40 400 22 9.17 80.81 9.80
jilin dunhuaxianrenyihe 43.37 128.22 696 145 9.21 266.05 12.11
jilin fusongxianlushuihe 42.52 127.80 600 146 8.18 186.29 8.44
jilin linjiangnaozhilinqu 41.93 127.02 300 24 12.53 100.40 13.58
jilin baihechangbai mt. 42.03 128.13 675 110 10.06 239.41 11.75
liaoning caohekoulinqv 40.87 123.88 233 38 17.48 154.22 12.71
liaoning qingyuanxianwandianzi 42.12 124.90 500 20 9.56 61.96 15.10
Abies-Picea forest
gansu zhuonixianmaluxiang 34.67 103.13 3280 96 23.92 238.11 12.49
hebei weichangsaihanba 41.93 117.75 1536 55 7.34 94.58 6.82
heilongjiang dailingliangshui 46.53 131.87 508 77 8.04 128.98 8.29
heilongjiang ningandahailin 44.35 129.47 1017 131 13.12 198.27 9.43
heilongjiang tahemengkeshan 52.63 124.17 950 80 9.78 131.01 7.79
heilongjiang taheshibazhan 52.40 125.43 410 50 4.38 69.98 5.47
heilongjiang tahewalagan 52.53 124.53 487 75 6.50 101.70 6.75
heilongjiang taheweidong 47.85 127.67 523 100 14.39 209.13 11.25
heilongjiang yichundafeng 47.70 128.93 800 104 14.83 207.80 10.78
hubei badongxiaoshennongjia 31.03 110.38 3300 87 8.24 129.53 7.35
hubei fangxiandashennongjia 32.05 101.72 3260 159 8.02 128.17 5.40
hubei shennongjia 31.75 110.67 3200 151 7.76 125.69 5.49
hubei xingshandashennongjia 31.22 110.73 3200 125 5.13 78.90 3.76
jilin changbai mt. 42.03 128.13 1286 142 16.41 262.57 12.03
jilin wangqingdahailin 43.35 129.77 900 132 12.01 177.24 8.46
neimeng baiyingaobaoshadi 45.00 121.00 1300 170 8.23 99.38 5.69
neimeng xibuhelan mt. 39.48 106.70 2384 74 17.49 100.44 8.38
shanxi guancenshanqiuqiangou 39.37 112.37 2310 57 10.95 139.82 9.27
shanxi fopingchangjiaobaxiang 33.53 108.00 2680 80 11.64 183.84 10.79
shanxi ningshanxianxinming 33.32 108.33 2250 76 8.72 143.09 8.75
shanxi qinlingna dongtaibai 33.95 107.78 2772 125 9.57 149.66 7.13
shanxi yangxianxingjiangling 33.22 107.55 2770 98 8.73 134.51 7.82
sichuan baiyu 31.23 98.83 3550 184 8.05 199.42 5.50
sichuan zhuosijiataiyanghe 31.80 101.63 3750 178 8.68 318.33 7.39
sichuan daofu 30.98 101.13 3675 165 11.06 330.97 7.88
sichuan ebianlewuchuannan 28.85 103.03 3075 184 10.01 660.04 14.13
sichuan heishuixian 32.07 102.97 3480 166 10.72 358.30 9.13
sichuan jiulongxian 29.02 101.52 3633 169 7.13 311.02 8.39
sichuan lixian 31.43 103.17 2804 163 12.06 328.35 10.83
sichuan lixianmiyaluo 31.67 102.80 3000 169 12.94 341.94 9.18
sichuan maerkangshuajingsi 32.02 102.63 3475 206 9.94 407.74 8.02
Biomass and NPP of Chinese forests 371
Sites (Province, site name) Latitude
(degree)
Longitude
(degree)
Elevation
(m)
Age
(yr)
LAI
(m
2
m
–2
)
Biomass
(t ha
–1
)
NPP
(t ha
–1
yr
–1
)
sichuan maerkangxian 31.92 102.22 3638 243 6.55 287.66 6.18
sichuan maerkangzhuokeji 31.87 102.27 3500 119 18.98 462.00 14.90
sichuan maoxian 31.68 103.87 3178 91 12.86 293.13 10.37
sichuan mulixian 27.92 101.25 3722 144 9.77 269.65 8.31
sichuan nanpingbaihexiang 33.35 104.12 3200 122 10.26 248.51 8.65
sichuan nanpingdaluxiang 33.57 103.67 3200 103 10.75 232.38 8.77
sichuan nanpingheihexiang 33.95 102.38 3200 143 10.79 325.18 10.66
sichuan nanpingjiuzhailinchang 33.28 103.90 3200 171 5.93 201.50 5.73
sichuan nanpinglingjiangxiang 31.03 106.35 3200 134 10.83 228.93 7.91
sichuan nanpinglongkangxiang 33.23 104.20 3238 169 7.50 214.97 5.97
sichuan nanpingmajiaxiang 29.10 106.98 3200 170 8.26 273.75 8.15
sichuan nanpingyonghexiang 33.00 104.00 3200 128 6.24 150.48 5.51
sichuan nuoergaibaxixiang 33.63 103.20 3500 148 10.89 248.43 7.46
sichuan nuoergaibaozuoxiang 33.62 103.35 3500 150 11.70 367.97 10.69
sichuan nuoergaicaopoxiang 33.50 102.67 3500 144 7.85 170.98 5.74
sichuan nuoergailinyeju 33.62 102.95 3500 137 9.36 192.98 6.28
sichuan nuoergailongzhaxiang 33.20 103.20 3500 114 11.12 225.30 10.44
sichuan nuoergaishangbaozuo 33.78 103.40 3238 140 8.59 265.17 8.05
sichuan nuoergaixianqiuxiang 33.70 103.33 3500 133 10.71 237.79 7.56
sichuan nuoergaizhanwaxiang 33.05 102.88 3500 90 8.44 137.99 6.15
sichuan songpan 32.65 103.58 3273 46 14.97 137.36 12.61
sichuan tianquanxiandahe 30.10 102.77 2900 55 15.22 161.28 10.94
sichuan xiaojinxian 30.98 102.35 3208 214 7.32 278.77 6.71
sichuan xinlong 30.95 100.28 3800 317 10.51 465.66 7.53
sichuan yajiangxian 30.03 101.00 3758 164 8.30 221.87 6.25
sichuan wenchuanxianwolongguan 30.98 103.13 2805 133 9.85 289.93 9.55
xizang bomilinqu 29.88 95.75 2750 350 40.69 1569.85 14.97
xizang chayuzhuwagen 28.63 97.50 3500 175 6.33 493.78 11.17
xizang changdu 31.18 97.17 3900 100 10.55 137.65 5.41
xizang changdubianbaxian 30.93 94.70 4150 113 5.98 150.97 4.62
xizang changdubomiyigong 30.15 94.98 2620 50 6.08 101.29 6.48
xizang changdubomizhamu 29.88 95.75 3237 152 5.81 473.00 11.29
xizang changdujiangdaxian 31.52 91.20 3900 120 6.49 217.15 6.02
xizang jiangdaxianjiangda 29.98 93.15 3750 100 9.29 164.20 5.88
xizang changduleiwuqixian 31.20 96.60 3800 100 7.03 135.19 4.74
xizang changduluolong 30.80 95.77 3982 110 8.06 150.57 5.25
xizang changdumangkangxian 29.67 98.53 4180 150 9.31 212.35 6.18
xizang zuogongxianwangda 29.68 97.87 3999 116 9.32 222.68 7.23
xizang gongbujiangda 29.92 93.25 3642 129 6.26 242.49 7.22
xizang linzhixiansiyilin 29.57 94.50 3631 143 4.48 243.27 6.64
xizang milinxiantiemolong 29.17 94.17 3274 140 5.24 283.15 7.61
xizang linzhimafenggou 29.28 94.37 3428 149 6.04 340.91 9.60
xizang lulangxianlulang 29.80 94.72 3540 86 7.24 284.39 11.67
xizang nielamu 28.17 85.98 2590 140 4.02 328.38 8.00
xizang rikazejilongxiang 28.88 85.27 2786 131 3.58 254.23 7.44
372 J. Ni et al.
Sites (Province, site name) Latitude
(degree)
Longitude
(degree)
Elevation
(m)
Age
(yr)
LAI
(m
2
m
–2
)
Biomass
(t ha
–1
)
NPP
(t ha
–1
yr
–1
)
xizang jilongxianwuyiji 28.75 85.32 3350 192 3.68 258.90 5.74
xiznag zhangmuwuyizhang 28.00 86.00 2710 170 4.74 320.10 7.99
xizang shannanlangxian 29.03 93.13 3835 160 6.11 225.84 6.08
xizang shangchayubenzhui 28.80 96.68 2000 76 3.29 334.37 13.59
xizang xiachayushawo 28.50 97.00 3616 144 7.68 367.74 10.05
xizang xuekalonggou 30.02 93.68 3600 125 4.88 265.81 8.36
xinjiang fukangxiantianchi 44.20 88.05 2173 128 15.62 202.78 5.87
xinjiang gongliuxian 43.47 82.22 1870 96 30.72 473.47 16.58
xinjiang gongliuxiaomohe 43.60 82.65 1895 115 33.60 571.25 16.97
xinjiang jimusaer 44.00 89.18 2197 122 19.99 282.87 8.29
xinjiang manasixianliuqu 44.30 86.22 2050 122 25.51 342.52 10.25
xinjiang muleixian 43.80 90.35 2210 86 13.56 166.97 7.87
xinijang shawangxiaodonggou 44.32 85.57 2240 58 11.56 109.77 6.19
xinjiang tekesikukesu 43.22 81.82 2500 261 29.31 487.35 9.90
xinjiang wulumuqimiquan 43.97 87.68 2285 178 21.25 294.11 7.29
xinjiang wulumuqinanshan 43.18 93.68 2200 108 17.02 222.88 8.91
xinjiang wusutianshandongou 44.47 84.68 2170 97 18.20 224.61 7.72
xinjiang zhaosuxian 43.13 81.10 2283 116 25.29 361.67 10.93
yunnan diqingweixi 27.80 99.70 3390 90 14.51 293.31 10.83
yunnan deqin 28.50 98.92 3790 175 9.45 395.40 10.37
yunnan lijiang 26.87 100.23 3240 120 11.90 392.27 10.91
yunnan ninglang 27.30 100.82 3820 120 9.05 212.35 7.41
yunnan weixi 27.15 99.28 3260 160 6.40 286.02 7.37
yunnan yunlong 25.90 99.37 3055 105 6.24 246.05 8.83
yunnan zhongdianxianjisha 27.80 99.70 3200 155 8.13 293.41 7.30
Montane Populus-Betula forest
beijing baihuashan linchang 39.87 115.60 1500 31 3.38 49.73 6.11
beijing dongling mt. 40.03 115.45 1492 58 8.24 87.34 10.05
guizhou fenggang 27.97 107.72 680 27 3.22 67.98 8.78
guizhou nayongxiankunzhiqu 26.77 105.37 1800 25 11.19 193.76 25.93
guizhou sandu 26.03 106.62 748 36 9.07 228.07 23.80
hebei chengdexianbeida mt. 40.98 117.95 1170 31 6.69 113.23 13.63
hebei chongliheping 40.98 115.25 1600 50 6.53 116.39 11.18
hebei fengning dengshanzi 41.23 116.32 1300 40 5.22 84.24 9.07
hebei kuanchengshigou 40.60 118.50 1400 42 6.94 127.42 12.94
hebei longhuajianfang 41.67 117.20 1260 33 5.37 89.51 10.37
hebei weichanglongtou mt. 41.98 117.68 1600 37 4.71 82.07 8.93
hebei weichangyinhe 42.28 118.97 1600 30 5.99 96.17 11.75
heilongjiang bolixian 45.73 130.55 350 78 8.47 166.45 12.49
heilongjiang dahailin 44.35 129.47 450 66 6.98 138.20 11.15
heilongjiang humahanjiayaun 52.07 125.73 261 36 3.97 68.81 7.77
heilongjinag humafuergen 51.70 126.65 507 79 6.21 115.68 9.21
heilongjiang humahetan 51.63 126.70 400 44 9.64 190.13 19.38
heilongjiang hulindumuhe 46.35 133.53 226 61 9.72 155.92 16.03
heilongjiang mulengsibingyi 44.90 130.52 880 53 9.42 183.10 16.32
Biomass and NPP of Chinese forests 373
Sites (Province, site name) Latitude
(degree)
Longitude
(degree)
Elevation
(m)
Age
(yr)
LAI
(m
2
m
–2
)
Biomass
(t ha
–1
)
NPP
(t ha
–1
yr
–1
)
heilongjiang mulenghuangguogou 44.52 130.20 800 77 4.59 92.16 6.93
heilongjinag ninganludao 43.87 129.28 650 49 8.17 132.99 12.64
heilongjiang raohewanda mt. 46.80 134.00 170 81 11.64 160.96 15.81
heilongjiang shangzhiwanshan 45.00 128.27 450 26 9.38 146.04 20.22
heilongjiang shanzhimaoer mt. 45.27 127.50 455 32 5.01 175.20 16.63
heilongjinag tahewalagan 52.53 124.53 500 45 7.63 76.13 7.85
heilongjiang wuchangshenglixiang 44.90 127.62 533 44 10.02 176.65 18.26
heilongjiang xunkexain 49.55 128.47 700 63 7.92 152.09 12.98
heilongjiang yichundailing 47.03 129.03 600 68 10.47 161.06 14.77
heilongjiang dailingliangshui 46.97 128.83 400 66 7.90 140.51 12.24
jilin antuerdaobaihe 42.43 128.13 600 35 10.13 93.53 13.96
jilin changbai mt. 42.03 128.13 590 58 8.74 151.05 14.55
jilin changbai mt. linjiang 41.82 126.88 845 83 12.38 213.02 17.88
jilin dunhuaxian renyihe 43.37 128.22 817 40 9.51 137.19 16.04
jilin helongqingshanlinchang 42.45 128.85 650 41 12.11 198.98 21.93
jilin hunjiangwujianfang 41.93 126.43 550 30 5.31 88.10 11.03
jilin liuhexiandabeicha 42.27 125.73 600 30 9.85 168.54 20.74
jilin shulan guijiafang 44.40 126.95 550 78 10.98 201.70 16.58
jilin shulanxianmaanshan 43.43 125.20 590 27 9.15 156.75 20.89
jilin wangqingxian 43.35 129.77 650 68 10.59 189.92 17.26
jilin yanjisandaowan 43.17 129.18 800 35 10.81 182.35 21.21
jilin yanjizhixinlinchang 42.65 129.53 847 37 11.72 182.74 20.61
jilin yongjiwangqifenchang 43.57 126.72 650 25 7.88 131.64 18.11
jilin huadianhongshilinchang 42.97 127.12 684 40 10.75 192.11 21.15
liaoning jianpingheishuilinchang 42.07 119.40 500 34 10.40 174.75 20.98
neimeng eerguna 50.80 121.48 712 50 8.76 142.71 14.32
neimeng ningchengheilihe 41.60 119.32 1434 37 9.47 148.48 18.10
nemeng daxingan mt. 49.43 121.67 150 69 9.89 198.58 16.72
neimeng humaxian 51.70 126.65 800 79 5.95 125.03 9.39
neimeng wulashanlinchang 40.75 109.45 800 38 8.22 134.17 15.94
neimeng yaluxianamuniu 48.55 122.13 600 68 12.31 216.77 18.01
ningxia liupanshanlinqu 35.70 106.18 2125 29 4.07 72.45 8.45
qinghai datongxiandongxia 36.93 101.67 2650 39 12.36 67.68 16.24
shanxi fopingxianyilongling 33.53 108.00 2637 44 8.40 141.52 14.26
shanxi lueyang qinlingxinan 33.33 106.17 2060 52 5.48 84.49 8.59
shanxi ningshanxiancaiziping 33.32 108.33 2137 48 7.51 127.38 13.00
shanxi ningshanxianhuoxhitang 33.43 108.43 1950 47 6.77 79.45 8.39
shanxi ningshanxianxunyangba 33.55 108.55 2210 49 8.61 146.76 13.85
shanxi qingling napoxibu 33.67 107.63 1700 56 7.37 153.46 12.91
shanxi qinlingzhongduan 33.50 107.00 1700 65 6.79 119.25 10.06
sixhuan baiyuxian 31.23 98.83 3300 45 9.53 173.60 18.11
sixhuan baoxinxiannaozi 30.70 102.72 2580 52 6.42 121.01 10.93
sichuan lixian 31.43 103.17 2600 94 13.23 248.07 16.65
sichuan nanpingdaluxiang 33.57 103.67 3180 110 9.66 171.43 11.86
sichuan xiaojinxian 30.98 102.35 2850 63 8.40 166.14 14.06
374 J. Ni et al.
Sites (Province, site name) Latitude
(degree)
Longitude
(degree)
Elevation
(m)
Age
(yr)
LAI
(m
2
m
–2
)
Biomass
(t ha
–1
)
NPP
(t ha
–1
yr
–1
)
sichuan wenchuanxianwolongguan 30.98 103.13 2185 82 6.42 121.38 8.53
xizang changdubomitongmai 30.15 95.10 2300 50 13.95 298.16 27.67
xizang lasagongbujiangda 29.92 93.25 3355 58 4.17 87.41 7.42
xizang rikazejilongxian 28.88 85.27 3500 50 3.12 64.11 5.69
xizang shangchayumuzhongxiang 28.80 96.68 2335 81 8.80 174.01 14.46
xizang xiachayujiongdong 28.50 97.00 2010 50 9.51 137.62 14.00
yunnan weixixian 27.15 99.28 3012 72 10.98 224.72 17.28
yunnan zhongdianxian 27.80 99.70 3400 26 5.44 84.30 11.04
Pinus sylvestris var. mongolica forest
helongjiang tahe 52.32 124.73 500 134 5.09 131.53 6.20
heilongjiang humahanjiayuan 52.07 125.73 608 84 5.99 102.41 7.19
helongjiang mohefukeshan 52.68 122.05 560 93 5.87 126.55 7.00
heilongjiang mohemaniqi 53.02 122.45 600 150 6.58 145.26 6.94
heilongjiang tahemengkeshan 52.63 124.17 900 53 6.17 94.82 8.14
heilongjiang wudaogouxian 50.25 126.38 890 180 5.88 150.54 5.44
neimeng eerguna 50.80 121.48 832 130 5.60 118.98 6.04
neimeng qiganchangdian 52.17 120.75 633 171 5.69 157.99 6.41
neimeng xinixili 43.52 112.05 700 63 5.62 98.11 6.60
2. Deciduous broad-leaved forest biome
Typical deciduous broad-leaved forest
beijing donglingshan 40.03 115.45 1365 61 11.12 115.65 13.59
guizhou banqiaohelinqu 27.97 106.90 540 25 5.85 81.94 10.59
hebei chengdexianbeida mt. 40.77 118.15 1300 26 4.56 84.33 10.29
hebei kuanchengshuigoulinchang 40.60 118.50 1200 30 5.38 109.44 11.96
hebei pingquandawopu 41.02 118.68 1150 33 4.46 86.05 9.05
hebei qinglongdushanlinchang 40.52 118.82 1100 26 5.50 107.71 12.83
hebei xinglongxian wuling mt. 40.60 117.48 1005 32 5.90 120.87 11.84
heilongjiang bolixiantieshan 45.73 130.55 293 38 4.55 82.93 8.34
heilongjiang humaxian 51.70 126.65 350 120 5.25 86.40 6.23
heilongjiang hulindumuhe 46.35 133.53 177 77 7.68 173.92 13.36
heilongjiang hulinwanda mt. 46.33 133.00 190 84 5.41 109.77 7.52
heilongjiang raohewanda mt. 46.80 134.00 218 103 6.31 141.02 8.82
heilongjiang shangzhimaoer mt. 45.27 127.50 492 32 7.82 125.64 14.71
heilongjiang shangzhixianwanshan 45.00 128.27 500 37 9.59 138.04 14.82
heilongjiang wuchangshwnlixiang 44.90 127.62 383 40 7.43 145.35 14.49
heilongjiang dailingliangshui 47.03 129.03 500 65 5.40 94.98 7.66
heilongjiang huachuanxian 47.02 130.70 240 69 6.56 135.88 11.11
jilin antuxianchangbai mt. 43.12 128.90 550 140 6.52 204.03 11.02
jilin changbailinqu 42.03 128.13 800 157 8.52 247.33 12.16
jilin dunhuaxianrenyihe 43.37 128.22 650 156 11.25 201.84 12.61
jilin helongxiandongchang 42.53 129.00 615 39 5.00 90.81 9.49
jilin linjianglinyeju 41.82 126.88 700 125 5.17 164.13 7.72
jilin mulengxian 44.52 130.20 650 102 6.62 113.96 8.17
jilin wangqingxiansengongju 43.35 129.77 450 101 8.33 180.22 11.24
jilin wangqingxianqinhe 43.32 129.53 450 38 6.67 125.09 12.65
Biomass and NPP of Chinese forests 375
Sites (Province, site name) Latitude
(degree)
Longitude
(degree)
Elevation
(m)
Age
(yr)
LAI
(m
2
m
–2
)
Biomass
(t ha
–1
)
NPP
(t ha
–1
yr
–1
)
jilin yanjixianzhixin 42.65 129.53 450 28 4.22 77.50 9.00
jilin yongjixianwangqi 43.57 126.72 450 20 4.11 79.24 11.15
jilin huadianmaoshanlinchang 42.97 126.73 460 48 7.52 152.25 13.60
liaoning xinbinxiansankuaishi 41.72 125.03 350 51 6.51 156.16 13.05
liaoning kuandianbaishilizi 40.72 124.77 400 24 8.23 88.14 10.66
liaoning fuxinxianzhoujiadian 40.53 122.73 350 26 4.40 80.49 9.01
neimeng jiagedaqizhen 50.40 124.07 498 97 4.46 72.80 5.46
ningxia liupanshanlinqu 35.70 106.18 2050 32 7.61 100.97 13.30
shandong mengyanxiantaoquxiang 35.72 117.93 400 20 5.07 58.16 8.99
shandong taianshitai mt. 36.37 117.08 700 23 5.60 71.48 11.09
shanxi luliangshan jiaokou 37.48 111.13 1785 63 9.73 130.67 12.15
shanxi qinyuanjiangtailinchang 36.50 112.32 1810 55 11.39 151.32 14.81
shanxi sandaochuanxiongchaogou 37.40 110.63 1400 50 7.11 105.44 12.10
shanxi taiyue mt. shigao mt. 36.75 112.03 1400 45 5.71 67.73 7.07
sichuan napingxiandaluxiang 33.57 103.67 2160 80 6.83 121.96 11.08
sichuan songpanmaoergai 32.65 103.08 2600 120 8.22 151.31 12.24
Tugai forest
xinjiang muoyumazhahetian 37.15 79.92 900 35 0.56 91.37 8.41
xinjiang talimuhe xiayou 40.37 88.03 900 50 0.17 34.06 2.41
xinjiang talimuhe shangyou 39.00 78.00 900 40 0.25 51.87 4.22
xinjiang talimuhe zhongyou 41.02 83.18 925 33 0.80 61.24 6.85
xinjiang yeerqianghetianhe 40.50 81.93 900 40 0.20 34.10 2.87
xinjiang talimuhelutai 41.78 84.28 950 53 0.26 55.56 4.02
xinjiang manasipingyuan 44.30 86.22 650 30 2.87 86.84 9.05
xinjiang habahexain 48.03 86.43 500 25 1.70 48.04 5.90
3. Evergreen broad-leaved forest biome
Typical evergreen broad-leaved forest
fujian changtingfuchengwolong 25.85 116.35 400 45 16.64 198.34 17.94
fujian fuzhougushan 26.07 119.38 400 71 22.03 474.05 31.23
fujian huaanjinshandaoshi 24.78 117.30 400 47 22.66 397.03 31.06
fujian jianoufangdaopankeng 27.00 118.13 870 20 7.34 204.39 30.67
fujian jianouxianwanmujing 27.05 118.33 380 120 23.89 396.56 19.32
fujian minqingxianxiongjiangxiang 26.33 118.73 650 50 15.98 300.56 25.84
fujian nanpingshimaodixiang 26.70 118.05 860 200 27.95 576.58 24.00
fujian nanpingshimengtuanyang 26.63 118.17 1100 40 9.75 215.15 19.32
fujian puchengxianshibeixiang 27.68 118.58 550 29 8.49 220.48 26.16
fujian sanmingshishenkouxiang 26.22 117.60 423 99 23.67 554.06 26.39
fujian shanghangxianxingyunxiang 25.05 116.40 750 45 14.73 235.79 24.59
fujian shaowujinhangguilin 27.15 117.17 750 40 14.18 318.50 29.81
fujian shaowushinakouxiang 27.15 117.63 793 55 15.83 397.52 32.43
fujian shaowushishuibeixiang 27.33 117.48 438 115 24.29 508.05 26.32
fujian shaowushiminsheshan 27.07 117.68 415 80 26.77 496.95 31.41
fujian zhangpingxianmeishuikeng 25.23 117.52 450 50 16.81 324.62 28.71
guangdong dinghushanlinqu 23.18 112.52 270 200 20.75 428.57 26.68
guangdong haikanglongmenzurong 20.68 110.00 80 22 13.99 209.44 31.21