Báo cáo khoa học: "Belowground biomass and nutrient content in a 47-year-old Douglas-fir plantation" pptx
Bạn đang xem bản rút gọn của tài liệu. Xem và tải ngay bản đầy đủ của tài liệu tại đây (966.08 KB, 8 trang )
Original article
Belowground biomass and nutrient content in a
47-year-old Douglas-fir plantation
Jacques Ranger
*
and Dominique Gelhaye
INRA Centre de Nancy, Cycles biogéochimiques, 54280 Champenoux, France
(Received 17 July 2000; accepted 6 October 2000)
Abstract – Biomass and nutrient content of the root system of a Douglas-fir stand were calculated using the regression technique. Nine
trees, evenly distributed in the girth classes of the stand, were felled for measurements and sampling. Results were compared to publis-
hed data.Statistically significantrelationships betweentree circumferenceat 1.30m androot biomassor nutrientcontent wereobserved.
The root biomass was 58 t of dry matter, which was 18% of the total stand biomass. A linear model characterized the relationships bet-
ween aerial and belowground biomass of 38 Douglas-fir stands previously described in the literature. This simple relationship is very
useful when using estimates of the aerial biomass of a stand to calculate the carbon storage in the belowground compartment. Nutrient
concentration inthebelowground compartmentwas lower thanin theaerial biomass. However,very fineroots and mycorrhizaewere not
considered. Contrary to aerial biomass, very few published data were found for belowground biomass, hindering any generalization for
the nutrient content of the belowground compartment.
Douglas-fir / root system / C sequestration / nutrient content
Résumé – Biomasse et minéralomasse de la partie souterraine d’un peuplement de Douglas de 47 ans. La biomasse et le contenu
minéral du système racinaire d’un peuplement de Douglas ont été estimés au moyen de régressions, à partir d’un échantillonnage des-
tructif portant sur 9 arbres répartis dans toutes les classes de diamètre à 1,30 m du peuplement. Le résultat a été comparé aux données de
la littérature. Il existe des relations statistiquement significatives entre le diamètre à 1,30 m d’un arbre et sa biomasse racinaire ou son
contenu enéléments nutritifs. Cesrelations conduisentà un modèleprévisionnel. Lesrésultats indiquent quela biomasseracinaire atteint
58 t de matière sèche dans le peuplement étudié, soit 18 % de la biomasse totale du peuplement. La souche et les grosses racines repré-
sentent 89 % de cette biomasse.Un simple modèle linéaire relie la biomasse aérienne et labiomasse souterraine pour 38 peuplements de
Douglas décrits dans la littérature, ce qui permet de calculer assez facilement le stockage de carbone dans le compartiment souterrain,
connaissant la biomasse aérienne d’un peuplement. Pour ce qui concerne les éléments nutritifs, le compartiment souterrain est globale-
ment relativementplus pauvreque le compartiment aérien, mais les trèsfines racinesvoire lesmycorhizes n’ont pas été prises en compte
dans cette étude. Trop peu de données existent pour généraliser l’information.
Douglas / système racinaire / contenu en carbone / minéralomasse
Ann. For. Sci. 58 (2001) 423–430
423
© INRA, EDP Sciences, 2001
* Correspondence and reprints
Tel. 33 (0)3 83 39 40 68; Fax. 33 (0)3 83 39 40 69; e-mail:
1. INTRODUCTION
Investigations into the belowground part of plants is
necessary for very different purposes:
– characterising thevolume of soil fromwhich trees take
up their nutrients and delimiting the ecosystem for nu-
trient budget calculation [3, 22];
– quantifying C and nutrient sequestration in the under-
ground woody structures [2, 6, 13];
– quantifying organic matter released underground into
the soil by plants at thinning and/or clearcutting [7];
– quantifying the current turnover ofCand nutrients due
to root decomposition [1, 8, 16];
– characterising tree anchorage.
Though its significance is globally recognised, a very
limited part of the research potential was focused on the
root compartment. Not only because excavating root sys-
tems is a difficult task , but more probably because we
lack an adequate method to properly study the dynamics
and functions of this part of the ecosystem, which could
represent 25% of a stand total biomass [23].
Several reviews based on the existing database of the
literature led to the following conclusions:
– In a stand, there is usually a good relationship between
tree diameter and belowground biomass, as it is the
case for aerial components [23]. The regression
method was consequently very often used to develop
biomass tables and quantifyroot system biomass at the
stand level [5, 14, 15, 17, 18, 20, 21]. Prediction at this
level is reasonably accurate, depending of course on
sample quality. Coarser components are usually accu-
rately quantified whereas finest roots and
mycorrhyzae are the most poorly quantified compart-
ments [12], or are not taken into account as their bio-
mass does not enable a good estimation of their
activity.
– Even when considering the whole literature, it is not
possible to identify general significant trends in terms
of explanatory variables such as climate, soil type, for-
est species or stand age [23]. Dupouey et al. (1999) [6]
calculated an expansion factor (ratio between
belowground biomass and stand total biomass) based
on 200 studies in order to evaluate belowground C-
content in stands at a national level, but found no dis-
criminating variable, especially stand age. The high
variability in the expansion factor (between 1.1 to 1.4)
indicates large differences between stands, without us
being able to find the factors involved.
It appeared that too few situations had been studied to
avoid a confounding effect between explanatory vari-
ables: more observation was needed.
The objective of the present work was to quantify the
belowground biomass and nutrient content of a Douglas-
fir stand and to correlateitwith aerial biomass accumula-
tion. Compilation of the data for Douglas-fir found in the
literature (38 case studies) was performed in order to
check whether there was a simple regression line. It will
be interesting to predict the belowground biomass of a
stand using theaerialbiomass measurement alone, as itis
usually the available information.
2. MATERIALS AND METHODS
2.1. The study site is located in the Beaujolais
mountains, 40 km NW of Lyon (France)
The forest stand is a plantation of Douglas-fir
(Pseudotsuga menziesii Mirb.). Trees were 47 years old
when root-systems were excavated. Measurement of ae-
rial biomass was performed in 1992 [19]. In 1999, stand
increment between 1992 and 1999 was estimated from
circumference at breast height (C
130
) inventory, and from
application of biomass and nutrient tables calculated in
1992. The main characteristics of the ecosystem are the
following:
– altitude: 750 m;
– mean annual rainfall: 1 000 mm;
– mean annual temperature: 7
o
C;
– geology: volcanic tuff dated from the Visean period;
– soil: Typic Dystrochrept, acidic and desaturated
(mean characteristics are presented in table I);
– stand: Douglas-fir plantation on a previously affor-
ested site on a former agricultural land (mean stand
characteristics are presented in table II).
2.2. Stand biomass and nutrient content
measurements
The method used was described by Ranger et al.
(1992, 1995) [18, 19]. The main steps were the follow-
ing:
– forest inventory on an area depending on mean tree
size;
424 J. Ranger and D. Gelhaye
Belowground biomass of Douglas 425
Table I. Main soil characteristics for the 60 year-old stand. (Data supplied are for air-dry material except for granulometry and total analysis expressed for 105 °C dried
material) .
Particle size distribution Total element Free element
soil layer (cm) Clay % Silt % Sand % Org. Mat. (%) Norg.(%) C/N Ca tot. (%) Mg tot. (%) K tot. (%) P
2
O
5
tot.(%) Al Tamm (%) Fe DCB (%)
A1Ap 0-15 19.9 43.6 36.6 5.7 0.27 12.3 0.10 0.50 3.12 0.13 0.66 0.97
Ap2 15-30 19.5 44.6 36.0 3.8 0.20 11.2 0.12 0.59 3.25 0.14 0.55 0.95
A(B) 30-45 23.6 44.9 31.6 1.6 0.09 10.8 0.10 0.65 3.33 0.13 0.37 0.91
(B)1 45-65 22.0 41.9 36.2 0.14 0.74 3.46 0.12 0.29 0.90
(B)2 65-85 18.5 39.7 41.9 0.11 0.82 3.67 0.12 0.23 0.80
(B)/C 85-105 14.8 38.3 46.9 0.13 0.85 3.68 0.10 0.17 0.78
C1 105-115
Exchangeable element
soil layer (cm)
pH(H
2
O)
K
(cmol
c
kg
–1
)
Ca
(cmol
c
kg
–1
)
Mg
(cmol
c
kg
–1
)
Mn
(cmol
c
kg
–1
)
Fe
(cmol
c
kg
–1
)
Na
(cmol
c
kg
–1
)
Al
(cmol
c
kg
–1
)
BC
(cmol
c
kg
–1
)
BC/CEC(%)
CEC
(cmol
c
kg
–1
)
P
2
O
5
avail.
(%)
A1Ap 0-15 4.4 0.24 1.12 0.17 0.20 0.02 0.05 5.94 1.64 20.3 8.1 0.02
Ap2 15-30 4.4 0.13 0.21 0.05 0.06 0.00 0.06 4.84 0.49 8.9 5.5 0.02
Ap(B) 30-45 4.4 0.11 0.17 0.05 0.05 0.00 0.06 4.68 0.43 8.1 5.3 0.02
(B)1 45-65 4.4 0.15 0.14 0.04 0.05 0.00 0.05 4.47 0.43 8.5 5.1 0.02
(B)2 65-85 4.4 0.13 0.14 0.04 0.03 0.00 0.06 4.27 0.43 8.9 4.8 0.02
(B)/C 85-105 4.4 0.12 0.13 0.07 0.04 0.00 0.05 4.44 0.42 8.3 5.1 0.01
C1 105-115 4.4 0.13 0.03 0.04 0.02 0.00 0.02 4.36 0.27 5.6 4.8 0.02
– selection of 12 trees belonging to every girth class de-
rived from the inventory;
– destructive sampling for volume, biomass, water and
nutrient content;
– calculation of biomass and nutrient content tables;
– application of the tables to the stand inventory to esti-
mate stand biomass and nutrient content on a hectare
basis.
2.3. Root system
2.3.1. Excavation
The selected trees werefallen to collect the whole root
system. Nine trees classified according to girth classes
derived from the stand inventory, were selected.
Approximatively one metre deep trenches were dug half-
way between each neighbouring tree. The tree was at-
tached with a cable and pulled with a tackle. A
mechanical digger was used to fell the tree. The root sys-
tem was manually cleaned for fine root collection. The
stem was cut and the remaining part of the root system
was then lifted using the mechanical digger. Earth and
stones were then removed using a high pressure cleaner.
Three root classes were defined: (i) fine roots with a di-
ameter below 1 cm, (ii)medium roots with a diameter be-
tween 1 and 4 cm and (iii) large roots with a diameter
over 4 cm. The remaining part, which we called “stump”,
was in fact the stump and the taproot; part of the stump
belongs to the aerial biomass, but is not generally har-
vested.
Big roots cut by the excavator or left in the outer part
of the trench were collected. In the present study, accu-
rate observation of the trenches showed that very few
roots were outside the inner volume limited by the
trenches, probably because the plantation was initially
denser than at the time of the experiment.
All the fresh belowground compartments were
weighed after cleaning, and appropriate representative
samples were collected: three disks, two centimetre
thick, were collected in the different classes of roots.
2.3.2. Sample treatments
Once collected and put in a plastic bag after having re-
corded fresh weight, the samples were oven-dried to a
constant weight at 65
o
C. Total N was measured by
colorimetry after Kjeldahl mineralisation, P, K, Ca and
Mg contents were measured after acid digestion of the
finely ground material, by ICP spectrophotometry.
2.3.3. Calculation of belowground biomass and
nutrient content tables
The same procedure was used as for measuring aerial
biomass [19]. Tables were calculated trying to (i) elimi-
nate bias, (ii) minimise the root mean square error and
(iii) maximise the adjusted R
2
value. These tables were
then applied to the stand inventory to calculate the
belowground biomass on a hectare basis.
Unistat software was used for statistical analyses.
3. RESULTS AND DISCUSSION
3.1. Biomass and nutrient content tables
Provisional tables were obtained for biomass and nu-
trient content in the belowground compartment of the
stand. Second degree polynomial regression using diam-
eter at breast height as an explanatory variable was con-
sistent with the observations and resulted in R
2
coefficient equal to 0.86.
As generally observed when similar calculations were
performed for the different stand compartments, R
2
val-
ues were statistically different ofzero at the 1% probabil-
ity level for larger compartments (i.e. large roots) but not
for smaller ones(i.e. fine roots). Thiscanbe explained by
the fact that tree diameter is a cumulative variable, as is
the case for larger compartments, but this is not the case
for the finest roots, the behaviour of which mostly de-
pends on the current tree development.
The situation was identical for nutrient content, with
R
2
values ranging from 0.5 to 0.9. A rather low coeffi-
426 J. Ranger and D. Gelhaye
Table II. Main stand characteristics.
Number of trees per ha Mean tree circumference Mean tree basal area Basal area per ha Mean stand height
350 137 cm 0.154 m
2
46 m
2
31 m
cient was observed for Ca, due to large variability be-
tween trees for this element.
The tables calculated for biomass and nutrient content
of the belowground compartment are presented in ta-
ble III.
3.2. Belowground biomass of the stand compared
to the aerial part
Total belowground biomass of the stand amounted to
58 t of dry matter per ha, which represents
approximatively 29 t of C for an aerial biomass of 272 t
(table IV). This represents about 18% of the stand total
biomass. The basal stem, usually not harvested, was in-
cluded in the belowground biomass. Stump and large
roots represented 89% of the belowground compartment,
in which the aerialbasal stem could represent about 15%.
The finest roots representedless than 4%. The proportion
of bark was about 15% for larger compartments, i.e.
stump and large roots (ona dry weight basis), but was not
quantified for medium and fine roots.
It is useful to compare the belowground biomass
which is generally not harvested with the aerial slash,po-
tentially easier to remove from the site (including
silvicultural practices such as removing or burning stand
harvest residues). In the present situation needles and
branches represented about 12% of the stand total
Belowground biomass of Douglas 427
Table III. Main biomass and nutrient content tables calculated
for belowground compartments.
Equation R
2
Total belowground biomass (including stump)
TBB = 0.000155 X
2
– 0.0908243 X 0.87
Stump biomass (bark + wood)
SB = 0.00006147 X
2
– 0.02911105 X 0.88
large root biomass (bark + wood)
LR = 0.000085234 X
2
– 0.0633035 X 0.80
Medium root biomass (bark + wood)
MR = 0.000010785 X
2
– 0.0051797 X 0.79
Fine root biomass (bark + wood)
FRB = –0.000002982 + 0.00846496 X 0.04
Nutrient content of the total belowground compartments
N = 0.00002391 X
2
– 0.01258838 X 0.89
P = 0.0000011661 X
2
– 0.00004165 X 0.88
K = 0.00000799 X
2
– 0.00029069 X 0.80
Ca = 0.00001259 X
2
– 0.0007908 X 0.67
Mg = 0.00000099 X
2
– 0.00000365 X 0.72
Data expressed in kgofdrymatter at 65
o
C for biomass andingof dry mat-
ter at 65
o
C for nutrients. X = Circumference at 1.3 m in mm.
Table IV.Aerial and belowgroundcompartmented biomassand nutrient contentof the47-year-old Douglas-fir stand(data int per haof
dry biomass at 65
o
C and in kg per ha of dry matter for nutrients).
Biomass N P K Ca Mg Biomass N P K Ca Mg
b%(a+b) b%(a+b) b%(a+b) b%(a+b) b%(a+b) b%(a+b)
Needles 13.6 207 12.9 58.2 66.3 14.1 4.1 32.5 27.7 14.9 21.1 27.3
Branches 25.9 93.7 9.4 58.3 79.6 9.8 7.8 14.7 20.2 15.0 25.4 19.0
total crown 39.5 301 22.3 117 146 23.9 11.9 47.2 48.0 29.9 46.5 46.2
Stembark 29.7 116 14.4 84 61.2 10.7 9.0 18.2 31.0 21.5 19.5 20.7
Stemwood 203.2 125 4.3 152 62.1 11 61.4 19.7 9.2 39.0 19.8 21.3
total stem 232.9 241 18.7 236 123 21.7 70.4 37.9 40.2 60.6 39.3 42.0
total aerial (a) 272.4 542 41 353 269 45.6 82.4 85.1 88.2 90.5 85.9 88.2
stumps 26.1 38.3 2.1 13.8 15 2 7.9 6.0 4.5 3.5 4.8 3.9
large roots 25.5 38.4 2.1 14.8 22.3 2.5 7.7 6.0 4.5 3.8 7.1 4.8
medium roots 4.6 10.4 0.7 5.1 4.6 0.8 1.4 1.6 1.5 1.3 1.5 1.5
fine roots 2.1 7.7 0.6 3.4 2.4 0.8 0.6 1.2 1.3 0.9 0.8 1.5
total roots (b) 58.3 94.8 5.5 37 44.3 6.1 17.6 14.9 11.8 9.5 14.1 11.8
total (a+b) 330.7 636 46.5 390 314 51.7 100 100 100 100 100 100
biomass, which is much less than the 18% of the
belowground total biomass, especially since fine and
very finerootswere underestimated (themethod used did
not allow to harvest very fine roots).
The data found in the literature concerning Douglas-
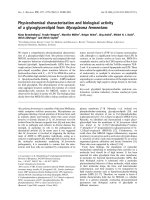
fir stands on 38 sites were compiled. Figure 1 presents
the relationship between aerial and belowground bio-
mass for the stands of these 38 study sites. A significant
tendency towards a linear relationship between these two
compartments (R
2
= 0.94) indicates that the proportion of
belowground biomass is rather constant at 20%, which is
consistent with the conclusion of Vogt et al. (1996) [23].
The location of the study site (presented with a specific
figure on figure 1) is fully consistent with this general re-
lationship.
There was some variability but it seemed rather con-
stant in absolute value for the whole range of stands. In
these conditions, the relative error is acceptable for
stands with a biomass over 250 tperha (about 20% of the
mean value), but is too high for stands with low biomass
(50% of the mean value). This variability originates both
from real divergence from the above relationship, and, to
the fact that very different methods used.
Nevertheless, this seems to indicate a relative inde-
pendence of the belowground/aerial biomass ratio of
Douglas-fir from parameters such as stand age or site
ecology. This could be linked to the relatively limited
ecological range of this species which does not tolerate
calcareous, very dry and hydromorphic soils. On the one
hand, the biomass approach conceals the effect of stand
age and ecological parameters, as an identical biomass
can be achieved over a period depending on soil fertility
which regulates standproduction. On theother hand, bio-
mass and morphology of the root system are not neces-
sarily related.It could beassumedthat soiltypeinterferes
with morphology but not necessarily with the biomass of
the root system.
3.3. Nutrient content of the belowground
compared to the aerial part
The concentrations of the different compartments of
the stand belowground biomass are presented in table V.
Concentration increased for all elements when compart-
ment size decreased, i.e. from large to fine roots [10].
Similarly to aerial compartments, root bark was far more
concentrated than root wood.
Comparing aerial and belowground concentration of
nutrients showed that belowground compartments were
less concentrated than aerial ones. For example concen-
tration in fine roots (as collected in this study) were not
significantly higherthan in largebranches, except forCa.
At the stand level, the nutrient content of the
belowground compartmentrepresents for N, P,K, Ca and
428 J. Ranger and D. Gelhaye
Figure 1. Relationship between aboveground and belowground
biomass for 38 case-studies of Douglas-fir stands published in
the literature (). The present stand is figured by ᮀ.
Table V. Mean concentrations of major nutrients for the
belowground compartmentsof the47-year-old Douglas-fir stand
in the Beaujolais (data in% of dry matter at 65
o
C).
NPKCaMg
Stump wood M 0.119 0.005 0.042 0.025 0.006
SD 0.021 0.001 0.010 0.003 0.001
Stump bark M 0.334 0.027 0.140 0.255 0.021
SD 0.060 0.004 0.017 0.063 0.005
Large roots wood M 0.121 0.005 0.040 0.026 0.071
SD 0.013 0.002 0.010 0.003 0.014
Large roots bark M 0.314 0.029 0.157 0.387 0.027
SD 0.033 0.004 0.024 0.141 0.005
Medium roots total M
0.251 0.016 0.118 0.099 0.019
SD 0.060 0.005 0.022 0.023 0.005
Fine roots total M 0.442 0.032 0.195 0.133 0.043
SD 0.047 0.005 0.033 0.055 0.007
M = mean; SD = square deviation.
Mg respectively: 14.9, 11.8, 9.5, 14.1 and 11.8% of the
stand total biomass(table IV). These valuesare relatively
low, indicating thepresenceof a larger quantity ofpoorly
mineralised woody structures. Nevertheless, it is neces-
sary to consider that very fine roots were excluded from
this sampling and that their concentrations were higher,
closer to those of leaves [12]. These authors, calculating
a total budget for fine roots, concluded that the later
could represent onethird of the netprimaryproduction of
trees.
It is rather difficult to compare these data with the
studies already published. Cole and Rapp (1980) pre-
sented only one measurement for Douglas-fir in their
compilation of IBP sites. It concerned a 450-year-old na-
tive stand from Oregon (USA) [11], which is not directly
comparable with a 47-year-old plantation in Europe. We
measured the nutrient content of an 85-year-old spruce
plantation in the Vosges mountains, eastern France [18].
The belowground biomass of this stand was relatively
similar in absolute value (62 vs. 58 t), but regarding nu-
trient content, Ncontent only was similar (112vs. 95 kg).
K was twice higher, P and Ca 3 times and Mg 4 times
higher. In both cases, tree nutrition was optimal accord-
ing to foliar diagnosis but it was impossible to determine
whether luxury consumption of elements other than N
occurred, depending on nutrient availability in the soil
[18, 19].
Nutrient content absolute value of the belowground
biomass was quite high for N, K and Ca. The depletionof
these nutrients due to harvesting is only a theoretical
problem in the present situation because roots are never
harvested. It is interesting to focus on the contribution of
the decaying root system to the nutrition of the future
stand after harvesting. This is rarely taken into account
with the available pool of nutrients, contrarily to the for-
est floor. Feger et al. (1988)showedhow this disturbs the
present function of the ecosystem when leading to over-
nitrification.
4. CONCLUSION
The relationship between aerial and belowground bio-
mass indicates that extrapolation from aerial biomass
makes it possible to evaluate the sequestration of C and
nutrients in the belowground of a Douglas-fir stand. It is
necessary to check this assumption for other species.
This result is probably due to the specific autecology
of Douglas-fir,which has alimited ecological amplitude.
Increasing the accuracy of this relationship is neces-
sary and possible, but a considerable effort of measure-
ment will be needed to identify the significance of the
different parameters involved in forest production.
Root system biomass represents about 20% of the
stand total biomass, but nutrient sequestration is more
limited when very fine roots and symbionts are not con-
sidered. The latter compartments are of great importance
to current soil functioning but not to input-output bud-
gets, because they are never removed.
Acknowledgements: We would like to thank the
Managers of the Office National des Forêts for giving us
all the equipment to cut the trees needed for this study.
We also thank the technical staff of the Biogeochemical
Cycles research team for helping us to excavate roots,
and Géraldine Rigou, INRA translation unit, for revising
the English version.
REFERENCES
[1] Bakker M.R., Effets des amendements calciques sur les
racines fines de chênes (Quercus petraea et robur) : conséquen-
ces des changements dans la rhizosphère. Thèse de doctorat,
sciences de la terre, Université Henri Poincaré-Nancy I, 1998,
291 p. + annexes.
[2] Cairns M.C., Brown S., Helmer E.H., Baumgardner G.A.,
Root biomass allocation in theworld’s upland forests, Oecologia
111 (1977) 1–11.
[3] Canadel J., Jackson R.B., Ehleringer J.R., Mooney H.A.,
Sala O.E., Schulze E.D., Maximum rooting depht of vegetation
types at the global scale, Oecologia 108 (1997) 583–595.
[4] Cole D.W., Rapp M., Elemental cycling in forest ecosys-
tems, in: Reichle D.E. (Ed.), Dynamic properties of forest eco-
systems, IBP programme, Cambridge University Press, 1980,
p. 341–409.
[5] Drexhage M., Chauviere M., Colin F., Nielsen C.N.N.,
Developpement of structural root architecture and allometry of
Quercus petraea, Can. J. For. Res. 29 (1999) 600–608.
[6] Dupouey J.L., Pignard G., Badeau V., Thimonier A.,
Dhôte J.F., NepveuG., Berges L., Augusto L., Belkacem S., Nys
C., Stocks et flux de carbone dans les forêts françaises, C. R.
Acad. Agric. No. 6 (1999) 293–310.
[7] Fahey T.J., Hugues J.W., Pu M., Arthur M.A., Root de-
composition and nutrient flux following whole-tree harvest of
northern hardwood forest, For. Sci. 34 (1988) 744–768.
[8] Fahey T.J., Hugues J.W., Fine roots dynamics in a nor-
thern hardwood forest ecosystem, Hubbard Brook experimental
forest, NH. J. Ecol. 82 (1994) 533–548.
Belowground biomass of Douglas 429
[9] FegerK.H., Historical changes in catchment use, in:Barth
H. (Ed.),Effects of land use in catchments onthe acidityand eco-
logy of natural surface waters, CEC, Air pollution report 13
(1988) 65–74.
[10] Gordon W.S., Jackson R.B., Nutrient concentrations in
fine roots, Ecology 81 (2000) 275–280.
[11] Grier C.C., Cole D.W., Dyrness C.T., Frederiksen R.I.,
Nutrient cycling in 37 and 450-year-old Douglas-fir ecosystems,
in: Integrated research in the coniferous biome, Coniferous
biome bulletin No. 5, University of Washington, Seattle WA,
1974, pp. 21–34.
[12] Jackson R.B., Mooney H.A., Schulze E.D., A global
budget for fine root biomass, surface area, and nutrient contents,
Proc. Natl. Acad. Sci. USA 94 (1997) 7362–7366.
[13] Jackson R.B., Canadel J.,Ehleringer J.R., Mooney H.A.,
Sala O.E., Schulze E.D, A global analysis of root distributions
for terrestrial biomes, Oecologia 108 (1996) 389–411.
[14] Kapeluck P.R., van Lear D.H., A technique for estima-
ting below-stump biomass of mature loblolly pine plantations,
Can. J. For. Res. 25 (1995) 355–360.
[15] Lemoine B., Ranger J., Gelpe J., Distribution qualitative
et quantitative des éléments nutritifs dans un jeune peuplement
de Pin maritime (Pinus pinaster Ait.), Ann. Sci. For. 45 (1988)
95–116.
[16] Praag (van) H.J., Sougnez-remy S., Weissen F., Carletti
G., Root turnover in a beech and a spruce stand of the Belgian
Ardennes, Plant Soil 105 (1988) 87–103.
[17] Ranger J., Recherches sur les biomasses comparées de
deux plantations de pin laricio de Corse avec ou sans fertilisa-
tion, Ann. Sci. For. 35 (1978) 93–115.
[18] Ranger J., Cuirin G., Bouchon J., Colin-Belgrand M.,
Gelhaye D., Mohamed Ahamed D., Biomasse et minéralomasse
d’une plantation d’épicéa commun (Picea abies Karst.) de forte
production dans les Vosges (France), Ann. Sci. For. 49 (1992)
651–668.
[19] Ranger J., Marques R., Colin-Belgrand M., Flammang
N., Gelhaye D., The dynamics of biomass and nutrient accumu-
lation ina Douglas-fir (Pseudotsuga menziesii Franco)stand stu-
died using a chronosequence approach, For. Ecol. Manage. 72
(1995) 167–183.
[20] Santantonio D., Hermann R.K., OvertonW.S., Root bio-
mass studies in forest ecosystems, Pedobiologia., Bd. 17., S.
(1977) 1–31.
[21] Satoo T., Madgwick H.A.I., Forest Biomass. Forestry
Sciences. Martinus Nijhoff/DR W. Junk publishers, The Hague,
1982.
[22] Stone E.L., Kalish P.J., On the maximum extent of tree
roots, For. Ecol. Manage. 46 (1991) 59–102.
[23] Vogt K.A., Vogt D.J., Palmiotto P.A, Boon P., O’Hara
J., Asbjomsen H., Review of root dynamics in forest ecosystems
grouped by climate, climatic forest type and species, Plant Soil
187 (1996) 159–219.
To access this journal online:
www.edpsciences.org
430 J. Ranger and D. Gelhaye