Báo cáo khoa học: "Forecasting wood resources on the basis of national forest inventory data. Application to Pinus pinaster Ait. in southwestern France" ppsx
Bạn đang xem bản rút gọn của tài liệu. Xem và tải ngay bản đầy đủ của tài liệu tại đây (347.02 KB, 18 trang )
Original article
Forecasting wood resources on the basis
of national forest inventory data.
Application to Pinus pinaster Ait. in
southwestern France
Raúl Salas-González
1,2,*
, Francois Houllier
3
, Bernard Lemoine
4
and Gérome Pignard
5
1
Instituto de Ecología, Universidad Nacional Autónoma de México, Ap. Postal 70–275, 04510, México D.F.
2
Escola Superior Agrária de Coimbra, Departamento Florestal, Instituto Politécnico de Coimbra,
Bencanta 03040, Coimbra, Portugal
3
CIRAD, Unité mixte de recherches CIRAD–INRA Modélisation des plantes (AMAP),
Campus international de Baillarguet. TA 40/E, 34398 Montpellier Cedex 5, France
4
INRA. Unité de recherches forestières, BP 45. Gazinet, Pierroton, 55610 Cestas, France
5
Inventaire Forestier National, Place des Arcades, BP 1, 34970 Maurin-Lattes, France
(Received 29 March 1999; accepted 7 May 2001)
Abstract – The objective of this paper is to propose a method for simulating and predicting the evolution of wood resources in the ‘Lan-
des de Gascogne’ region. Lemoine’s growth and yield model has been successfully utilized to predict future timber resources from exis-
ting data collected in two successive surveys (1977 and 1988) conducted by the National Forest Inventory (NFI). Lemoine’s model was
calibrated by analysing the error in estimation of standfeaturesbetweentheNFIplots and experimental plots originally used to built Le-
moine’s model. The proposed corrected term is based on the best linear unbiased predictor of the error. The calibrated model exhibited a
better accuracy than the original model version. We suggest that coupling the calibrated Lemoine’s model with NFI data is a useful me-
thod for predicting timber resources at a regional level.
wood resource / national forest inventory / growth model / model calibration / maritime pine
Résumé – Prédictiondes ressources futures enbois à partir des données d’inventaire forestier national. Application au massif de
pin maritime (Pinus pinaster) des Landes de Gascogne. L’objectif de cet article est de proposer une méthode de prédiction de l’évolu-
tion de laressource dans les Landes de Gascogne. Le modèle de production de Lemoine aété employé avec succès pour évaluer la dispo-
nibilité en bois de la région, en utilisant les données des deux cycles de l’Inventaire Forestier National (IFN ; 1978 et 1988). Le modèle a
été calibré, en considérant l’erreur d’estimation des caractéristiques dendrométriques des peuplements, entre les placettes de l’IFN et les
parcelles expérimentales employées pour construire le modèle. Le terme de correction est basé sur le meilleur prédicteur linéaire non
biaisé de l’erreur. La validation du modèle calibré a été menée sur des placettes non utilisées dans la procédure de calibration: la préci-
sion dansles prévisions a été sensiblementaméliorée. Nous suggéronsque le couplage des donnéesrecueillies par l’IFNet du modèle ca-
libré constitue un bon outil pour prédire la disponibilité régionale en bois.
ressource forestière / inventaire forestier national / modèle de croissance / calibrage du modèle / pin maritime
Ann. For. Sci. 58 (2001) 785–802
785
© INRA, EDP Sciences, 2001
* Correspondence and reprints
Tel. (351) 239 80 29 40; Fax. (351) 239 80 29 79; e-mail:
1. INTRODUCTION
The data produced by the French National Forest In-
ventory (NFI) are used to estimate stand wood resources,
their increment and their past change at the regional and
national level [15]. However, these data alone do not pro-
vide predictions on the future availability of wood re-
sources. Indeed, forest survey data yield only qualitative
and quantitative information on stands at a particular
date [38, 44].
On the other hand, growth and yield models have no-
tably progressed in recent decades [2, 9, 10, 13]. These
models are used to simulate tree and stand growth from
an initial state (estimated from a stand inventory), and as
a function of site quality and alternative silvicultural
schedules [23]. Since it is important for public and pri-
vate interests to know the volume of timber that could be
harvested annually from an extensive forested area [32,
43], some of these models have been applied to regional
inventory data in order to forecast the future evolution of
wood resources and of the ‘available cut’ [33, 34]. Dif-
ferent approaches have been proposedintheliterature for
modeling the growth of wood resources at a regional
level [17, 33, 45, 46].
The current study concerns ‘Landes de Gascogne’ re-
gion, which harbors a one-million-hectares maritime
pine (Pinus pinaster) forest, i.e. the largest monospecific
forest in southwestern Europe. Between the second
(1978) and third (1988) inventory cycles, NFI reported
an increase of the total standing volume from 110 million
m
3
to 125 million m
3
[14, 16]. This fact is very important
in the definition of forest policies in this region, where
the intensification of silviculture applied to Pinus
pinaster aims at accelerating forest growth and yield
[19].
In this context, the aim of this paper is to propose a
method for projecting forestgrowthat a regional level for
pure even-aged stands: this method is based on the cou-
pling of NFI data and of a stand growth model. The gen-
eral method used in this study may be described as
follows: (1) to obtain data from the national forest inven-
tory service; (2) to build a new, or to adapt an existing
growth model for the forest under study; (3) to design
global silvicultural regimes at a regional level; (4) to
write a simulator on the basis of the calibrated growth
model, with NFI data and silvicultural schedules as in-
puts, and the future wood resources and available cut as
outputs; (5) to run the simulator according to alternative
silvicultural regimes.
This article addresses three specific problems that are
posed by this method: (i) the adaptation and calibration
of the model, which is necessary because NFI data have
particular features which make them different from those
issued from the experimental plots used to build the stand
growth model; (ii) the formulation of global, or average,
silvicultural regimes at a regional level; (iii) the proce-
dures for aggregating NFI data (before or after predicting
forest growth; level of aggregation: plot or age-, stand
density-, or site-based strata.)
2. MATERIALS AND METHODS
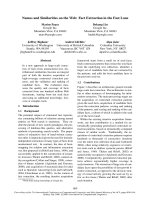
2.1. Landes de Gascogne forest
The ‘Landes de Gascogne’ region covers 3 districts
in France: ‘Landes’, ‘Gironde’ and ‘Lot-et-Garonne’
(figure 1). The region is characterized by an oceanic cli-
mate, with two humidity and temperature gradients: hu-
midity decreases from west to east, i.e. from the Atlantic
coast inland, while temperature decreases from south to
north [20]. In this study, we only considered the pure
even-aged stands of maritime pine situated in the ‘Pla-
teau Landais’ ecological subregion, in the ‘Landes’ and
‘Gironde’ districts. In this subregion, NFI considers
3 site types on the basis of site quality and soil drainage:
humid (H), mesophyl (M), and dry (D) sites [1].
2.2. Lemoine’s stand growth model
Lemoine’s model was designed for maritime pine in
the ‘Landes de Gascogne’ region in order to simulate the
growth and yield of a stand or compartment submitted to
variable silvicultural regimes. The age and intensity of
thinnings are not fixed, but can vary according to these
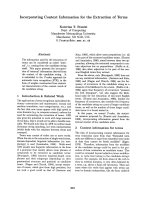
regimes. The inputs of the model are the initial character-
istics of the stand as well as some features of the site
(figure 2). This model was developed using three stand
attributes: the height and basal area of the average domi-
nant tree (respectively h
0
and g
0
), and the basal area of the
average tree in the stand (g = G/N). The model was built
from stem analysis data, from semi-permanent and tem-
porary sample plots which had experienced different
silvicultural treatments, and from thinning and fertiliza-
tion experiments [11, 20, 23, 24]. The model was vali-
dated using temporary plots [25].
786 R. Salas-González et al.
Using stem analysis data and principal component
analysis method, the dominant height growth was mod-
eled as [21]:
h
0
= β
0
(A)+β
1
(A) × Y
1
+ β
2
(A) × Y
2
(1.1)
where A is stand age, β
0
(A) is the guide curve,
represented by Chapman-Richard’s model, while β
1
(A)
and β
2
(A) are two curves that account respectively for
the global level and for the shape of the height growth
curve:
[]
β
β
0
1
( ) . – exp(– . ) ( . )
()
.
(
.
AA
Ar
x
=× ×
=×
29 93 1 0 036 12
298
15
1
13
0 959
14
2
.)
()
.
(.)β
2
Ar
x
=×
if β
0
(A) ≤ 11 then
rA
10
1 01404 195 1=+ +.–./(())β
if β
0
(A) > 14 then
rA
10
1 0 0886 0 00763=+ ×.–. ()β
if 11 < β
2
(A) < 14 then
rA
10
1 0 0419 0 0018=+ ×.–. ()β
rA
2
2
0
2
132 1671 20 164=+–. . –( ( ) –. )β
xA A=× ×ββ
00
0155 0 00283()(. –. ())
Forecasting of wood resources 787
Figure 1. The study area, “Plateau
Landais” in the Gironde and the
Landes districts.
Y
1
and Y
2
are stand parameters that account for stand
vigor (Y
1
is correlated with h
0
(40), the dominant height at
the reference age of 40 years) and for the initial growth.
For example, phosphorus fertilization at the time of stand
establishment improves both h
0
(40) and the initial
growth.
The basal area increment of the average dominant tree
(ig
0
) is predicted from the height increment (ih
0
), the
dominant height at 40 years (h
0
(40)), and dominant girth
(c
0
):
[]
ig
comp C ih kicm kicm ih
0
00 0
2
2
4
=
×× × × + ×()
π
(2)
where tree-to-tree competition is expressed as a function
of stand density (N) and basal area of the average domi-
nant tree (g
0
):
[]
comp g N=+×1 115854 215 10000
0
– exp (– . ) ( )
(2.1)
and kicm is a function of the dominant height h
0
(40):
if h
0
< 3, then kicm =8
if 3 ≤h
0
< 6, then kicm = 10.49 – 0.83 × h
0
if h
0
≥ 6, then kicm = 4.97 + 0.0892 × h
0
(2.2)
The basal area increment of the average tree in the
stand (ig) is predicted from the basal area of the average
tree, the dominant basal area and its increment:
ig = b
0
+ b
1
× g + b
2
× g
2
– 1.08
(3)
where:
bigbgbg
b
ig ig ig g
g
b
001 2
2
1
0050 0750
2
0
2
05
=××
=
××
×
––
––
.
,,
2
0050 075
2
2
0125
=
+×
×
ig ig ig
g
,,
–( )
.
(3.1)
where ig
0,50
is
ig comp ig
com
050 0
235 168 0894
0 0339 0 047
,
(– . – . ) .
(– . .
=++
+ p comp ig–. )0 018
2
0
2
and ig
0,75
is
ig comp ig
com
075 0
33 156 0 973
0 0268 0 0464
,
(– . – . ) .
(– . .
=++
+ p comp ig–. )0022
2
0
2
Average tree volume (v) and average tree height (h
g
)
are estimated using statistical relationships. In Lemoine’s
model, the nature of the thinning (i.e. the relative size of
the harvested trees as compared to the average tree) de-
pends on thinning intensity, but customarily the smaller
trees are selected rather than the larger (because it has
been observed that slow-growing trees never recover a
place in the canopy). The thinning with selection of taller
trees is only practiced after the smaller trees have been
removed, and when the silviculturist wants to establish
an adequate distance among trees [20]. Figure 2 shows a
flow chart with the data needed to feed the model and
with the outputs of the model.
788 R. Salas-González et al.
Growth simulation for the maritime pine
Ait, Lemoine's model
Pinus pinaster
STATION
Type of soil
Rainfall
STAND
ho, ho(t-x), Age,
Age(t-x), co, cg, N.
Data to initialize the model
Growth
Model
Dynamic
model
Silvicultural
regime
ho, cg, co, G, N
Output
Volume tarif
tables
Vol, Prod, C_incr
Average Incr
Figure 2. Schematic view of a simulation performed with
Lemoine’s model. Stand features and site quality are needed to
initialize the model; the data were taken from NFI database. The
model allows simulating the effect of different silvicultural sce-
narios on stand growth. The outputs are the new stand features
and increments. The characteristics of cut trees are also esti-
mated.
2.3. Data used in the study
2.3.1. National Forest Inventory data
In order to forecast the future timber resources in the
region, NFI data were used to initialize Lemoine’s stand
growth model. The study area has been inventoried 4
times by NFI. Since the method in the first survey was
not similar to that in the last three surveys (1977–1978,
1987–1988, 1998–1999), we discarded the data from the
first survey. Furthermore, the data from the fourth survey
were not available when we started the study, so that we
only used the data from the second and third surveys. The
estimated forest area and the number of NFI sample plots
in the subregion under study are shown in table I and
figure 3.
The general method and procedures utilized by NFI to
evaluate forest resources are as follows: (i) stratification
of stands using aerial photographs; (ii) random selection
of field control points of 25 m radius, with a number of
plots proportional to the surface of each stratum. On
these control points, some stand characteristics are
noted: species composition, stand density (N), crown clo-
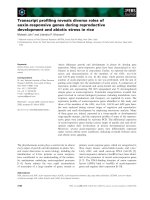
sure; (iii) random selection of field survey units: these
units are composed of three concentric circles with a ra-
dius of 6, 9, and 15 m (figure 4). Trees are included in
each circle, trees are sampled according to their circum-
ference. These sample trees are then measured in detail
[7, 15]. Local stand estimates are then derived from these
measurements.
Among the variables estimated by NFI, those needed
to initialize and calibrate the growth model were se-
lected: the age (A), the dominant height (h
0
) and its an-
nual increment over the 5 years preceding the survey
(ih
0
), the dominant girth at breast height (c
0
) and its an-
nual increment over the 5 years preceding the survey
(ic
0
), the stand density (N). Other variables were also
used to calibrate the model: the basal area of the average
tree (g) and its annual increment over the 5 years preced-
ing the survey (ig), the number of trees cut during the
5 years preceding the survey (N
ecl
), the number of dead
trees during the 5 years preceding the survey (N
mort
), the
basal area exploited during the 5 years preceding the sur-
vey (G
ecl
), the basal area of the trees that died during the
5 years preceding the survey (G
mort
), and the total stand
volume (V).
2.3.2. Temporary and permanent NFI plots
The usual procedure of NFI is only based on tempo-
rary plots. We used these plots to calibrate and validate
the two equations of the growth model that predict ig
0
and ig. In addition, in 1987–1988, NFI also remeasured
Forecasting of wood resources 789
Table I. Forest area (pine stands only) and number of NFI sam-
ple plots in the region under study.
Cycle Forest area
(ha)
Number
of plots
1977–1978 580 550 1 947
1987–1988 570 637 2 612
Number of plots
Age classes
1977-78
800
600
400
200
0
10 20 30 40 50 60 70 80 90 100 110 120
1977-88
Figure 3. Distribution of the sample
plots in the studied area by age class
and by inventory survey, in pure
stands of maritime pine in the “Pla-
teau Landais” region.
446 plots that had already been measured in 1977–1978.
These plots are termed here as ‘permanent’; they cover
the main three soil types in the region. These permanent
plots were used to calibrate and validate the height
growth model.
2.3.3. Experimental plots
A set of 259 experimental plots was used to build
Lemoine’s original growth model [22, 23]. Of these, 27
were used by Salas et al. [39] in order to compare the
stand estimates derived either from large plots or from
small concentric NFI plots (figure 4). The aim was to as-
sess the precision and accuracy of the point estimates de-
rived from NFI plots and to know whether there was a
risk in considering such local estimates as the initial state
of stands when using Lemoine’s growth model.
Furthermore, NFI measures only the trees which have
a girth at breast height larger than 24.5 cm. Because our
objective was to predict all the timber produced in the re-
gion and in subsequent years, it was necessary to esti-
mate the total density and basal area of the stands. For
this reason in an earlier study, 37 new large temporary
plots were employed to estimate accurately these stand
characteristics [40].
2.4. Calibration of Lemoine’s growth model
Some problems had to be solved before beginning the
process of prediction and simulation. Lemoine’s model
was built on the basis of experimental plots observed
from the 1960s to the 1980s and which were not chosen
in order to be strictly representative of the ‘Landes de
Gascogne’ forest. Moreover, the area of these plots
ranged from 1,000 to 5,000 m
2
. In contrast, NFI plots are
supposed to be globally representative of the forest but
their ranges from ca. 100 to ca. 700 m
2
. Salas et al. [40]
have shown: (i) that the design and plot size used by NFI
resulted in a high coefficient of variation (CV) of the esti-
mates of stand features such as density (N) and basal area
(G); (ii) that average and dominant circumference (c
g
and
c
0
) had a lower coefficient of variation, but that c
0
was bi-
ased with an average underestimation of ca. –2 cm. Since
these stand characteristics, together with h
0
and A, are
needed to initialize the growth model, the projections ob-
tained by simulation using NFI data as inputs could be
significantly less accurate and precise than the predic-
tions obtained from larger sample plots, such as those
used to build the model.
Therefore, in order to avoid biased predictions, the
model had to be calibrated on the basis of NFI data. The
calibration could be carried out by two means: (i) either
by fitting the original model using NFI data in order to re-
790 R. Salas-González et al.
Experimental
plot
NFI plot
Figure 4. Example of one large ex-
perimental plot used to build
Lemoine’s model (squared shape).
They had a surface ranging from
1000 to 5000 m
2
. In contrast, na-
tional Forest Inventory plots have a
surface ranging from 100 to
700 m
2
. In these three circles, the
trees are measured by the NFI de-
pending on their girth; small trees:
24.5–52.5 cm, medium trees:
54.5–94.4 cm,big trees:> 94.4 cm.
estimate its parameters; (ii) or by correcting the output
supplied by the model. The second option was chosen,
because of the complexity of the model. Let us consider
two variables, X and Y, where X is the variable of interest
while Y can be obtained by a model (i.e. as a prediction)
or by direct observation: the aim of calibration is to
predict the values of X, from the values of Y. In sciences
such as physics, methods and techniques of calibration
have been developed and widely applied [4, 18, 37].
Chaunzhong provides an application in forestry sciences
[6]: in this case, the volume of the stand was estimated by
two different methods, that had a different accuracy and a
different cost; the aim was thus to calibrate the cheap and
low-accuracy estimates, Y, using the expensive and high-
accuracy estimates, X, using a sample where both vari-
ables had been measured.
In our study, the situation was similar, with a relation-
ship between the stand values predicted by the growth
model (predictor
$
x
i
) and the stand values observed by
NFI (x
i
), where i =1, ,n denotes sample plots. Our aim
was thus to predict x
i
from
$
x
i
, i.e. to calibrate the incre-
ment predicted by the model on the basis of NFI incre-
ment observations. This calibration procedure was used
for h
0
, ig
0
and ig. The way to correct the bias of predic-
tions was thus:
xxe
iii
=+ ×+δδ
01
$
(4)
where
0
and
1
are the parameters to be estimated, and e
i
is an independent random variable. The magnitude of the
bias,
Ex x
ii
[–
$
]
is determined by the parameters of the
model, particularly by the parameter
0
.
The general approach to calibrate the model was:
(i) validation of the original Lemoine’s model, with the
aim to search for bias and to analyze prediction errors;
(ii) correction of systematic deviations in predictions;
(iii) validation of the calibrated model.
The validation of the non-calibrated and calibrated
models was performed by studying the bias, i.e. the aver-
age deviation between the values predicted by the model
and the values observed by NFI. The bias of variable Y
was estimated as:
B
n
YY
Yii
i
n
=
=
∑
1
1
(
$
–
~
)
(5)
where
~
Y
i
is the value observed by NFI and
$
Y
i
is the value
predicted by Lemoine’s model.
2.4.1. Calibration of the dominant height growth
model
Projection of individual plots
Validation of the non-calibrated model
Before calibrating the height growth model, it was
necessary to assess whether this model was biased. The
validation of the original model was carried out using
130 NFI permanent sample plots. The parameters Y
1
and
Y
2
of equation (1.1) were estimated from the measure-
ments of h
0
, ih
0
and age from the 1977–78 survey. There-
fore, we had: t
2
= 1978 and t
2
–5 = 1973. Predictions
were then made for t
2
+5 (1983) and t
2
+10 (1988).
Using a paired t-test, these predictions were compared
with data obtained bythe1988 survey on the same plots.
Calibration of the model
From a set of permanent sample plots, in which were
included stands of all ages, one hundred plots were
randomly chosen to calibrate the height growth model.
The parameters Y
1
and Y
2
of equation (1) were estimated
using the records of h
0
, ih
0
and age from the 1977–1978
survey. Ten-year predictions were then calibrated using
the data obtained by the 1988 survey and a simple linear
regression (see Eq. (4) in the above described proce-
dure).
Validation of the calibrated model
This step was carried out with 30 independent perma-
nent plots. The precision and accuracy of the calibrated
model were assessed using a paired t-test in which the
discrepancies between observed and predicted values
were examined.
Projection of aggregated plots
In order to simulate the growthattheregional level, an
option was to reduce variability in the estimation of stand
characteristics by aggregating the plots before applying
the growth model. It was necessary to know which was
the best strategy for plot aggregation. For that purpose,
76 permanent plots from the 2nd survey were selected to
form 19 aggregates. The aggregates were formed on the
basis of age class and of similar fertility index, estimated
from the h
0
versus A relationship in 1978.
The prediction of height growth with these aggregates
was performed according to two methods: (i) plot-by-
plot simulation of height growth, followed by the aggre-
gation of the predicted values; (ii) computation of aver-
age plot characteristics for each aggregate, followed by
the prediction of height growth at the aggregate level. On
Forecasting of wood resources 791
the basis of data from 1977–1978, parameters Y
1
and Y
2
of equation (1.1) were estimated from the measurements
of h
0
, ih
0
, and A. Height growth predictions were per-
formed over 5- and 10-year time steps (up to 1983 and
1988 respectively). The discrepancies between observed
and predicted values were analyzed with a t-test.
2.4.2. Calibration of the dominant and average
basal area growth models
Validation of the non-calibrated models
These models were validated on the basis of tempo-
rary plots and by site type. Two data sets were utilized for
this purpose: (i) the data from the 1977–1978 survey
(1332 plots); (ii) the data from the 1988 survey (1955
plots). All the plots considered for the calibration and
validation of the model were grouped by site type and
none of them had any record of thinning or dead trees, at
least in the previous 5 years.
The variables involved in the models were corrected
for bias and stand density. Salas et al. [40] indeed showed
that it is necessary to correct N, G and c
0
estimated from
NFI plots because of their small size and of the minimum
tree census threshold (gbh 24.5 cm). Total N and G
were thus estimated using the following equation:
X
X
c
r
x
,x
=
( – exp[– ( – . ) ])
,
1245
10
2
β
β
(6)
where: X is the total value of N or G (including the trees
that fell below the NFI census threshold); X
r
is the same
variable computed from only the measurable trees (over
NFI census threshold);
1,x
and
2,x
are parameters which
depend on the variable under study (N or G); c
0
was cor-
rected by systematically adding 2 cm.
The discrepancies between observed and predicted
values were analyzed with a paired t-test.
Calibration of the models
The calibration was performed using 80% of the avail-
able temporary plots for each survey, these plots being
randomly selected randomly within each type of land.
The calibration method was a simple linear regression.
Because of the non-linearity of the models and of their
complexity, it seemed that this method avoided amplifi-
cation of prediction bias.
Validation of the calibrated models
The validation of calibrated models was performed
using the 20% the temporary plots that had not been used
in the calibration process, i.e. 20% of the plots. In order
to evaluate the calibrated models, the discrepancies be-
tween the values predicted by the model and the values
observed by NFI were examined with a paired t-test.
2.5. Forecasting the available regional wood
resources
2.5.1. Criteria for plot aggregation
The aggregation of plots had the advantage of dimin-
ishing the variability of the variables needed to initialize
the model. The criteria considered for this aggregation
were:
Site type: NFI and Lemoine’s model agree in the dif-
ferences in yield among the 3 types of land. Since the dif-
ferences in site index are important to correctly forecast
the growth, this classification was kept to obtain a post-
stratification of the maritime pine forest.
Canopy cover: this stand feature of the stands gives
informs about the degree of crown closure. Cover is esti-
mated by NFI over a surface of ca. 0.2 ha. Table II shows
that cover classes defined by NFI depend on stand den-
sity and age.
Dominant height: this stand characteristic is not influ-
enced by factors other than site quality [35]. Since
Maugé [27] had suggested that, in stands taller than 3 m,
growth did not depend on age, but only on site quality
and h
0
, we merged the plots into 1-meter height classes.
2.5.2. Silvicultural scenarios
A wide range of silvicultural regimes is practiced in
the ‘Landes de Gascogne’, according to needs and goals
792 R. Salas-González et al.
Table II. NFI cover classification: total cover and cover of trees
above census threshold.
Cover Type Total cover
(%)
Cover of censable trees*
(%)
1 10–24 < 10
2 25–50 < 10
3>50 <10
5 10–19 > 10
6 20–24 > 10
7 25–49 > 10
8 50–75 > 10
9>75 >10
* Trees with gbh > 24.5 cm
of the owners. Under these scenarios the number of
thinnings and the final cuts are determined as a function
c
g
or c
0
[5, 25, 29]. Since Maugé [28] had indicated that
thinnings and final harvests in the region tended to be de-
layed, no marked caution scenarios were contemplated in
this study.
Preliminary simulations achieved with a very ‘dy-
namic’ silvicultural regime (i.e. a regime with intensive
thinnings and an early final harvest) showed that such a
regime was not consistent with the current structure of
the maritime pine stands and with the observed global
level of harvests [30, 31]. Therefore, the total volume of
timber cut in final harvests and intermediate thinnings
was guided by the partial statistics of the regional wood
production, and two scenarios were retained (figure 5):
the traditional silviculture, noted ‘SI’; and a scenario
taken from the experimental and semi-permanent plots,
where the thinnings had been moreintensethanin the tra-
ditional silviculture, noted ‘SII’ [30, 31].
Thinning regimes
The following equations describe the limits between
which stand density should be maintained, given the av-
erage circumference of the stand (c
g
). For SI, stand den-
sity varies between N = 3524.866 × 10
(–0.0091·c
g
)
(maximal) and N = 2310.534 × 10
(–0.0091·c
g
)
(minimal).
For SII, stand density varies between N = 2584.208 ×
10
(–0.0078·c
g
)
(maximal) and N = 1884.377 × 10
(–0.0078·c
g
)
(minimal). Thinning should thus be carried out as a func-
tion of c
g
.
Final harvest
The choice of stands to be clearcut (i.e. for final har-
vest) was based on both A and c
g
. Among the stands
whose average circumference was greater than 120 cm,
we first selected the oldest, with A > 60 years, then the
mature stands, with A between 50 and 60 years, and fi-
nally the other stands that had an average girth of 130 cm
at the end of the growth period.
The above defined criteria are deterministic. Under
such criteria, a high quantity of wood could be removed
by thinnings or final cuts in the first years of a simulation.
However, it was not realistic to assume that the wood in-
dustry installed in the region could absorb all this avail-
able timber estimated in the short term. Therefore, for the
thinnings one alternative was to select the stands which
had a higher competition index [22], assuming that these
stands had not undergone thinnings recently. For the fi-
nal cut of mature stands, a competition index was also
calculated: when its value was lower than 0.90, for SI, or
0.88, for SII, the final cut was achieved.
A simulator program was written in Pascal language
to forecast the growth and wood production. The valida-
tion of the entire method (calibrated Lemoine’s model
for h
0
, ig
0
and ig, plus silvicultural regimes), was per-
formed for the period from 1977–1978 to 1987–1988.
Then the annual availability of yield was simulated for
the period from 1987–1988 to 1998, on the basis of the
third survey (1987–1988).
Forecasting of wood resources 793
Figure 5. Silvicultural scenarios
proposed in this study to estimate
the annual available wood cut in
Landes de Gascogne region. Sce-
nario SI represents the current
silviculture practiced in the re-
gion. Scenario SII represents an
alternative silviculture regime,
with thinnings more intense than
in the SI.
3. RESULTS
3.1. Prediction of dominant height increment (ih
0
)
3.1.1. Projection of individual plots
Validation of the non-calibrated model
5-year predictions were not biased. The average of
discrepancies between predicted and observed values in
that period was only 0.01 m. In contrast, 10-year predic-
tions were significantly biased: the underestimation was
0.31 m. The error of estimation was 0.03 m yr
–1
(ta-
ble III).
Calibrated model
The calibration of the model was performed to fore-
cast the growth over a 10-year period, searching to elimi-
nate the bias and to reduce the variance. The results of the
fitted model are shown in table IV (Eq. (4)). In this equa-
tion, the observed h
0
was estimated using the predictions
derived from the non-calibrated Lemoine’s model. In av-
erage, the predictions made by the calibrated model were
more reliable than those based on the non-calibrated
model (table V). The bias disappeared and the precision
remained similar. The difference between predicted and
observed height were not significant and errors did not
exhibit any trend (figure 6).
3.1.2. Projection of aggregated plots
Results of the two methods of aggregation are shown
in table VI. The variable
$
E
5
(respectively
$
E
10
) indicates
the average discrepancy between the values observed by
NFI and the values predicted by the calibrated model
over 5 years (respectively 10 years), when predictions
are performed plot by plot. The variable
E
5
(respectively
E
10
) indicates the average discrepancy between the val-
ues observed by NFI and the values predicted by the cali-
brated model over 5 years (respectively 10 years), when
predictions are performed after data aggregation.
The t-test was significant, when 10-year predictions
were performed plot by plot, while it was not significant
for 5-year predictions. The t-test was never significant,
when predictions were performed after data aggregation;
however the bias also existed in that case, but it was not
significant because degrees of freedom were less than for
794 R. Salas-González et al.
Table III. Accuracy and precision of estimates derived from the non calibrated growth model: bias (B
y
) and variance of predictions for
dominant height increment (ih
0
), dominant girth increment (ig
0
) and average girth increment (ig).
Year Model
(y variable)
Site type nB
y
Variance
1983 ih
0
(m yr
–1
)c H, M, D 130 –0.010 1.45
1988 ih
0
(m yr
–1
)c H, M, D 130 –0.308* 1.66
1978 ig
0
(cm yr
–1
) H 616 1.209* 112.58
1978 ig
0
(cm yr
–1
) M 518 3.049** 156.01
1978 ig
0
(cm yr
–1
) D 198 1.573 128.40
1988 ig
0
(cm yr
–1
) H 838 5.165** 190.14
1988 ig
0
(cm yr
–1
) M 849 6.969** 249.40
1988 ig
0
(cm yr
–1
) D 268 8.525** 167.19
1978 ig (cm yr
–1
)
0
H 409 1.299** 20.27
1978 ig (cm yr
–1
)
0
M 359 0.409 26.73
1978 ig (cm yr
–1
)
0
D 128 0.721 25.48
1988 ig (cm yr
–1
)
0
H 542 0.869** 19.42
1988 ig (cm yr
–1
)
0
M 552 0.015 21.14
1988 ig (cm yr
–1
)
0
D 173 0.835** 10.26
* Bias is significant at p = 0.05., ** Bias is significant at p = 0.01
H: humid land, M: mesophyl land, D: dry land.
ˆ
ˆ
Forecasting of wood resources 795
Table IV. Calibration of the growth model for: dominant height increment (ih
0
), dominant girth increment (ig
0
), and average girth incre-
ment (ig). The calibration equation is x
i
= δ
0
+ δ
1
× x§
i
+ e
i
, where x
i
is an observation, x§
i
is a prediction, δ
0
and δ
1
are the parameters to be
estimated, and e
i
is a random error.
Cycle Model Site type df
MSE
0
± σ(
0
)
1
± σ(
1
)R
2
3 ih
0
(m yr
–1
)c H, M, D 98 2.87 1.43 ± 0.77 0.94 ± 0.04 0.87
2 ig
0
(cm yr
–1
) H 408 88.4 3.19 ± 1.19 0.70 ± 0.03 0.47
2 ig
0
(cm yr
–1
) M 357 106.4 6.93 ± 1.52 0.54 ± 0.04 0.32
2 ig
0
(cm yr
–1
) D 127 87.7 3.42 ± 1.82 0.65 ± 0.06 0.45
3 ig
0
(cm yr
–1
) H 540 169.4 15.43 ± 1.93 0.55 ± 0.04 0.26
3 ig
0
(cm yr
–1
) M 553 189.2 19.62 ± 2.07 0.49 ± 0.03 0.22
3 ig
0
(cm yr
–1
) D 171 91.9 10.43 ± 2.15 0.54 ± 0.04 0.42
2 ig (cm yr
–1
)
0
H 407 18.40 1.28 ± 0.43 0.89 ± 0.02 0.87
2 ig (cm yr
–1
)
0
M 357 24.23 2.78 ± 0.58 0.86 ± 0.02 0.81
2 ig (cm yr
–1
)
0
D 126 21.02 2.73 ± 0.77 0.79 ± 0.04 0.75
3 ig (cm yr
–1
)
0
H 540 18.37 1.22 ± 0.41 0.92 ± 0.01 0.89
3 ig (cm yr
–1
)
0
M 550 20.22 2.11 ± 0.45 0.93 ± 0.01 0.88
3 ig (cm yr
–1
)
0
D 171 10.07 0.14 ± 0.53 0.96 ± 0.02 0.92
H: humid land, M: mesophyl land, D: dry land.
Table V. Accuracy and precision of estimates derived from the calibrated growth model: bias (B
y
) and variance of predictions for domi-
nant height increment (ih
0
), dominant girth increment (ig
0
) and average girth increment (ig).
Year Model Land type nB
y
Variance
1988 ih
0
(m yr
–1
)c H, M, D 30 –0.088 0.65
1978 ig
0
(cm yr
–1
) H 103 –2.1303 86.91
1978 ig
0
(cm yr
–1
) M 85 –0.0696 88.12
1978 ig
0
(cm yr
–1
)D 36 –1.8770 56.49
1988 ig
0
(cm yr
–1
) H 139 –0.8660 113.31
1988 ig
0
(cm yr
–1
) M 135 –1.0477 119.51
1988 ig
0
(cm yr
–1
) D 40 –0.4447 160.75
1978 ig (cm yr
–1
)
0
H 103 –0.3643 21.99
1978 ig (cm yr
–1
)
0
M85–0.8255 23.57
1978 ig (cm yr
–1
)
0
D36–0.1996 14.57
1988 ig (cm yr
–1
)
0
H 139 –0.4592 63.83
1988 ig (cm yr
–1
)
0
M 134 –0.7959 22.02
1988 ig (cm yr
–1
)
0
D40––1.5243* 16.03
*Bias is significant at p = 0.05
H: humid land, M: mesophyl land, D: dry land.
Table VI. Accuracy of the aggregation methods for predicting height growth with the calibrated model.
$
E
5
(respectively
$
E
10
): average
discrepancy between NFI values and 5-years (resp. 10-years) predictions, when prediction precedes plot aggregation.
E
5
(resp.
E
10
): av-
erage discrepancy between NFI values and 5-years (resp. 10-years) predictions, when prediction follows plot aggregation.
Method Bias (m) Variance (m
2
)
E
5
0 –0.102 0.586
E
§
50
–0.011 0.549
E
10
–0.247 0.770
E
§
10
–0.347 0.560
ˆˆ
ˆ
ˆ
the plot-by-plot projection. Both projection-aggregation
methods gave similar predictions over 5 and 10 years;
nevertheless, it seems that the 2nd method (i.e. aggrega-
tion followed by projection) slightly reduces the bias and
variance of the predictions. This method was utilized for
forecasting the evolution of forest resources.
3.2. Prediction of dominant basal area increment
(ig
0
)
3.2.1. Validation of the non-calibrated model
The increment of the basalareaofthe average tree was
always significantly overestimated. The average bias
was + 1.94 cm
2
yr
–1
(respectively + 6.89 cm
2
yr
–1
) for the
2nd (resp. 3rd) survey (table III); the predictions of the
model were thus more biased for the 3rd survey than for
the 2nd survey. The errors of estimation were correlated
with stand variables, including age: for example, the
overestimation was evident in mature stands (figure 6).
3.2.2. Calibrated model
The results of the calibration equation (Eq. 4) are
given in table IV. In this equation, the observed value of
ig
0
was estimated using the predictions derived from the
original Lemoine’s model. The calibrated model was
then validated (table V): the estimations of ig
0
were not
significantly biased anymore; the average overestima-
tion was reduced to 1.36 cm
2
yr
–1
(respectively 0.77 cm
2
yr
–1
) for the 2nd (resp. 3rd) survey. In some cases, the
variance of estimation of the calibrated model was less
than half of the variance of estimation of the non-cali-
brated model.
3.3. Prediction of average basal area increment (ig)
3.3.1. Validation of non-calibrated model
The increment of the basalareaofthe average tree was
also overestimated. This bias was significant for humid
sites at the 2nd survey, and for humid and dry sites for the
3rd survey. The average overestimation was 0.81 cm
2
yr
–1
(respectively 0.57 cm
2
yr
–1
) for the 2nd (resp. 3rd) survey
(table III).
3.3.2. Calibrated model
This model was calibrated using equation 4 (results
are given in table IV). In this equation, the observed
value of ig was estimated using the predictions derived
from the original Lemoine’s model. The calibrated
model was then validated (table V): the predictions of ig
were not biased any more, but for the dry sites at the
3rd survey (the overestimation was 1.52 cm
2
yr
–1
). The
variance of estimation was not really improved by the
calibration procedure: it globally decreased for the
2nd survey, while it increased for the 3rd survey.
3.4. Forecasting available wood resources in the
‘Landes de Gascogne’
3.4.1. Retrospective evolution of the forest between
1978 and 1988
We used this period for jointly testing the adequacy of
the method of calibration and the validity of the
silvicultural regimes. For that purpose we compared the
results of simulations with data recorded by the NFI.
796 R. Salas-González et al.
-10
-5
0
5
10
0 25 50 75 100 125
age (years)age (years)
Eho (m)
0 25 50 75 100 125
-10
-5
0
5
10
Eho (m)
age (years)
0 25 50 75 100
-10
-5
0
5
10
Eigo (cm /yr)
2
Eigo (cm /yr)
2
age (years)
0 25 50 75 100
-5
0
5
10
Figure 6. Residuals of the model before and after calibration.
Top: dominant height, the dispersion of points was lower after
the calibration of the model (right plot); the prediction was car-
ried out over a ten-year period. Bottom: basal area increment of
the average tree in the stand (ig
0
). Left plot, a trend was observed
on the uncalibrated model. The uncalibrated model underesti-
mates igo in young stands whereas it overestimates this incre-
ment in mature and old stands. After the calibration the model
did not show a tendency in residuals (right).
Mean annual increment and mean volume
Between 1978 and 1988, the global behavior of the
two scenarios SI and SII was fairly similar. Nevertheless,
SI simulated a lower harvest and a higher mean annual
volume increment (figures 8 and 9). At the end of the
cycle, the mean annual increment was estimated at
9.4 Mm
3
yr
–1
(respectively 9.1 Mm
3
yr
–1
) for SI (resp. SII),
as compared to 7.5 Mm
3
yr
–1
reported by the NFI in
1984–1988.
Forecasting of wood resources 797
surface (ha)
volume (10e3 m3)
0
50000
100000
150000
200000
250000
10 20 30 40 50 60 70 80 90
age classes
0
10000
20000
30000
40000
50000
10 20 30 40 50 60 70 80 90
age classes
0
50000
100000
150000
200000
250000
10 20 30 40 50 60 70 80 90
age classes
0
10000
20000
30000
40000
50000
10 20 30 40 50 60 70 80 90
age classes
0
50000
100000
150000
200000
250000
10 20 30 40 50 60 70 80 90
age classes
0
10000
20000
30000
40000
50000
10 20 30 40 50 60 70 80 90
age classes
0
50000
100000
150000
200000
250000
10 20 30 40 50 60 70 80 90
age classes
0
10000
20000
30000
40000
50000
10 20 30 40 50 60 70 80 90
age classes
surface (ha)surface (ha)surface (ha)
volume (10e3 m3)volume (10e3 m3)volume (10e3 m3)
Figure 7. Changes in the age struc-
ture of the forest resources from
1978 to 1988. Top: NFI data in
1978. Middle: SI and SII scenario
predictions in 1988. Bottom: NFI
data in 1988.
Because of the intensity of the final cuts (both ob-
served and simulated), the total volume of stands older
than 40 years was reduced. In contrast, there wasanaccu-
mulation of wood in the age classes younger than 40
years. It seems that the thinnings were not regular and not
intense in these age classes (figures 7 and 8).
For this period, the predictions made by Maugé [28]
overestimated by 16% the total volume (116–124 Mm
3
),
and he predicted a mean annual increment between 9.2
and 9.4 Mm
3
yr
–1
in the region. In general, his predictions
of volume increment were higher than ours and than the
observed increments. Partial statistics of the regional
timber production [30, 31] estimated an annual average
of thinnings of 1.7 Mm
3
yr
–1
and an annual average of fi-
nal cuts of 2.1 Mm
3
yr
–1
. Our predictions were 1.4 Mm
3
yr
–1
for the thinnings and 3.0 Mm
3
yr
–1
for the final cuts.
According to NFI, the total volume of the stands in the
region was 102 Mm
3
in 1988, while SI and SII scenarios
respectively predicted 104 Mm
3
and 102 Mm
3
(figure 9).
The total predicted volume was not far from the actual
values observed by the NFI, and it must be considered
that almost all the wood present in the ‘Plateau Landais’
was included, even the trees with a girth lower than NFI
census threshold.
Final harvest
During the first six years, the average annual simu-
lated harvests was 2.5 million m
2
yr
–1
(Mm
3
yr
–1
), while
for the rest of this period it raised up to 3.9 Mm
3
yr
–1
.
There was a slight difference between the two proposed
scenarios, with the main differences observed at the be-
ginning and at the end of the period. Partial statistics col-
lected by the Ministry of Agriculture indicated that the
annual average harvest exploited during the first six
years was actually 2.6 Mm
3
yr
–1
and that it then increased
up to 3.1 Mm
3
yr
–1
[30]. The harvests recorded by the
Ministry of Agriculture were very regular with a
smoothly tendency to increasing trend at the end of the
period. In contrast, as shown in figure 8, our predictions
of the final harvests were very irregular: as already men-
tioned, this is due to the deterministic nature of the crite-
798 R. Salas-González et al.
Thinnings
Final harvest
0
2000
4000
6000
0510
time (years)
0
2000
4000
6000
0510
time (years)
0
2000
4000
6000
0510
time (years)
0
2000
4000
6000
0510
time (years)
Volume (10e3 m3)
Volume (10e3 m3)
Volume (10e3 m3)
Volume (10e3 m3)
Figure 9. Top: Evolution of the simulated total volume in the
studied area during the period 1978–1988 (left) and 1988–1998
(right). Bottom: Evolution of the volume increment in the stud-
ied area during the period 1978–1988 (left) and 1988–1998
(right). Despite the increment in wood taken in cuts, the wood
seems to accumulate in the region. SI = scenario I,
SII = scenario II.
Total Volume
Increment of Volume
80000
90000
100000
110000
120000
130000
0510
time (years)
80000
90000
100000
110000
120000
130000
0510
time (years)
5000
6000
7000
8000
9000
10000
11000
0510
time (years)
5000
6000
7000
8000
9000
10000
11000
0510
time (years)
Volume (10e3 m3)
Volume (10e3 m3)
Volume (10e3 m3)
Volume (10e3 m3)
Figure 8. Top: Evolution of simulated thinnings during the pe-
riod 1978–1988 (left) and 1988–1998 (right). Bottom: Evolution
of simulated final harvest during the period 1978-88 (left) and
1988–1998 (right). SI = scenario I, SII = sce-
nario II.
ria. Furthermore, a tendency to intensify the volume
harvested in final cuts was also observed.
The simulated clearcut area followed a similar
pattern. It increased with time, from 5,000 ha yr
–1
to
13,000 ha yr
–1
at the end of the period. As a result, the
proposed scenarios almost eliminated all the older
stands. On the contrary, in 1988, NFI still recorded more
than 2% of the timber in old stands.
Thinnings
The deterministic criteria chosen for the silvicultural
scenarios yielded irregular cuts in the first five years.
Consequently, the average simulated thinned volume in
the first six years was very low, with 0.35 Mm
3
yr
–1
for SI, and 0.61 Mm
3
yr
–1
for SII. At the end of the cycle,
the simulated thinned volume of cuts raised up to
3.0 Mm
3
yr
–1
for SI, and 3.2 Mm
3
yr
–1
for SII. Partial
statistics of the Ministry of Agriculture [30] indicated
that the average volume of thinnings increased from
1.6 Mm
3
yr
–1
to 1.8 Mm
3
yr
–1
over this period. In overall
there was a good agreement between observed thinnings
and thinnings simulated with SII, but the simulated trend
was much too sharp.
We analyzed the actual distribution of forest by age
classes in the ‘Plateau Landais’ in 1978 and 1988
(figure 7). We also featured the predictions obtained
from SI and SII scenarios in 1988. The simulated
thinnings were more intense than the observed ones in
the older stands: surfaces and volumes were reduced
markedly in the age classes older than 50 years. In con-
trast, in the 30- and 40-year age classes, simulated vol-
ume and surface were slightly higher than those reported
by NFI.
3.4.2. Forecast of forest evolution between 1988 and
1998
Mean annual increment
The simulated mean annual increment was higher dur-
ing this cycle than during the previous one. This may be
partially explained by the fact that NFI had observed an
increase in standing volume in each age class between
1978 and 1988. This indicates that the age structureofthe
forest and the present silvicultural treatments were not
balanced: the simulated cuts were less than the increment
and wood accumulated.
According to the two scenarios proposed in the
current study, the average annual increment was esti-
mated as being higher than 10.5 Mm
3
yr
–1
in the region
(figure 9), a figure which is higher than the predictions
that Maugé had made (9.2 Mm
3
yr
–1
). During the period
from 1988 to 1998, the two scenarios were similar until
the 6th year. The higher final cut simulated by SII after
1994, resulted in a lower total standing volume and an-
nual increment at the end of the period. For the region in-
cluded in this study, the final total volume was 118 Mm
3
for SII and 124 Mm
3
for SI (figure 9). Despite the in-
creasing intensity of final cuts and thinnings, the simula-
tions indicated that wood resources continued to increase
in the ‘Landes de Gascogne’ during 1988–1998.
Final harvest
The simulated volume harvested in the final cuts ex-
hibited an increasing trend with time; the cuts raised up
to4to5Mm
3
yr
–1
at the end of the period. For SII, the
simulated cuts were higher in the 4 last years than for SI.
In both cases, the area and average volume of stands over
50 years increased from 1978 to 1998: the area increased
by 45% for SI and 37% for SII (figure 8), while the stand-
ing volume increased by 90% for SI and 80% for SII.
There was thus an accumulation of older stands that
could be clearcut in the future.
Maugé [28] had suggested a scenario to attain the de-
lay of the final harvest, rather than follow with the tradi-
tional practices for the final cut. Nevertheless, the total
volume estimated by him was still higher than that pre-
dicted with the two scenarios proposed here. The Minis-
try of Agriculture [30] estimated for 1998, an annual
volume of final harvest of around 5 Mm
3
yr
–1
for all the
stands present in the region, while our simulations
yielded 6 Mm
3
yr
–1
for SI and 7 Mm
3
yr
–1
for SII.
Thinnings
The intensity of thinnings increased by at least 50%
during this period. Nevertheless, the wood continued to
accumulate during this period. SI scenario was more reg-
ular than SII and finally slightly more wood was thinned
in SI. The accumulation of wood observed during
1978–1988 in the age classes under 50 years, was the
main reason for which the thinnings increased during
1988–1998 (figure 8).
4. DISCUSSION AND CONCLUSIONS
Lemoine’s model (Eq. (1–3)) performed better predic-
tions after it had been calibrated with a simple linear re-
gression model, which fitted the predicted and observed
Forecasting of wood resources 799
values (Eq. (4)). This simple method had demonstrated
its usefulness in other sciences such as physics, and more
recently in mathematics andagriculture[4, 8, 18, 36, 37].
Original Lemoine’s model underestimated the height
growth. Note that this bias was only statistically signifi-
cant for 10-year predictions: the larger is the lap of the
forecast, the more important is the error of estimation.
Three explanations are possible for this discrepancy:
(i) sampling errors: the original height growth model had
been built on the basis of the stem analysis of dominant
trees. In contrast, the dominant height was estimated by
NFI on small sample plots, which might result in a simi-
lar underestimation problem [35] yet described for c
0
[40]. However, this bias, if any, is likely to be small;
(ii) measurement errors: NFI measures height incre-
ments on standing trees by counting whorls and shoots
and measuring (from the ground) thelengthofthe shoots:
this method is not very precise for tall trees, and an over-
estimation is possible. Nevertheless, in this region mari-
time pine can bear 2 shoots per year (polycyclism); in
such cases, the main risk is to under-estimate periodic
height increments. Anyway, this error only applies to di-
rect height increment measurements, not to height incre-
ments obtained as the difference between 2 successive
measurements; (iii) climatic variability: Lemoine’s model
describes the average height growth over tree life,
whereas 5-year and 10-year height increments may be al-
tered by climatic events such as droughts. The only way
to cope with this problem wouldbetoreplace this empiri-
cal model by an environment-sensitive height growth
model and to develop regional environmental indices for
maritime pine [46].
Although the causes of the discrepancies in height
growth projections cannot be traced exactly, it seems that
there is a global increase in the apparent fertility in the
stands. This trend has been detected in NFI data of all
stands for Pinus pinaster, in the ‘Landes de Gascogne’
[41]. NFI has also observed such an apparent change in
site fertility in other regions and species in France, e.g.
for Picea alba. The literature concerning the growth
and forest yield has reported several causes, including
stand structure, abiotic factors such as climatic fluctu-
ations [3], and human management [26], such as the
silvicultural treatments and genetic selection of trees. At
this stage, the increase in height growth of Pinus pinaster
cannot be attributed only to environmental factors or to
long-term changes in management regimes [42].
Since Salas et al. [40] had demonstrated that NFI sam-
pling scheme resulted in biased estimates of c
0
(underes-
timation due to plot size), N and G (for young stands only
because of census threshold), that these biases could be
corrected, the variables N, G and c
0
were corrected before
testing the original model of the basal area increment of
dominant trees (Eq. (2–2.2)). However, its5-and10-year
predictions were significantly biased: the model overes-
timated the observed ig
0
. The same simple linear regres-
sion method was used for calibrating the model: it
resulted in better predictions for this variable.
For the basal area increment of the average tree (ig),
the biases were much smaller. Again, the previsions were
improved with the same calibration method.
Yaussy [46] indicates that empirical models are accu-
rate only when they are used in the range of data for
which they were developed. Because the sampling
scheme of NFI is fairly different from the experimental
designs used to derive the model (i.e., plot size, but also
silvicultural regimes and stand generation), we had to
calibrate the models. In addition, the competition or den-
sity indices and functions are only valid for the condi-
tions in which the model was created. Estimates of ig
0
from the original Lemoine’s model were thus highly
variable because of the large diversity of management
methods used in the ‘Landes de Gascogne’, and also be-
cause of the variability of site quality across the region.
This is easily observed in figure 6, where the overestima-
tion is systematically observed in stands over 50 years;
the stands of that age that remain uncut are in general,
those with the lower fertility. In contrast, the young
stands were underestimated, in agreement with reasons
proposed by Salas et al. [40].
The two silvicultural scenarios that were tested were
close to the current average silviculture practiced in the
region. For instance, in the period 1978–1988, the simu-
lated harvest by clearcuts and thinnings was comparable
to the values recorded by the Ministry of Agriculture
[30]. However, the simulated cuts were more irregular
than the actual ones. This is due to the deterministic na-
ture both of the model and the scenarios.
The total volume estimated with our simulation proce-
dure was similar to that recorded by the NFI. The dis-
crepancy that was observed was due to the thinning
scenario (i.e. to the delay of real thinnings) and maybe
because we did not consider regeneration or because we
reconstituted the fraction of stands neglected by the NFI
(below census threshold). Our simulations could there-
fore be considered as realistic, also because the
silvicultural practices did not strong change in the last
years.
Between 1978 and 1988, wood accumulated in the re-
gion: this was observed by NFI and simulated by our
800 R. Salas-González et al.
model and scenarios. Between 1988 and 1998, the har-
vests increased, and it seems that during the period
1998–2008 available wood in the region should be main-
tained at a high level. The mean annual increment was
higher than the harvest: this is due to the current trend to
retain a higher level of biomass, and to the apparent in-
crease of fertility caused by intensive silviculture.
Within the same age class and site class, we observed
that the stand characteristics observed by NFI were
highly variable. This is due to both the variability of the
silvicultural regimes practiced in the ‘Landes de
Gasgogne’ and the technical variability associated with
NFI sampling design (i.e. small plots). The method of
plot aggregation was therefore useful. Aggregated plots
represent the average conditions of a class of stands and
can be considered as homogenous strata, as those used in
sampling theory.
Our method of simulation based on the calibration of
the Lemoine´s model was a reasonable approach to eval-
uate the mid-term impact of the proposed management
scenarios in the ‘Landes de Gascogne’. As signaled by
Wei et al. [45], it is sometimes difficult to validate the
previsions generated by simulation methods. In our case
we had the possibility to globally test our simulation pro-
cess, i.e. the calibrated model, the scenarios and the
method of aggregation, between 1978 and 1988. Accord-
ing to the results, this global method is operational. How-
ever it would be interesting to test other methods of
aggregation and other ways of designing silvicultural re-
gimes, including stochastic criteria.
NFI’s main objective is to evaluate, at a particular mo-
ment, the existing wood resources and their (past)
changes (increment, harvests, natural mortality, etc.).
Nevertheless, in order to estimate the future evolution of
wood resources, it is necessary to apply growth models to
these data. Such models should be adapted to NFI data
gathered. The test of our simulation process could be car-
ried out because we had several data types: successive
forest inventories including increment data on temporary
plots as well as permanent plots; harvest data. Goulding
[12] indicates that, depending on the species, the perma-
nent plots should be kept for at least 15 or 20 years. For
this study, such plots were indeed very useful for validat-
ing and calibrating the growth model.
Acknowledgements: We thank G. Floater for the re-
vision and critical reading of the manuscript. We grate-
fully acknowledge National Forest Inventory Service for
supplying us the data used in this study. This work was
supported by the European Union grant CT–91–0040.
We also thank the two reviewers for their comments and
suggestions.
REFERENCES
[1] Afocel-armef., Mieux produire : une nécessité pour les
peuplements de pin maritime issus de ligniculture, Informations
forêt 1 (1988) 17–24.
[2] Acker S.A., Sabin T.E., Ganio L.M., McKee W.A., Deve-
lopment of old-growth structure and timber volume growth
trends in maturing Douglas-fir stands, For. Ecol. Manage. 104
(1998) 265–280.
[3] Becker M., Réponse des arbres aux variations du climat
dans l’Est de la France, Sécheresse 4 (1993) 241–244.
[4] Brown P.J., Multivariate calibration, J. R. Statis. Soc. B.
44 (1982) 287–321.
[5] Cremière L., Chaperon H., Alvarez-Marty S., La sylvicul-
ture pratique du pin maritime, Afocel, France, 1994, 145 p.
[6] Chuanzhong L., Mathematical models in forest resource
management planning. Ph.D. Thesis, Swedish University of
Agricultural Sciences, 1988.
[7] Chevrou R.B., La placette sol d’inventaire formée de plu-
sieurs cercles concentriques, Schwei. Z. Forstwes. 144 (4)
271–296.
[8] Faivre R, Goffinet B., Wallach D., Utilisation de données
intermédiaires pour corriger la prédiction de modèles mécanis-
tes, Biometrics 47 (1991) 1–12.
[9] Garcia O., Growth modelling – a (re)view, N. Z. For. 33
(1988) 14–18.
[10] Gadow von K., Hui G., Modelling Forest Development,
Kluwer Academic Publishers, Amsterdam, 1999.
[11] Gelpe J., Lefrou G., Essai de fertilisation minérale sur
pin maritime à Mimizan (Landes). Résultats après la 26
e
année,
Rev. For. Fr. 38 (1986) 394–400.
[12] Goulding C.J., Validation of growth models used in fo-
rest management, N. Z. J. For. 15 (1979) 108–124.
[13] Houllier F., Bouchon J., Birot J., Modélisation de la dy-
namique des peuplements forestiers : état et perspectives, Rev.
For. Fr. 43 (1991) 87–108.
[14] InventaireForestier National, Massifdes Landes de Gas-
cogne, Résultats de l’Inventaire Forestier 1977–1978, Ministère
de l’Agriculture, 1982.
[15] Inventaire Forestier National, But et méthodes de
l’Inventaire ForestierNational, Ministèrede l’Agriculture, 1985.
[16] InventaireForestier National, Massifdes Landes de Gas-
cogne, Résultats de l’Inventaire Forestier 1987–1988, Ministère
de l’Agriculture, 1991.
[17] Jonsson B., A growth model as a basis for long-term fo-
recasting of timber yields, in: Fries G., Burkhart H., Max S.
(Eds.), Growthmodels for long term forecastingof timber yields,
IUFRO Proceedings, 1978, pp. 119–138.
Forecasting of wood resources 801
[18] Krutchkoff R.G., Classical and inverse regression me-
thods of calibration, Technometrics 9 (1967) 425–439.
[19] Lanier L., Badre M., Delabraze J., Flammarion J.P., Pré-
cis de sylviculture, 2
e
éd., Enref-Nancy, Nancy, 1994.
[20] Lemoine B., Le pin maritime du sud-ouest de la France,
Étude des relations allométrique, concernant le volume des peu-
plements, en liaison avec certaines caractéristiques de la station,
Ann. Sci. For. 26 (1969) 445–473.
[21] Lemoine B., Application de l’analyse factorielle à
l’étude de la croissance des arbres : exemple du pin maritime,
Ann. Sci. For. 38 (1981) 31–54.
[22] Lemoine B., Croissance et production du pin maritime,
objectifs et méthods, in: Fries G., Burkhart H., Max S. (Eds.),
IUFRO Proceedings, 1982, pp. 115–126.
[23] Lemoine B., Growth and yield of maritime pine (Pinus
pinaster Ait): the average dominant tree of the stand, Ann. Sci.
For. 48 (1991) 593–611.
[24] Lemoine B., Champagne P., Gestion et modélisation du
pin maritime, Arbora 2 (1990) 483–492
[25] Lemoine B., Sartolou A., Les éclaircies dans les peuple-
ments de pin maritime d’âge moyen. Résultats et interprétation
d’une expérience, Rev. For. Fr. 28 (1976) 447–457.
[26] Lundquist J.E., Characterizing disturbance in managed
ponderosa pine stands in the Black Hills, For. Ecol. Manage. 74
(1995) 49–60.
[27] Maugé J.P., Concurrence et croissance juvénile du pin
maritime en ligniculture, Afocel 74 (1974) 177–205.
[28] Maugé J.P., Études prospectives du massif landais et ses
ressources forestières, Centre productivité forestière de l’Aqui-
taine, France, 1981, p. 63.
[29] Maugé J.P., Nouvelles techniques de sylviculture du pin
maritime, C.R. Acad. Agri. de France 70 (1984) 1174–1179.
[30] Statistiques forestières, Résultats 1988, Ministère de
l’Agriculture et de la Forêt, France, 1990.
[31] Les comptes de la forêt des Landes de Gascogne, Pre-
mière partie, Ministère de l’Environment, France, 1987.
[32] Moore T.G.E., Lockwood C.G., The HSG wood supply
model: description and user’s manual, Petawa National Forestry
Institute, Forestry Canada, Information Report PI-X-98, 1990,
31 p.
[33] Ottorini J.M., Medium term forecasting of available
yield from Norway spruce forests in the north-east of France, Fo-
restry 57 (1984) 45–58.
[34] Páscoa F., Using inventory data to build growth and
yield Stand Modes, in: IUFRO Proceedings, U.S.A., 1988,
pp 2–5.
[35] Pierrat J.C., Houllier F., Hervé J.Ch., Salas-González R.,
Estimation de la moyenne des valeurs les plus élevées d’une po-
pulation finie, Biometrics 51 (1995) 679–685.
[36] Rao C.R., Prediction of future observations in growth
curve models, Statistical Science 2 (1987) 434–471.
[37] Richardson D.H., Wu D., Least squares and grouping
method estimators in the errors in variables model, Journal of the
American Statistical Association 65 (1970) 724– 748.
[38] Rondeux J., Modèles de croissance et production, in: La
mesure des arbres et des peuplements, Les presses agronomiques
de Gembloux, Gembloux, 1994.
[39] Salas, G.R., Modélisation de l’évolution de la ressource
du massif du pin maritime (Pinus pinaster) des Landes de Gas-
cogne. Thèse de Doctorat à l’Ecole Nationale du Génie Rural,
des Eaux et des Forêts, France, 1995.
[40] Salas-Gonzalez R., Houllier F., Lemoine B., Pierrat J.C.,
Représentativité locale des placettes d’inventaire en vue de l’es-
timation des caractéristiques dendrométriques de peuplement,
Ann. Sci. For. 50 (1993) 469–485.
[41] Salas-González R., Houllier F., Modélisation de la hau-
teur dominant à partir des données de l’inventaire forestier natio-
nal (document interne), Engref, 1993.
[42] Schreuder T., Thomas C.E., Establishing cause-effect
relationship using forest survey data. Forest Sci. 37 (1991)
1497–1512.
[43] Soares P., Tomé M., Skovsgaard J.P., Vanclay J.K, Eva-
luating a growth model for forest management using continuous
forest inventory data, For. Ecol. Manage. 71 (1995) 256–266.
[44] Traub N., Construction de tables de production pour le
pin maritimeen Gascogne àpartir des donnéesde l’inventaire fo-
restier national. Mémoire de fin d’études, École National du
Génie Rural des Eaux et des Forêts, 1991.
[45] Wei X., Liu W., Waterhouse J., Armleder M., Simula-
tions on impacts of different management strategies on long-
term site productivity in lodgepole pine forests of the central in-
terior of British Columbia, For. Ecol. and Manage. 133 (2000)
217–229.
[46] Yaussy D.A., Comparison of an empirical forest growth
and yield simulator and a forest gap simulator using actual 30-
year growth from two even-aged forests in Kentucky, For. Ecol.
Manage. 126 (2000) 385–398
802 R. Salas-González et al.