Báo cáo khoa học: "Performance and morphological response of the hybrid poplar DN-74 (Populus deltoides x nigra) under different spacings on a 4-year rotation" pps
Bạn đang xem bản rút gọn của tài liệu. Xem và tải ngay bản đầy đủ của tài liệu tại đây (1.2 MB, 13 trang )
Original
article
Performance
and
morphological
response
of
the
hybrid
poplar
DN-74
(Populus
deltoides
x
nigra)
under
different
spacings
on
a
4-year
rotation
Guy
R.
Larocque
Natural
Resources
Canada,
Canadian
Forest
Service,
Laurentian
Forestry
Centre,
1055
du
P.E.P.S.,
P.O.
Box
3800,
Sainte-Foy,
Quebec
G1V
4C7,
Canada
(Received
8
April
1998;
accepted
15
December
1998)
Abstract -
The
effect
of
competition
on
the
performance
and
morphological
response
of
the
hybrid poplar
DN-74
(Populus
deltoides
x
nigra)
was
examined
by
varying
stand
density
from
4
444
stems
ha-1
to
40
000
stems
ha-1
.
The
root
collar
diameter
growth
of
indi-
vidual
trees
was
inversely
related
to
the
intensity
of
competition,
as
there
was
nearly
a
two-fold
decrease
in
root
collar
diameter
from
the
largest
to
the
closest
density
after
only
four
growing
seasons.
Crown
width,
crown
ratio,
leaf
biomass
and
leaf
area
decreased
sig-
nificantly
with
an
increase
in
density.
However,
crown
shape
ratio,
leaf
area
projection
and
leaf
area
ratio
did
not
vary
significantly
with
stand
density,
and
specific
leaf
area
decreased
with
the
degree
of
crown
closure
and
crown
depth,
which
indicated
that
this
hybrid
shows
a
high
degree
of
plasticity
in
response
to
competition.
Nutrient
contents
of
foliage
and
stems
did
not
vary
much
with
the
intensity
of
competition.
(©
Inra/Elsevier,
Paris.)
relative
growth
rate
/ leaf
area
/
specific
leaf
area
/
competition
/
short
rotation
forestry
Résumé -
Performance
et
réponse
morphologique
du
peuplier
hybride
DN-74
(Populus
deltoides
x
nigra)
sous
différents
espa-
cements
pour
une
rotation
de
quatre
ans.
L’effet
de
la
compétition
sur
la
performance
et
la
réponse
morphologique
du
peuplier
hybride
DN-74
(Populus
deltoides
x
nigra)
a
été
examiné
en
faisant
varier
la
densité
de
4
444
tiges
ha-1
à
40 000
tiges
ha-1
.
La
crois-
sance
en
diamètre
au
niveau
du
collet
était
inversement
reliée
à
l’intensité
de
la
compétition :
le
diamètre
au
niveau
du
collet
a
dimi-
nué
de
moitié
de
la
plus
faible
densité
à
la
plus
élevée
après
seulement
quatre
saisons
de
croissance.
La
largeur
de
la
cime,
le
rapport
de
la
longueur
de
la
cime
sur
la
hauteur
de
la
tige,
la
biomasse
foliaire
et
la
surface
foliaire
ont
diminué
de
façon
significative
avec
un
accroissement
de
la
densité.
Cependant,
le
rapport
de
la
largeur
de
la
cime
sur
la
longueur
de
la
cime,
la
surface
foliaire
projetée
et
le
rapport
de
la
surface
foliaire
sur
la
biomasse
foliaire
et
des
tiges
n’ont
pas
varié
de
façon
significative
avec
la
densité,
et
la
surface
foliaire
spécifique
a
diminué
avec
le
degré
de
fermeture
du
couvert
et
la
profondeur
dans
le
couvert,
ce
qui
indique
que
cet
hybride
se
caractérise
par
un
degré
élevé
de
plasticité
quand
il
est
soumis
à
la
compétition.
Les
contenus
en
éléments
nutritifs
du
feuillage
et
des
tiges
n’ont
pas
varié
de
façon
appréciable
avec
l’intensité
de
la
compétition.
(©
Inra/Elsevier,
Paris.)
taux
relatif
de
croissance
/
surface
foliaire
/
surface
foliaire
spécifique
/
compétition
/
foresterie
à
courte
révolution
1.
Introduction
The
introduction
of
various
hybrid
poplar
clones
into
North
America
for
intensive
production
of
biomass
on
short
rotation
generated
numerous
studies
which aimed
at
comparing
the
productivity
of
several
hybrids
[5,
9,
46]
and
evaluating
the
effect
of
stand
density
and
cultur-
al
treatments
such
as
fertilization,
sludge
application
or
weed
control
[7,
8,
16, 21-23].
The
main
contribution
of
these
types
of
studies
has
consisted
in
providing
sound
guidelines
based
on
empirical
knowledge
for
the
man-
agement
of
poplar
plantations.
However,
there
is
still
lit-
tle
information
concerning
the
amplitude
of
above-
and
below-ground
competition.
Moreover,
the
extent
to
which
acclimation
to
competitive
stress
takes
place
in
hybrid
poplar
remains
unknown.
These
issues
must
be
addressed
with
experimental
data
based
on
the
compari-
son
of
trees
subject
to
different
intensities
of
competition
to
ensure
that
biomass
productivity
is
not
affected
by
excessive
mortality
or
under-utilization
of
growing
space
and
site
resources.
This
information
is
crucial
in
guiding
foresters
to
select
an
optimal
spacing
and
rotation
period
and
to
assess
the
necessity
to
apply
expensive
cultural
treatments
such
as
fertilization
or
irrigation
in
order
to
increase
biomass
production
per
unit
area.
Plants
may
respond
to
the
intensification
of
competi-
tion
for
site
resources
by
increasing
uptake
rate,
reducing
losses
or
improving
the
efficiency
of
their
internal
mor-
phological
and
physiological
apparatus
to
produce
new
biomass
[18].
For
instance,
changes
in
morphological
characteristics
such
as
the
number
of
palisadic
parenchy-
ma
layers
or
chloroplasts,
stomatal
density
and
size,
which
indicate
acclimation
to
variation
in
light
condi-
tions
[1,
15,
17],
may
occur
when
the
increase
in
com-
petitive
stress
results
in
substantial
changes
in
the
amount
of
solar
radiation
intercepted
by
the
canopy.
These
types
of
change
in
morphological
characteristics,
which
are
related
to
changes
in
physiological
characteris-
tics
such
as
light
compensation
point,
are
probably
important
when
competition
takes
place
in
hybrid
poplar
stands
because
fast-growing
species
are
usually
charac-
terized
by
a
high
degree
of
plasticity
[31],
and
greater
rates
of
nutrient
uptake,
accumulation
and
turnover
than
most
temperate
species
[2].
The
objectives
of
the
present
study
were
to
evaluate
the
performance
of
the
hybrid
poplar
DN-74
(Populus
deltoides
x
nigra)
under
competition
in
a
4-year
rotation
and
to
determine
how
it
responds
to
competitive
stress.
This
clone
was
selected
for the
present
study
because
it
was
planted
quite
extensively
in
eastern
Canada
[39].
The
extent
to
which
crowns
and
foliage
responded
in
terms
of
space
occupancy,
efficiency
to
occupy
growing
space
and
modifications
in
morphological
characteristics
and
the
effect
on
tree
nutrition
were
examined.
The
fol-
lowing
hypotheses
were
tested.
As
the
intensity
of
com-
petitive
stress
increases,
crowns
acclimate
greatly
to
reduced
growing
space.
There
is
strong
interaction
between
leaf
nutrition
and
leaf
acclimation.
However,
despite
acclimation,
the
efficiency
of
crowns
to
occupy
their
growing
space
is
negatively
affected.
2.
Materials
and
methods
2.1.
Experimental
design
and
measurements
The
experiment
took
place
in
the
nursery
of
the
Petawawa
National
Forestry
Institute
(latitude
46°00’N,
longitude
76°26’W).
Cuttings
measuring
25
cm
provided
by
the
Ontario
Ministry
of
Natural
Resources
were
plant-
ed
in
three
square
spacings
in
June
1990:
0.5,
1.0
and
1.5
m.
The
experimental
design
consisted
of
a
Latin
square
with
two
blocks.
Eighteen
plots
measuring
6
m
x
6
m
separated
by
a
distance
of 2
m
were
laid
out
on
the
field.
Thus,
each
spacing
was
replicated
six
times.
The
edge
row
on
each
side
of
every
sample
plot
was
considered
as
a
buffer
zone.
Grass
vegetation
was
hand-removed
regu-
larly
to
eliminate
the
effect
of
interspecific
competition.
As
more
than
one
stem
emerged
from
individual
cut-
tings,
every
stem
was
identified
with
a
numbered
tag
to
ensure
that
the
growth
of
each
individual
stem
would
be
monitored.
For
most
of
the
cuttings,
the
first
stem
that
emerged
was
characterized
by
far
superior
growth
than
those
that
appeared
later.
For
this
reason,
both
groups
were
analysed
separately.
Thus,
the
term
main
stem
will
be used
to
designate
the
stems
that
appeared
first
on
a
cutting
while
the
term
secondary
stem
will
designate
those
that
appeared
later.
Root
collar
diameter
(RCD)
(±
1
mm)
and
total
height
(±
1 cm)
of
each
stem
originating
from
cuttings
were
measured
at
the
end
of
each
growing
season.
In
October
1993,
102
trees
(main
and
secondary
stems)
were
select-
ed
in
each
sample
plot
for
detailed
biomass and
nutrient
measurements.
The
number
of
trees
harvested
in
every
sample
plot
differed
with
spacing:
10,
4 and
3
within
the
0.5,
1.0
and
1.5
m
spacing,
respectively.
A
stratified
ran-
dom
sampling
procedure
was
used
for
each
plot
to
ensure
that
small
and
large
trees
would
be
adequately
represented.
First,
all
the
trees
were
grouped
into
diame-
ter
classes,
and
then
trees
were
selected
at
random
within
each
diameter
class.
Before
trees
were
harvested,
RCD,
height
and
maximum
crown
width
and
length
(±
1
cm)
were
measured.
Then,
crowns
were
separated
into
three
equal
sections
in
height
and
harvested
separately.
In
the
remainder
of
the
text,
sections
1,
2
and
3
will
refer
to
the
bottom,
middle and
top
sections
of
the
crown,
respec-
tively.
For
all
the
foliage
in
every
crown
section,
leaf
area
was
measured
with
a
LI-COR
area
meter,
model
LI-
3100
[32],
with
a
resolution
of ±
1
mm
2,
and
leaf
bio-
mass
was
determined
after
drying
the
material
in
an
oven
at
70 °C
until
no
change
in
mass
was
detected.
All
the
basic
measures
specified
above
were
used
to
derive
measures
of
performance
or
growth
efficiency
[24, 25]:
Relative
growth
rate
(RGR)
is
a
measure
of
growth
effi-
ciency
that
estimates
the
capacity
of
trees
to
produce
biomass
[14,
28].
W2
and
W1
represent
RCD
or
height
at
ages
T2
and
T1,
respectively.
While
an
absolute
measure
such
as
crown
width
pro-
vides
an
evaluation
of
the
effect
of
competition
on
aerial
space
occupancy,
relative
measures
can
be
derived
to
evaluate
the
efficiency
of
crowns
to
occupy
their
grow-
ing
space:
Crown
ratio
(CR)
is
an
indicator
of
the
photosynthetic
capacity
of
a
tree
[45]
and,
thus,
constitutes
a
measure
of
its
vigor.
Crown
shape
ratio
(CSR)
evaluates
the
ability
of
crowns
to
intercept
solar
radiation
[30,
41,
51].
The
lower
the
ratio,
the
more
efficiently
crowns
intercept
solar
radia-
tion
within
dense
stands.
Leaf
area
projection
(LAP)
estimates
the
amount
of
leaf
cover
over
the
horizontal
area
occupied
by
individual
crowns.
The
last
three
ratios
constitute
measures
of
production
efficiency,
as
they
estimate
the
capacity
of
crowns
to
intercept
solar
radiation
or
occupy
their
aerial
growing
space
in
different
conditions
of
stand
density.
Two
relative
measures
were
derived
to
examine
the
effect
of
competition
on
morphological
characteristics
of
crowns
and
foliage:
Leaf
area
ratio
(LAR)
estimates
the
proportion
of
photo-
synthesizing
biomass
relative
to
respiring
biomass,
and
also
depends
on
the
anatomy
and
chemical
composition
of
foliage
[31].
Specific
leaf
area
(SLA)
is
highly
sensitive
to
light
envi-
ronment
[27,
47],
and
nutrient
contents
[ 10,
31,
34].
2.2.
Plant
and
soil
nutrient
determinations
Nutrient
concentrations
for
stem
and
foliage
within
each
crown
section
were
determined
for the
main
stems
at
the
end
of
the
fourth
growing
season
in
October
1993.
For
the
foliage
in
each
crown
section
and
the
stem
of
every
tree,
all
the
biomass
was
thoroughly
mixed
and
a
subsample
was
taken
and
ground
for
laboratory
analyses.
Nitrogen
content
was
determined
with
a
NA-2000
dry
combustion
N-analyzer
[13].
The
first
step
in
determin-
ing
the
contents
in
P,
K,
Mg
and
Ca
consisted
in
apply-
ing
the
dry
ashing
procedure
of
Kalra
and
Maynard
[26].
Then,
an
Ultrospec
II
spectrophotometer
[26,
33]
was
used
for
P
and
an
atomic
absorption
spectrophotometer
was
used
for
K,
Ca
and
Mg
[49].
Within
each
plot,
soil
samples
were
collected
in
October
1993
with
a
large
AMS
soil
corer
between
0
and
10
cm,
10
and
20
cm,
and
20
and
30
cm
at
four
locations
positioned
along
the
diagonal
of
the
plots
and
1
m
from
the
center.
The
samples
were
dried,
weighed
and
sieved
to
2
mm.
Then
bulk
density
and
pH
(1:2.5
soil:0.01
M
CaCl
2)
were
measured.
Nitrogen
content
was
determined
by
the
Kjeldahl
procedure
[26],
and
P,
K,
Mg
and
Ca
contents
by
Mehlich
extraction
combined
with
an
Ultrospec
II
spectrophotometer
[26,
33,
37].
2.3.
Statistical
analysis
As
the
growth
of
individual
trees
was
measured
repeatedly,
a
multivariate
approach
with
repeated
mea-
sures
was
used
to
analyze
cumulative
growth
and
RGR
for
RCD
and
height
using
the
GLM
procedure
in
SAS
[44].
where
y
ijkln
is
the
dependent
variable, p
the
overall
mean
effect,
ρ
i
the
effect
of
the
Latin
square,
α
j(i)
the
slope
effect
within
a
block,
β
k(i)
the
section
effect
within
the
block,
τ
l
the
spacing
effect,
γ
n
the
age
effect
(repeated
measurement),
a
ik
a
random
effect
related
to
groups
of
three
plots
within
each
block,
and
e
ijkl
the residual
error.
Greek
characters
represent
fixed
effects
and
Roman
characters,
random
effects.
Subscripts
refer
to
individual
observations
within
each
effect.
Orthogonal
contrasts
were
computed
when
the
age
x
spacing
effect
was
signif-
icant
in
order
to
compare
the
spacings
over
time.
Contrast
I
was
defined
to
compare
the
0.5
m
spacing
with
the
1.0
m
and
1.5
m
spacings
(2,
-1,
-1)
and
con-
trast
II
to
compare
the
1.0
m
spacing
with
the
1.5
m
spacing
(0,
-1,
-1).
As
there
were
repeated
measure-
ments,
the
significance
test
for
a
particular
growing
sea-
son
determines
if
the
difference
between
treatments
obtained
differs
from
the
difference
in
the
last
growing
season
[44].
The
same
ANOVA
model
and
coefficients
of
orthogonal
contrasts
were
used
to
compare
growth
and
crown
parameters
measured
at
harvesting
and
nutri-
ent
content
data,
except
that
the
repeated
measurement
component
(γ
n)
was
excluded.
Linear
regression
analysis
of
SLA
as
a
function of
nutrient
concentration
was
undertaken
to
compare
the
slope
of
the
relationship
among
spacings.
The
degree
of
the
slope
provides
a
measure
of
nutrient
use
efficiency:
the
steeper
the
slope,
the
more
efficiently
nutrients
are
used
to
build
up
leaf
material.
Differences
in
slope
among
spacings
would
indicate
strong
interaction
between
leaf
nutrition
and
leaf
acclimation
under
differ-
ent
intensities
of
competition.
3.
Results
3.1.
Soil
conditions
Bulk
density
and
pH
at
three
depths
did
not
differ
sig-
nificantly
among
the
spacings
(table
I).
For
the
whole
site,
average
values
were
1.25,
1.50
and
1.57
g
cm-3
,
and
4.66, 4.61
and
4.91
for
bulk
density,
and
pH
between
0
and
10
cm,
10
and
20
cm,
and
20
and
30
cm,
respective-
ly.
Also,
no
significant
differences
were
found
for
nutri-
ent
concentrations
(table
I).
Average
values
for the
whole
site
were
0.79
mg
g
-1
,
321.25
pg
g
-1
,
0.06
mg
g
-1
,
0.03
mg
g
-1
,
and
0.44
mg
g
-1
for
N,
P,
K,
Mg
and
Ca
between
0
and
10
cm,
respectively.
Corresponding
con-
centrations
between
10
and
20
cm,
and
20
and
30
cm
were
0.80
and
0.52
mg
g
-1
,
328.77
and
276.26
μg
g
-1
,
0.04
and
0.02
mg
g
-1
,
0.03
and
0.03
mg
g
-1
,
and
0.47
and
0.39
mg
g
-1
,
respectively.
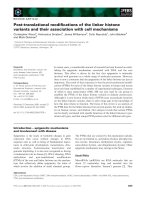
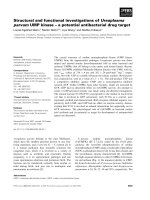
3.2.
Stem
development
Cumulative
growth
in
RCD
and
height
for
both
main
and
secondary
stems
increased
with
age
for
all
spacings
(figure
1).
Not
only
was
the
age
effect
significant,
but
was
also
the interaction
age
x
spacing
(table
II),
which
indicates
that
the
magnitude
of
the
response
to
competi-
tion
increased
significantly
with
age.
This
is
particularly
evident
for
RCD
of
the
main
stems,
as
the
contrast
between
the
0.5
m
spacing
and
the
1.0
m
and
1.5
m
spac-
ings
was
significant
for
every
age;
differences
between
both
groups
of
spacings
in
the
first,
second
and
third
growing
seasons
differed
significantly
from
the
differ-
ence
in
the
fourth
growing
season.
This
can
be
seen
in
figure
1.
While
the
three
spacings
had
very
close
values
in
RCD
in
the
first
growing
season,
differences
among
spacings
accentuated
with
age
such
that
the
stems
within
the
closest
spacing
reached
about
half
the
diameter
of
those
within
the
1.5
m
spacing.
For
RCD
of
secondary
stems,
contrasts
I
and
II
were
significant
only
in
the
first
growing
season.
The
differences
between
the 0.5
m
spac-
ing
and
the
1.0
m
and
1.5
m
spacings
and
between
the
1.0
m
and
1.5
m
spacings
relative
to
those
in
the
fourth
growing
season
did
not
change
significantly
with
age
after
the
first
growing
season.
This
pattern
probably
resulted
from
the
fact
that
competition
had
not
taken
place
in
the
first
growing
season,
as
RCD
for the
three
spacings
was
very
close
in
the
first
growing
season.
Differences
in
height
growth
among
spacings
were
rela-
tively
less
pronounced
than
differences
obtained
for
RCD.
For
the
main
stems,
contrast
I
was
significant
in
the
second
growing
season
and
contrast
II
was
significant
in
the
first
growing
season
only,
and
none
of
the
con-
trasts
was
significant
for the
secondary
stems
(table
II).
Relative
growth
rate
for
both
RCD
and
height
of
main
and
secondary
stems
decreased
significantly
with
age
and
the
age
x
spacing
interactions
were
significant
(fig-
ure
1,
table
II).
Contrast
I
for
RCD
of
the
main
stems
was
significant
for
the
period
from
the
second
to
the
third
growing
season
and
contrast
II
was
significant
for
the
period
from
the
first
to
the
second
growing
season.
For
contrast
I,
this
can
probably
be
explained
by
the
fact
that
RGRs
for
the
three
spacings
were
more
or
less
regu-
larly
spaced
for
the
period
from
the
first
to
the
second
growing
season
relative
to
the
period
from
the
third
to
the
fourth
growing
season,
and
then
RGR
of
the
1.0
m
and
1.5
m
spacings
became
relatively
close
for
the
two
other
periods.
This
also
explains
why
contrast
II
was
significant
for
the
period
from
the
first
to
the
second
growing
season.
For
RCD
RGR
of
secondary
stems,
only
contrast
I
was
significant,
which
was
probably
due
to
the
fact that
RGRs
for the
1.0
and
1.5
m
spacings
were
nearly
equal
for
the
periods
from
the
second
to
the
third
growing
season
and
from
the
third
to
the
fourth
growing
season,
while
the
0.5
m
spacing
remained
relatively
lower
at
each
period.
For
height
RGR
of
main
stems,
contrast
I
was
significant
for
the
period
from
the
second
to
the
third
growing
season
and
contrast
II
was
signifi-
cant
for
the
period
from
the
first
to
the
second
growing
season.
These
trends
can
be
explained
by
changes
in
height
RGR
with
age
(figure
1).
For
the
period
from
the
first
to
the
second
growing
season,
the
1.5
m
spacing
had
relatively
higher
RGR
than
the
other
spacings.
Then,
RGR
decreased
for
all
spacings,
but
the
decrease
was
less
pronounced
for the
0.5
and
1.0
m
spacings.
Finally,
height
RGR
for
all
spacings
did
not
change
much
for
the
two
subsequent
periods,
except
for
the 0.5
m
spacing,
and
the
three
spacings
had
nearly
equal
values
for
the
last
period.
For
height
RGR
of
secondary
stems,
only
contrast
I
was
significant
(table
II).
Except
in
the
period
from
the
first
to
the
second
growing
season,
the
two
largest
spacings
had
nearly
equal
RGR,
while
the
0.5
m
spacing
had
relatively
lower
RGR.
Stem
biomass
production
for
the
fourth
growing
sea-
son
was
estimated
for
each
spacing
by
using
an
equation
which
was
derived
from
dry
weight
measurements
undertaken
on
harvested
trees:
The
dry
weights
computed
for
individual
trees
were
summed
for
each
sample
plot
to
obtain
estimates
of
bio-
mass
production
per
unit
area
(table
III).
For
each
spac-
ing,
the
biomass
production
of
secondary
stems
was
on
average
13
%
of
the
production
of
the
main
stems.
While
biomass
production
did
not
increase
much
by
decreasing
spacing
from
1.5
to
1.0
m,
biomass
production
nearly
doubled
from
the
1.0
m
to
the 0.5
m
spacing.
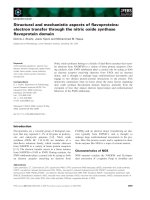
3.3.
Crown
development
After
four
growing
seasons,
crown
width,
leaf
bio-
mass
and
leaf
area
of
individual
trees
differed
signifi-
cantly
among
spacings
(figure
2
A-C,
table
IV).
For
the
main
stems,
crown
width
increased
on
average
by
a
fac-
tor
of
2
from
the 0.5
m
to
the
1.0
m
spacing,
and
by
a
factor
of
1.5
from
the
1.0
m
to
the
1.5
m
spacing.
The
corresponding
factors
for
both
leaf
biomass
and
leaf
area
were
about
4.2
and
1.7,
respectively.
Changes
for
sec-
ondary
stems
were
less
pronounced.
Crown
width
increased
by
a
factor
of
2
from
the
0.5
m
to
the
1.0
m
spacing,
but
no
significant
difference
was
obtained
between
the
1.0
m
and
1.5
m
spacings.
Leaf biomass
and
leaf
area
did
not
differ
significantly
among
spacings
(table
IV).
For
each
spacing,
differences
in
leaf
biomass
and
area
between
main
and
secondary
stems
were
more
pronounced
than
differences
in
crown
width.
Crown
width
increased
by
factors
of
1.38,
1.49
and
1.15
from
secondary
to
main
stems
in
the
0.5,
1.0
and
1.5
m
spac-
ings,
respectively.
Corresponding
factors
for
leaf
bio-
mass
and
area
were
about
3,
9
and
6.
Among
all
the
relative
measures
of
crown
develop-
ment,
a
significant
difference
was
obtained
for
crown
ratio,
and
only
between
the
0.5
m
spacing
and
the
1.0
and
1.5
m
spacings
for
both
main
and
secondary
stems
(figure
2
D-G,
table
IV).
Compared
with
main
stems,
secondary
stems
had
greater
CSR,
but
lower
LAP
and
nearly
equal
LAR.
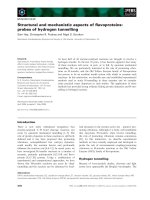
Significant
decreases
in
SLA
were
obtained
between
the 0.5
m
spacing
and
the
1.0
and
1.5
m
spacings
for
the
main
stems
within
the
three
sections
(figure
3,
table
IV).
The
1.0
and
1.5
m
spacings
did
not
differ
significantly,
except
for
section
2.
For
secondary
stems,
the
ANOVA
was
computed
only
for
section
1
of
the
crown,
which
also
indicated
a
significant
decrease
in
SLA
with
increase
in
spacing
between
the
0.5
m
spacing
and
the
1.0
and
1.5
m
spacings
(figure
3).
Specific
leaf
area
val-
ues
were
missing
for
some
plots
in
sections
2
and
3,
as
several
secondary
stems
had
very
small
crowns.
Despite
the
absence
of
statistical
tests,
the
same
pattern
of
decrease
with
increase
in
spacing
was
obtained
(figure
3).
For
both
main
and
secondary
stems,
SLA
decreased
from
the
bottom
to
the
top
of
the
crown.
Leaf
area
index,
which
was
computed
from
the
sum-
mation
of
the
leaf
area
of
individual
trees
within
a
sam-
ple
plot
divided
by
the
area
upon
which
they
stood,
dif-
fered
significantly
only
between
the
0.5
m
spacing
and
the
1.0
m
and
the
1.5
m
spacings
for
both
main
and
sec-
ondary
stems
(table
IV).
Average
values
for
the
main
stems
were
3.11,
2.51
and
2.46
for
the
0.5,
1.0
and
1.5
m
spacings,
respectively.
Corresponding
values
for
sec-
ondary
stems
were
0.56,
0.33
and
0.38.
3.4.
Nutrients
Spacing
did
not
have
a
major
effect
on
nutrient
con-
centrations
(figure
4,
table
V).
No
significant
differences
were
obtained
within
section
1
for
all
nutrients.
Significant
differences
were
obtained
for
phosphorus
in
sections
2 and
3
of
the
crown,
and
for
potassium
in
sec-
tion
2 only.
For
stems,
significant
differences
were
obtained
for
N,
P
and
Ca.
Linear
regression
equations
of
SLA
as
a
function
of
tree
nutrient
concentrations
were
significant,
except
for
N and
P
in
the 0.5
m
spacing
and
for
Mg
in
the
1.5
m
spacing
(table
VI).
The
strength
of
the
relationship
improved
for
N,
P
and
K
from
the
0.5
m
spacing
to
the
1.0
m
spacing,
remained
the
same
for
Ca,
and
decreased
for
Mg.
For
each
nutrient,
the
large
confidence
limits
of
the
slopes
do
not
indicate
significant
differences
among
the
spacings.
4.
Discussion
4.1.
Site
conditions
and
growth
The
absence
of
significant
differences
for
bulk
densi-
ty,
pH
and
nutrient
concentrations
at
all
depths
indicates
that
trees
were
growing
in
homogeneous
soil
conditions
(table
I).
Thus,
the
significant
variations
in
growth,
crown
development
and
nutrient
contents
in
leaves
and
stems
that
were
obtained
cannot
be
attributed
to
differ-
ences
in
soil
conditions.
When
spacings
were
compared
one
by
one,
secondary
stems
reached
about
half
the
size
of
the
main
stems
in
every
year
(figure
1).
While
both
groups
had
relatively
close
RGRs
initially,
differences
accentuated
with
age.
Internal
competition
for
carbohydrates
within
a
plant
probably
explains
these
results
[28].
This
theory
stipu-
lates
that
carbohydrate
partitioning
is
influenced
by
com-
petitive
interactions
among
internal
organs
or
sinks.
As
they
emerged
first,
main
stems
gained
a
competitive
advantage
by
building
up
larger
crowns
with
more
foliage
than
secondary
stems,
allowing
them
to
become
strong
sinks.
The
increase
in
differences
in
cumulative
growth
between
main
and
secondary
stems
suggests
that
the
amplitude
of
competitive
advantage
that
the
main
stems
gained
initially
increased
with
age.
This
is
also
supported
by
changes
in
RGR.
Despite
lower
initial
cumulative
RCD
and
height,
the
capacity
of
secondary
stems
to
produce
biomass
was
nearly
equal
to
that
of
main
stems
in
the
first
growing
season,
particularly
for
the 0.5
and
1.5
m
spacings
for
RCD
and
the
0.5
and
1.0
m
spacings
for
height.
Then,
the
capacity
of
sec-
ondary
stems
to
produce
biomass
decreased
relative
to
that
of
main
stems.
The
pattern
of
decrease
in
RGR
with
age
for
both
main
and
secondary
stems
indicates
that
the
capacity
of
trees
to
produce
biomass
diminished
(figure
1),
which
is
the
usual trend
of
change
in
efficiency
for
perennial
plants
[53].
However,
when
spacings
are
compared,
dif-
ferences
in
cumulative
growth
increased
significantly
with
age
while
differences
in
RGR
decreased,
particular-
ly
for
RCD
(figure
1).
Thus,
the
increase
in
cumulative
growth
from
the 0.5
m
to
the
1.5
m
spacing
did
not
result
in
a
proportional
decrease
in
the
capacity
of
plants
to
produce
biomass,
which
suggests
an
acclimation
to
com-
petitive
stress.
4.2.
Crown
development
The
significant
differences
obtained
for
crown
width
and
leaf
biomass
and
area
for
the
main
stems
indicate
that
competition
reduced
the
aerial
space
occupancy
of
individual
crowns
and
that
the
amount
of
foliage
they
supported
as
spacing
was
decreased.
Crowns
did
not
overlap
much
since
widths
attained
coincided
closely
with
initial
spacings.
For
secondary
stems,
the
effect
of
competition
was
less
pronounced
as
only
crown
width
differed
significantly
(table
IV).
The
internal
competition
for
carbohydrates,
which
was
discussed
above,
probably
explains
this
pattern:
as
the
main
stems
became
strong
sinks,
fewer
resources
were
available
for
the
develop-
ment
of
crowns
of
secondary
stems.
Despite
the
reduction
in
available
growing
space,
the
efficiency
of
crowns
to
occupy
their
growing
space
was
not
greatly
affected.
No
significant
differences
were
obtained
for
CSR,
LAI
and
LAR,
which
indicates
that
the
ability
of
crowns
to
intercept
solar
radiation,
the
amount
of
leaf
cover
and
the
proportion
of
photosynthe-
sizing
tissues
relative
to
respiring
biomass
did
not
vary
with
the
intensity
of
competitive
stress.
Even
though
sig-
nificant
differences
were
obtained
for
both
main
and
sec-
ondary
stems,
the
lower
CR
in
the 0.5
m
spacing
relative
to
the
1.0
and
1.5
m
spacings
does
not
indicate
severe
crown
recession,
which
indicates
that,
even
though
the
expansion
of
individual
crowns
was
severely
inhibited
by
neighboring
competitors,
leaves
located
deep
within
the
canopy
were
able
to
photosynthesize
under
relatively
low
light
intensity.
The
significant
changes
in
SLA
in
the
three
crown
sections
and
the
increase
with
crown
depth
indicate
acclimation
to
shade
conditions
[11,
20,
50]
as
crown
closure
occurred
and
intensified.
The
pattern
of
change
in
SLA
with
increase
in
stand
density
is
similar
to
that
observed
in
plants
growing
under
different
light
condi-
tions
[11,
19,
35,
38],
in
plants
subjected
to
competition
by
surrounding
vegetation
[3,
4,
52]
or
in
trees
released
following
thinning
[e.g.
20].
Increase
in
SLA
with
crown
depth
was
observed
by
Hager
and
Sterba
[20]
in
Norway
spruce
(Picea
abies
(L.)
Karst.)
stands
and
by
Petersen
et
al.
[40]
in
Fraxinus
mandshurica
stands.
Similarly
to
the
results
of
this
study,
Petersen
et
al.
[40]
observed
that
the
increase
in
SLA
with
crown
depth
accentuated
with
stand
density.
Changes
in
SLA
are
often
related
to
sun
and
shade
leaf
morphology
with
anatomical
and
physio-
logical
characteristics
adapted
to
photosynthesize
effi-
ciently
under
high
and
low
solar
radiation
levels,
respec-
tively.
For
instance,
sun
leaves
have lower
SLA,
thicker
mesophyll,
greater
stomatal
density
and
size,
and
larger
chloroplasts
than
shade
leaves
[17].
According
to
Ducrey
[11],
when
SLA
is
increased,
light
rays
can
reach
car-
boxylation
sites
more
easily
and
resistance
to
CO,
diffu-
sion
within
the
mesophyll
and
maintenance
respiration
needs
are
reduced.
Chen
et
al.
[6]
related
the
increase
in
SLA
to
improvement
in
the
capacity
of
leaves
to
inter-
cept
light.
Therefore,
the
morphological
acclimation
of
leaves
to
shade
conditions,
as
observed
in
this
study,
probably
explains
why
the
efficiency
of crowns
to
occu-
py
their
growing
space
was
not
affected
significantly
by
the
intensity
of
competition.
4.3.
Nutrients
Except
for
Ca,
foliar
nutrient
concentrations
for
the
three
crown
sections
were
close
or
even
superior
to
the
critical
levels
reported
by
Bernier
[2]
for
Populus
del-
toides,
which
were
20,
13,
22,
1.8
and
1.7
mg
g
-1
for
N,
K,
Ca,
Mg
and
P,
respectively.
However,
comparing
foliar
data
with
other
studies
must
be
done
with
caution
because
nutrient
contents
are
affected
by
several
factors
such
as
time
of
the
season
or
position
in
the
crown
[29]
or
clone
type
[2].
Thus,
the
values
reported
by
Bernier
[2]
must
be
considered
as
a
gross
indicator
that
competi-
tion
for
nutrients
was
not
important
in
any
of
the
spac-
ings.
Even
though
concentration
of
Ca
was
much
lower
than
the
critical
level
reported
by
Bernier
[2],
no
signifi-
cant
differences
were
obtained
(table
V).
The
significant
differences
obtained
for
P
in
sections
2
and
3
and
for
K
in
section
2
do
not
suggest
competition
for
nutrients
either.
In
fact,
the
relatively
lower
nutrient
concentra-
tions
in
the
1.5
m
spacing
relative
to
the
0.5
or
1.0
m
spacings
and
in
the
1.0
m
spacing
relative
to
the
1.5
m
spacing
probably
resulted
from
dilution
effects
associat-
ed
with
increase
in
biomass
[12,
36,
43,
48].
For
nutrient
concentration
in
stems,
significant
differences
were
obtained
between
the 0.5
m
spacing
and
the
1.0
and
1.5
m
spacings
for
N,
K
and
Mg.
Similarly
to
foliar
concen-
trations,
these
differences
are
relatively
small
in
absolute
values,
and
the
pattern
of
increase
with
decrease
in
spac-
ing
was
obtained,
also
suggesting
a
dilution
effect.
For
each
nutrient,
the
relatively
large
overlaps
between
the
confidence
limits
of
the
slopes
of
the
rela-
tionships
between
SLA
and
tree
nutrient
concentration,
suggesting
that
the
slopes
did
not
differ
significantly
among
spacings,
indicate
that
synergistic
interaction
of
leaf
nutrition
and
leaf
acclimation
did
not
take
place:
nutrient
use
efficiency
of
individual
trees
was
not
affect-
ed
by
competition.
These
results
provide
another
indica-
tion
that
competition
for
nutrients
was
not
important.
The
same
relationship
derived
in
other
studies,
but
with
nitrogen
only,
resulted
in
stronger
linear
relationships
[e.g.
34,
35,
42].
However,
these
trees
were
growing
under
controlled
conditions
without
competition
and
with
different
rates
of
fertilizer
applications
or
in
the
field
on
sites
characterized
by
different
fertility
levels.
Large
variations
in
tree
nutrient
concentrations
were
observed,
which
made
it
possible
to
highlight
the
strong
dependence
of
SLA
on
nutrient
content.
In
the
present
study,
relatively
small
variation
in
nutrient
content
of
individual
trees
within
each
spacing
existed,
in
addition
to
the
absence
of
differences
among
spacings.
Thus,
variation
in
SLA
resulted
principally
from
variation
in
light
conditions
as
crown
closure
occurred
and
intensi-
fied.
5.
Conclusions
The
culture
of
hybrid poplar
plantations
on
short
rota-
tion
has
accelerated
considerably
in
the
last
two
decades
in
North
America
and
Europe.
Several
forest
product
corporations
which
used
to
harvest
natural
forests
exclu-
sively
for
the
production
of
pulp,
paper
and
logs
are
now
investing
considerably
in
hybrid poplar
plantations.
The
economic
reality
of
these
corporations
requires
that
their
foresters
base
their
decisions
on
sound
and
adequate
bio-
logical
information
to
ensure
that
biomass
production
is
maximized
at
the
lowest
possible
cost.
This
goal
can
be
achieved
by
1)
selecting
the
appropriate
hybrid
for
a
given
site,
2)
increasing
biomass
production
per
unit
area,
3)
shortening
the
rotation
as
much
as
possible,
and
4)
improving
site
fertility
by
irrigation
and/or
application
of
fertilizers
or
residues
from
sewage
systems.
In
partic-
ular,
options
2
and
3
are
closely
related:
the
shorter
the
rotation,
the
closer
the
spacing
must
be
to
increase
the
economic
viability
of
intensively
managed
cultures.
While
much
research
has
been
devoted
to
the
compari-
son
of
the
productivity
of
many
hybrids
on
various
sites
and
to
the
effect
of
modifying
site
fertility,
less
attention
has
been
given
to
the
study
of
productivity
in
the
light
of
competition,
which
may
help
to
determine
an
optimal
spacing
and
reduce
the
rotation.
This
investigation
has
shown
that
competition
takes
place
quite
rapidly
in
hybrid
poplar
DN-74
stands,
par-
ticularly
in
the
closest
spacing.
Even
though
the
intensity
of
competition
increased
dramatically
as
spacing
was
decreased,
our
results
indicate
that
competition
occurred
only
at
the
crown
level:
it
resulted
in
diminishing
the
aerial
space
occupancy
of
crowns,
but
was
not
intense
enough
to
cause
a
significant
decrease
in
their
efficiency
to
occupy
their
growing
space,
in
the
uptake
rate
of
nutrients
and
in
nutrient
use
efficiency
(which
suggests
that
cultural
treatments
aiming
at
improving
site
fertility
might
be
useless
on
this
type
of
soil).
In
addition,
the
morphological
characteristics
of
the
foliage
changed
sub-
stantially
to
acclimate
to
reduced
light
conditions.
These
factors
probably
explain
why
this
hybrid
maintained
a
relatively
high
capacity
to
produce
biomass
per
unit
area
in
the
closest
spacing.
They
also
suggest
that
the
increase
in
competition
that
would
have
taken
place
if
the
rotation
had
been 2
or
3
years
longer
might
not
have
resulted
in
significant
negative
effect
on
productivity
per
unit
area.
Despite
the
fact
that
individual
tree
size
decreased
by
a
two-fold
factor
from
the
1.0
m
to
the 0.5
m
spacing,
stem
biomass
production
per
unit
area
nearly
doubled.
In
fact,
the
drastic
changes
observed
between
these
two
spacings
indicate
that
a
relatively
small
change
in
initial
spacing
may
result
in
substantial
differences
in
biomass
produc-
tion
per
unit
area.
For
instance,
even
a
0.75
m
spacing
would
result
in
substantially
greater
biomass
production
per
unit
area
than
a
1.0
m
spacing.
Acknowledgements:
The
assistance
of
Drs
J.
Baldock,
E.
Turcotte,
F.
McBain,
L.
Clark,
B.
Frederick
and
R.
Miller,
formerly
of
the
Petawawa
National
Forestry
Institute,
with
field
work
and
laboratory
analyses
is
greatly
appreciated.
Sincere
thanks
are
also
extended
to
Dr
G.
Robitaille,
Dr
F.
Bigras
and
Ms
M.
Bernier-
Cardou,
of
the
Laurentian
Forestry
Centre,
for
helpful
comments
in
the
review
of
the
manuscript
and
advice
on
statistical
analyses.
References
[1]
Abrams
M.D.,
Kubiske
M.E.,
Leaf
structural
character-
istics
of
31
hardwood
and
conifer
tree
species
in
central
Wisconsin:
influence
of
light
regime
and
shade-tolerance
rank,
For.
Ecol.
Manage.
31
(1990)
245-253.
[2]
Bernier
B.,
Nutrient
cycling
in
Populus:
a
literature
review
with
implications
in
intensively-managed
plantations,
Canadian
Forestry
Service,
ENFOR
Report
No. 6,
1984.
[3]
Brand
D.G.,
The
establishment
of
boreal
and
sub-boreal
conifer
plantations:
an
integrated
analysis
of
environmental
conditions
and
seedling
growth,
For.
Sci.
37
(1991)
68-100.
[4]
Burton
P.J.,
Bazzaz
F.A.,
Ecophysiological
responses
of
tree
seedlings
invading
different
patches
of
old-field
vegeta-
tion,
J. Ecol.
83
(1995)
99-112.
[5]
Ceulemans
R.,
Scarascia-Mugnozza
G.,
Wiard
B.M.,
Braatne
J.H.,
Hinckley
T.M.,
Stettler
R.F.,
Isebrands
J.G.,
Heilman
P.E.,
Production
physiology
and
morphology
of
Populus
species
and
their
hybrids
grown
under
short
rotation.
I.
Clonal
comparisons
of
4-year
growth
and
phenology,
Can.
J.
For.
Res.
22
(1992)
1937-1948.
[6]
Chen
H.Y.H.,
Klinka
K.,
Kayahara
G.J.,
Effects
of
light
on
growth,
crown
architecture,
and
specific
leaf
area
for
natu-
rally
established
Pinus
contorta
var.
latifolia
and
Pseudotsuga
meuziesii
var.
glauca
saplings,
Can.
J.
For.
Res.
26
(1996)
1149-1157.
[7]
Czapowskyj
M.M.,
Safford
L.O.,
Site
preparation,
fertil-
ization
and
10-year
yields
of
hybrid
poplar
on
a
clear-cut
forest
site
in
eastern
Maine,
USA,
New
For.
7
(1993)
331-344.
[8]
DeBell
D.S.,
Harrington
C.A.,
Productivity
of
Populus
in
monoclonal
and
polyclonal
blocks
at
three
spacings,
Can.
J.
For.
Res.
27
(1997)
978-985.
[9]
DeBell
D.S.,
Harrington
C.A.,
Clendenen
G.W.,
Zasda
J.C.,
Tree
growth
and
stand
development
of four
Populus
clones
in
large
monoclonal
plots,
New
For.
14
(1997)
1-18.
[10]
Dijkstra
P.,
Cause
and
effect
of
differences
in
specific
leaf
area,
in:
Lambers
H.,
Cambridge
M.L.,
Konings
H.,
Pons
T.L.
(Eds.)
Causes
and
Consequences
of
Variation
in
Growth
Rate
and
Productivity
of
Higher
Plants,
SPB
Academic
Publishing
bv,
The
Hague,
The
Netherlands,
1989,
pp.
125-140.
[11]
Ducrey
M.,
Variation
in
leaf
morphology
and
branch-
ing
pattern
of
some
tropical
rain
forest
species
from
Guadeloupe
(French
West
Indies)
under
semi-controlled
light
conditions,
Ann.
Sci.
For.
49
(1992)
553-570.
[12]
Finér
L.,
Nutrient
concentrations
in
Pinus
sylvestris
growing
on
an
ombrotrophic
pine
bog,
and
the
effects
of
PK
and
NPK
fertilization,
Scand.
J.
For.
Res.
7
(1992)
205-218.
[13]
Fisons
Instruments,
Instruction
manual
NA
2000
nitro-
gen
analyzer,
Fisons
Instruments,
Milan,
Italy,
1993.
[14]
Fitter
A.H.,
Hay
R.K.M.,
Environmental
Physiology
of
Plants,
2nd
ed.,
Academic
Press,
London,
UK,
1987.
[15]
Ford
E.D.,
The
control
of
tree
structure
and
productivi-
ty
through
the
interaction
of
morphological
development
and
physiological
processes,
Int.
J.
Plant.
Sci.
153
(1992)
S147-S162.
[16]
Gelhaye
D.,
Ranger
J.,
Bonneau
M.,
Biomasse
et
minéralomasse
d’un
taillis
à
courte
révolution
du
peuplier
Beaupré
installé
sur
un
sol
acide
hors
vallée,
amélioré
par
fer-
tilisation,
Ann.
Sci.
For.
54
(1997)
649-665.
[17]
Givnish
T.J.,
Adaptation
to
sun
and
shade:
a
whole-
plant
perspective,
Aust.
J.
Plant
Physiol.
15
(1988)
63-92.
[18]
Goldberg
D.E.,
Components
of
resource
competition
in
plant
communities,
in:
Grace,
J.B.,
Tilman,
D.
(Eds.),
Perspectives
on
Plant
Competition,
Academic
Press,
Inc.,
New
York,
USA,
1990,
pp.
27-49.
[19]
Gottschalk
K.W.,
Shade,
leaf
growth
and
crown
devel-
opment
of
Quercus
rubra,
Quercus
velutina,
Prunus
serotina
and Acer
rubrum
seedlings,
Tree
Physiol.
14
(1994)
735-749.
[20]
Hager
H.,
Sterba
H.,
Specific
leaf
area
and
needle
weight
of
Norway
spruce
(Picea
abies)
in
stands
of
different
densities,
Can.
J.
For.
Res.
15
(1985)
389-392.
[21]
Hambly
S.,
The
growth
of
hybrid poplar
in
Nelder
spacing
trials,
in:
Barkley
B.A.,
McVey
G.
(Eds.),
Poplar
Culture
to
the
Year
2000,
Proceedings
of
the
Poplar
Councils
of
the
United
States
and
Canada
joint
meeting.
College
of
Environmental
Science
and
Forestry,
Syracuse,
NY,
USA,
1987, pp. 63-73.
[22]
Heckrodt
W.F.,
Close
spaced
short
rotation
poplar
pro-
duction
using
paper
mill
sludge
as
mulch,
in:
Barkley
B.A.,
McVey
G.
(Eds.),
Poplar
Culture
to
the
Year
2000,
Proceedings
of
the
Poplar
Councils
of
the
United
States
and
Canada joint
meeting.
College
of
Environmental
Science
and
Forestry,
Syracuse,
NY,
USA,
1987,
pp.
85-93.
[23]
Heilman
P.E.,
Xie
F.,
Influence
of
nitrogen
on
growth
and
productivity
of
short-rotation
Populus
trichocarpa
x
Populus
deltoides
hybrids,
Can.
J.
For.
Res.
23
(1993)
1863-1869.
[24]
Hunt
R.,
Plant
Growth
Curves.
The
Functional
Approach
to
Plant
Growth
Analysis,
Edward
Arnold
Limited,
London, 1982.
[25]
Hunt
R.,
Basic
Growth
Analysis,
Unwin
Hyman
Ltd,
London, 1990.
[26]
Kalra
Y.P.,
Maynard
D.G.,
Methods
manual
for
forest
soil
and
plant
analysis.
Forestry
Canada,
Northern
Forestry
Centre,
Information
Report
NOR-X-319,
1991.
[27]
Klinka
K.,
Wang
Q.,
Kayahara
G.J.,
Carter
R.E.,
Blackwell
B.A.,
Light-growth
response
relationships
in
Pacific
silver
fir
(Abies
amabilis)
and
subalpine
fir
(Abies
lasiocarpa),
Can.
J.
Bot.
70
(1992)
1919-1930.
[28]
Kozlowski
T.T.,
Kramer
P.J.,
Pallardy
S.G.,
The
Physiological
Ecology
of
Woody
Plants,
Academic
Press,
Inc.,
New
York,
1991.
[29]
Kramer
P.J.,
Kozlowski
T.T.,
Physiology
of
Woody
Plants,
Academic
Press,
Inc.,
New
York,
USA,
1979.
[30]
Kuuluvainen
T.,
The
effect
of
two
growth
forms
of
Norway
spruce
on
stand
development
and
radiation
intercep-
tion:
a
model
analysis,
Trees
5
(1991)
171-179.
[31]
Lambers
H.,
Poorter
H.,
Inherent
variation
in
growth
rate
between
higher
plants:
a
search
for
physiological
causes
and
ecological
consequences,
Adv.
Ecol.
Res.
23
(1992)
187-261.
[32]
LI-COR,
Inc,
LI-3100
area
meter
instruction
manual,
LI-COR,
Inc.,
Lincoln
NE,
Publication
No.
7903-20,
1987.
[33]
LKB
Biochrom
Ltd,
Ultrospec
II
instruction
manual,
LKB
Biochrom
Ltd,
Cambridge,
UK,
1985.
[34]
McDonald
A.J.S.,
Phenotypic
variation
in
growth
rate
as
affected
by
N-supply:
its
effects
on
net
assimilation
rate
(NAR),
leaf
weight
ratio
(LWR)
and
specific
leaf
area
(SLA),
in:
Lambers
H.,
Cambridge
M.L.,
Konings
H.,
Pons
T.L.
(Eds.),
Causes
and
Consequences
of
Variation
in
Growth
Rate
and
Productivity
of
Higher
Plants,
SPB
Academic
Publishing
bv,
The
Hague,
The
Netherlands,
1989,
pp.
35-44.
[35]
McDonald
A.J.S.,
Lohammar
T.,
Ingestad
T.,
Net
assimilation
rate
and
shoot
area
development
in
birch
(Betula
pendula
Roth.)
at
different
steady-state
values
of
nutrition
and
photon
flux
density,
Trees
6
(1992)
1-6.
[36]
McKevlin
M.R.,
Hook
D.D.,
McKee
W.H.
Jr.,
Growth
and
nutrient
use
efficiency
of
water
tupelo
seedlings
in
flooded
and
well-drained
soil,
Tree
Physiol.
15
(1995)
753-758.
[37]
Mehlich
A.,
New
extractant
for
soil
test
evaluation
of
phosphorus,
potassium,
magnesium,
calcium,
sodium,
man-
ganese
and
zinc,
Commun.
Soil
Sci.
Plant
Anal.
9
(1978)
477-492.
[38]
Mitchell
A.K.,
Arnott
J.T.,
Effects
of
shade
on
the
mor-
phology
and
physiology
of
amabilis
fir
and
western
hemlock
seedlings,
New
For.
10
(1995)
79-98.
[39]
Ontario
Ministry
of
Natural
Resources,
New
forests
in
Eastern
Ontario.
Hybrid
poplar,
Ontario
Ministry
of
Natural
Resources,
Science
and
Technology
Series
Vol.
1,
1983.
[40]
Petersen
T.D.,
Ning
Z.,
Newton
M.,
Dynamics
of
size
structures
in
seedling
stands
of Fraxinus
mandshurica
in
north-
east
China,
Ann.
Bot.
66
(1990)
255-263.
[41]
Pöykkö
V.T.,
Pulkkinen
P.O.,
Characteristics
of
nor-
mal-crowned
and
pendula
spruce
(Picea
abies
(L.)
Karst.)
examined
with
reference
to
the
definition
of
a
crop
tree
ideo-
type,
Tree
Physiol.
7
(1990)
201-207.
[42]
Reich
P.B.,
Kloeppel
B.D.,
Ellsworth
D.S.,
Walters
M.B.,
Different
photosynthesis-nitrogen
relations
in
deciduous
hardwood
and
evergreen
coniferous
tree
species,
Oecologia
104 (1995) 24-30.
[43]
Righetti
T.L.,
Wilder
K.L.,
Cummings
G.A.,
Plant
analysis
as
an
aid
in
fertilizing
orchards,
in:
Westerman
R.L.
(Ed.),
Soil
Testing
and
Plant
Analysis,
3rd
ed.,
Soil
Science
Society
of America,
Inc.,
Madison,
USA,
1990.
pp.
563-601.
[44]
SAS
Institute
Inc.,
SAS/STAT®
user’s
guide,
Version
6,
4th
ed.,
Volume
2,
SAS
Institute
Inc.,
Cary,
NC,
USA,
1989.
[45]
Sprinz
P.T.,
Burkhart
H.E.,
Relationships
between
tree
crown,
stem,
and
stand
characteristics
in
unthinned
loblolly
pine
plantations,
Can.
J.
For.
Res. 17
(1987)
534-538.
[46]
Strobl
S.,
A
decade
of
clone-site
testing
in
eastern
Ontario,
in:
Barkley
B.A.,
McVey
G.
(Eds.),
Poplar
Culture
to
the
Year
2000,
Proceedings
of
the
Poplar
Councils
of
the
United
States
and
Canada
joint
meeting.
College
of
Environmental
Science
and
Forestry,
Syracuse,
NY,
USA,
1987, pp. 29-39.
[47]
Tucker
G.F.,
Hinckley
T.M.,
Leverenz
J.W.,
Jiang
S.M.,
Adjustments
of
foliar
morphology
in
the
acclimation
of
understory
Pacific
silver
fir
following
clearcutting,
For.
Ecol.
Manage.
21
(1987)
249-268.
[48]
van
den
Driessche
R.,
Relationship
between
spacing
and
nitrogen
fertilization
of
seedlings
in
the
nursery,
seedling
mineral
nutrition,
and
outplanting
performance,
Can.
J.
For.
Res.
14
(1984)
431-436.
[49]
Varian,
Spectra
AA-300/400
operation
manual,
Varian,
Mulgrave,
Australia,
1988.
[50]
Wang
J.R.,
Simard
S.W.,
Kimmins
J.P.,
Physiological
responses
of
paper
birch
to
thinning
in
British
Columbia,
For.
Ecol.
Manage.
73
(1995)
177-184.
[51]
Wang
Y.P.,
Jarvis
P.G.,
Influence
of
crown
structural
properties
on
PAR
absorption,
photosynthesis,
and
transpira-
tion
in
Sitka
spruce:
application
of
a
model
(MAESTRO),
Tree
Physiol.
7
(1990)
297-316.
[52]
White
A.S.,
Elliott
K.J.,
Predicting
the
effects
of
hard-
wood
competition
on
red
pine
seedling
growth,
Can.
J.
For.
Res.
22
(1992)
1510-1515.
[53]
Zedaker
S.M.,
Burkhart
H.E.,
Stage
R.S.,
General
prin-
ciples
and
patterns
of
conifer
growth
and
yield,
in:
Walstad
J.D.,
Kuch
P.J.
(Eds.),
Forest
Vegetation
Management
for
Conifer
Production,
John
Wiley
&
Sons,
New
York,
USA,
1987, pp. 203-241.