Báo cáo khoa học: "Estimating the foliage area of Maritime pine (Pinus pinaster Aït.) branches and crowns with application to modelling the foliage area distribution in the crown" pptx
Bạn đang xem bản rút gọn của tài liệu. Xem và tải ngay bản đầy đủ của tài liệu tại đây (358.76 KB, 14 trang )
Original article
Estimating the foliage area of Maritime pine
(Pinus pinaster Aït.) branches and crowns
with application to modelling the foliage area
distribution in the crown
Annabel Porté
a,*
, Alexandre Bosc
a
, Isabelle Champion
b
and Denis Loustau
a
a
INRA Pierroton, Station de Recherches Forestières, Laboratoire d'Écophysiologie et de Nutrition,
BP. 45, F-33611 Gazinet Cedex, France
b
INRA Laboratoire de Bioclimatologie, BP. 81, F-33833 Villenave d'Ornon, France
(Received 26 August 1998; accepted 4 October 1999)
Abstract – Destructive measurements of architecture and biomass were performed on 63 trees from three Pinus pinaster stands (5,
21 and 26 year-old) in order to determine the quantity and distribution of foliage area inside the crown. Allometric equations were
developed per site and needle age, which allowed to correctly calculate (
R
2
= 0.71 to 0.79) the foliage area of a branch, knowing its
basal diameter and its relative insertion height in the crown. Using these equations, we estimated total crown foliage area. A non-lin-
ear function of tree diameter and tree age was fitted to these data (
R
2
= 0.82 and 0.88). On the 5 and 26 year-old stands, we combined
the branch level models and the architectural measurements to develop probability functions describing the vertical and horizontal
foliage area distributions inside the crown. The parameters of the beta functions varied with needle and stand age, foliage being locat-
ed mostly in the upper and outer part of the crown for the adult tree, whereas it was more abundant in the inner and lower parts of the
crown in the 5 year-old trees. A simple representation of crown shape was added to the study, so that knowing tree age and diameter,
it could be possible to fully describe the quantity of foliage area and its localisation inside a maritime pine crown.
maritime pine / foliage area / foliage distribution / allometric relationship
Résumé
– Estimation de la surface foliaire de branches et de houppiers de Pin maritime (Pinus pinaster Aït.) et son applica-
tion pour modéliser la distribution de la surface foliaire dans le houppier.
Afin de déterminer la quantité et la distribution de la
surface foliaire dans un houppier de pin maritime, nous avons réalisé une analyse destructive de l'architecture et de la biomasse de 63
arbres issus de trois peuplements âgés de 5, 21 et 26 ans. Des équations allométriques par peuplement et année foliaire permettent de
calculer correctement (
R
2
= 0,71 à 0,79) la surface foliaire d'une branche connaissant son diamètre et sa hauteur relative d’insertion.
L’utilisation de ces équations a permis d’estimer la surface foliaire totale du houppier. Un modèle arbre correspondant à une fonction
puissance du diamètre de l’arbre et de l’inverse de son âge a été ajusté sur ces valeurs (
R
2
= 0,80 et 0,88). D’autre part, la combinai-
son des modèles branches et des mesures architecturales a permis de paramétrer des fonctions de type bêta, sur les sites de 5 et
26 ans, décrivant les distributions verticales et horizontales de la surface foliaire dans le houppier. Leurs paramètres variaient avec
l’âge du site et de la cohorte : le feuillage étant localisé dans la partie supérieure et extérieure du houppier chez les arbres adultes, et
davantage vers le bas et l’intérieur de la couronne des arbres de 5 ans. Une représentation simplifiée de la forme du houppier a été
ajoutée à l’établissement des profils de surface foliaire afin que la connaissance de l’âge et du diamètre à 1,30 m d’un pin maritime
suffisent à établir une description quantitative et qualitative de son feuillage.
pin maritime / surface foliaire / distribution foliaire / relations allométriques
Ann. For. Sci. 57 (2000) 73–86 73
© INRA, EDP Sciences 2000
* Correspondence and reprints
Tel. (33) 05 57 97 90 34; Fax. (33) 05 56 68 05 46; e-mail:
A. Porté et al.
74
1. INTRODUCTION
Appreciation of forest structure is determinant in
studying stand growth and functioning. In forestry, stand
structure mostly refers to the relative position of trees
and to stem and crown dimensions. However, estimating
the amount and the location of the tree foliage area is a
critical point in order to model its biological functioning
[17, 27, 40]. Since direct measurements of foliage distri-
bution are nearly impossible to perform in forest stands,
they have been replaced by sampling procedures. At the
stand level, the plant area index (including the projected
area of all aerial elements of the stand) can be assessed
from light interception measurements. However, such a
technique does not describe the foliage spatial distribu-
tion. Allometric relationships constitute an accurate tool,
many times used to estimate and predict the amounts and
the distributions of foliage or crown wood in trees [1, 3,
39]. Foliage distributions can be required in light inter-
ception models [40], and coupled to CO
2
, vapour pres-
sure and temperature profiles to determine canopy
carbon assimilation.
In the Landes de Gascogne Forest, a general drying
has been observed that resulted into a disappearing of
lagoons (1983-1995: –49%) and a lowering of the water
table level up to 44%. From these observations, scientists
raised a new problematic [18]: how can we maintain the
equilibrium of the Landes forest in terms of wood pro-
duction without exhausting the natural resources? To
enter such a question, we investigated upon the response
of Maritime pine to water availability in terms of prima-
ry production and growth. To overcome the problem of
duration which prevents from studying the whole life
cycle of a forest, scientists have been developing models.
Structure-function models provide a highly detailed
description of tree functioning but require numerous
parameters [6, 11, 19, 29, 31]. Pure statistical models are
based on data measurements and quite easy to handle but
they remain too empirical to be used as growth predic-
tors in a changing environment [20, 21, 37]. In between,
semi-empirical approaches were developed [1, 2, 23, 18]
that lay on quite rough hypothesis when compared to
real functioning. However, they permitted to describe
complex processes in a simple way, and to build growth
models sensitive to environmental conditions. As a nec-
essary first step in the semi-empirical and ecophysiologi-
cal modelling of Maritime pine (
Pinus pinaster Aït.)
growth in the Landes de Gascogne, we undertook the
determination of stand foliage area amount and distribu-
tion. Previous studies on Maritime pine partially solved
the problem [22]. First, they did not discriminate needles
according to their age, which is an important factor
regarding their physical and physiological characteristics
[5, 30]. Moreover, the study had only been done for a 16
year-old stand. Considering maritime pine, as the tree
gets older, branches sprung at the top of the crown lower
down. At the same time, they change their geometry and
their amount of surface area.
Therefore, the first objective was to develop equations
permitting to predict the needle area of a branch and of a
tree, whatever stand age could be. We worked on a
chronosequence of stands (5, 21 and 26 year-old stands)
considered to represent the same humid Lande maritime
pine forest at different ages. The second objective was to
model foliage distribution in the crown to supply infor-
mation to light interception and radiation use models that
were under construction in the laboratory. Foliage area
amounts were estimated using the developed allometric
equations and coupled to architectural crown measure-
ments in order to describe vertical and horizontal leaf
area density profiles.
2. MATERIAL AND METHODS
2.1. Stands characteristics
The study was undertaken on two stands located
20 km Southwest of Bordeaux, France (44°42 N, 0°46 W).
They had an average annual temperature of 12.5 °C and
receive annual rainfall averaging 930 mm (1951-1990).
The Bray and L sites were even-aged maritime pine
stands originating from row seeding, with an understorey
consisting mainly of Molinia (Molinia coerulea
Moench.). Stand characteristics are summarised in table
V. Since 1987, the Bray forest has been studied for water
relations, tree transpiration and energy balance [4, 5, 13,
14, 24].
2.2. Data collection
Caution: the term foliage area always refers to the all-
sided foliage area of the needles. Projected area only
appears in leaf area index (LAI, m
2
m
–2
) values and is
calculated by dividing all-sided area by (1 + π/2) which
correspond to a projection assuming needles to be semi-
cylinders. Symbols used are presented in table A1
(Appendix 1).
Similar studies were done in 1990 and 1995 on the
Bray site (21 and 26 year-old) and in 1997 on the L site
(5 year-old). On the Bray site, diameter at breast height
(DBH, cm, measured at 1.30 m high) was measured for
each tree of the experimental plot (table V, n = 3897 and
2920) whereas on the younger trees, only total height
could be measured. Trees were studied for architectural
and biomass measurements. In order to represent the
stand distribution, we sampled 19 trees in 1990 and
Maritime pine foliage area
75
14 trees in 1995, according to their diameter at breast
height (DBH, cm) and 30 trees in 1997 according to their
height. In winter time (late November to February) the
21 and 26 year-old trees were fallen carefully to min-
imise the damage to the crowns, and the 5 year-old trees
were pulled off the ground with a Caterpillar. The coarse
roots were studied for architectural measurements [7, 8]
and wood characteristics with regards to wind loading
[33, 34]. On the ground, the lengths (L, nearest 0.5 cm)
and the diameters (D, measured in the middle of the
growth unit, nearest 0.1 cm) of each annual growth unit
of the trunks were measured (figure 1). The diameter of
each living branch (D
10
, cm, measured at the nearest
0.01 cm, diameter at about ten cm from the bole) was
measured with an electronic calliper. Two branches per
living whorl were selected for more detailed measure-
ments (195 branches in 1990, 186 branches in 1995, 265
branches in 1997, for the stand). In 1995 and 1997,
detailed architectural measurements were done on each
sampled branch: branch length (L
b
), chord length (C),
insertion angle between chord and bole (α) were mea-
sured; lengths (L
j
) and diameters (D
j
, measured in the
middle of the growth unit) were obtained for all 2
nd
order
internodes (figure 1). Polycyclism of tree growth is an
important phenomenon during early growth [16].
Therefore, on younger trees, we paid attention to
describe this phenomenon: the first growth cycle of the
annual growth unit is named A, the second B, etc.
Branch analysis was done separately for each cycle
because from the 2
nd
cycle, growth tends to be less than
during the 1
st
annual flush. During all studies, one
branch per pair was randomly selected for determination
of foliage biomass. Branch foliage was separated into
compartments according to needle age, the 2
nd
order
internode on which it was inserted and its order of rami-
fication (figure 1). Needles located on the trunk were
entirely collected. Foliage was oven-dried at 65 °C for
48h and weighted. Ten needle pairs were randomly col-
lected, per needle age class (1 to 3 year-old), per whorl
and per tree, in order to determine their specific leaf area
(SLA, m
2
kg
–1
). The middle diameter and the length of
each needle was measured to calculate its area assuming
needles to be semi-cylinders. Their total dry weight
(oven-dried at 65 °C during 48 h) was measured, and
SLA calculated as the ratio of needles area per their
weight (m
2
kg
–1
). The foliage area of each compartment
was estimated multiplying its dry weight with the corre-
sponding SLA.
From November 1996 to January 1997, during an
independent study, a set of 108 branches was collected
from 10 trees (27 year-old) representative of the Bray
site DBH distribution. D
10
, total needle area per needle
age were measured and SLA values calculated and used
to estimate the branch foliage area, for one branch per
whorl. This additional data set was used for testing the
allometric relationships established in 1995 at the Bray
site.
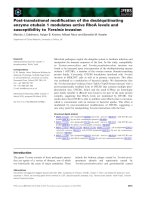
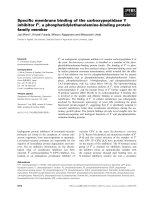
Figure 1. Diagram of a maritime pine presenting the detail of
the architectural measurements done on the sampled branches.
Branch length (
L
b
), chord length (C), bole-chord angle (α),
length (
L
j
) and diameter (D
j
) of each internode of the branch.
X
j
, X
j+1
, Y
j
, Y
j+1
are the co-ordinates of the ends of the intern-
ode. The total foliage area borne by the internode (2
nd
order)
and the 3
rd
order branches inserted on this internode was
assumed to be uniformly distributed along
L
jy
to determine the
vertical distribution of foliage area, and uniformly distributed
along
L
jx
for the horizontal distribution of foliage area.
A. Porté et al.
76
2.3. Statistical analysis
Various linear and non-linear regression models were
fitted to our data sets using the SAS software package
(SAS 6.11, SAS Institute Inc., Cary, NC, 1989-1995).
The choice of the final model was based on several crite-
ria: best fitting on the sample population (characterised
with adjusted R
2
values, residual sums of square, residual
mean square, F values of regressors, residual plots), the
biological significance of the variables used as regres-
sors, its simplicity (minimum number of regressors) and
its use as an estimating tool when extrapolating to the
total population. Multiple range tests were used to com-
pare mean values (Student Newman Keuls). Means with
the same letters are considered not to be significantly
different at the 5% tolerance level.
2.4. Distributions of foliage area density
This part of the work was completed on the 5 (L) and
26 year-old stands (Bray95). It was based on the follow-
ing assumptions: (i) The vertical and horizontal distribu-
tions of foliage area density are independent of each
other. (ii) The horizontal distribution of foliage area den-
sity is the same whatever the height in the crown.
For the horizontal profile, crown length was divided
into ten slices for the Bray site, three slices for the L site.
The lower and upper slices were omitted and the follow-
ing steps were made for each remaining slice. On each
slice, normalised distances (X
rel
) were measured, with a
length unit equal to the length of the slice radius, so that
X
rel
varied between 0 from the stem to 1 on the crown
periphery. Relative height (Ht
rel
) was defined with 0 at
the bottom of the crown, 1 at the top of the crown. We
considered that a branch was equivalent to a circular arc,
of length L, chord C, inserted with angle α, at the height
H, (Fig. 1) and constituted of j = 1 to n internodes. The
co-ordinates (X
j
, Y
j
) of both ends of each internode j
were calculated using the length measurements of the
internodes (L
j
). The orthogonal projection of internode j
(length L
j
) on the vertical axis was calculated as L
jy
=
Y
j+1
– Y
j
and its orthogonal projection on the horizontal
axis as L
jx
= X
j+1
– X
j
. To each point (X
j
, Y
j
) was associ-
ated a foliage area, LA
j
(needle age), equal to the sum of
the leaf area bear by the woody axes inserted on this
point (2
nd
to 4
th
order woody axes, needle age 1 to 3). It
was normalised to needle area density, NAD
j
, using the
estimated crown (or layer) foliage area estimated with
the allometric branch models. Finally, the normalised
foliage area was assumed to be distributed uniformly
along the normalised projection L
jx
or L
jy
.
The vertical and horizontal foliage area profiles were
fitted to a three or four parameters beta function (a4 can
be fixed to one according to the shape of the distribution)
using the non-linear procedure of the SAS software
package (SAS 6.11, SAS Institute Inc., Cary, NC, 1989-
1995): it calculated the minimum residual sum of least-
square using the iterative method of Marquardt.
NAD = a1 . y
a2
. (a4 – y)
a3
(1)
where y is the normalised dimension of the crown, either
Ht
rel
or X
rel
.
3. RESULTS
For each stand age, three needle age cohorts were
found on every tree, exceptionally four year-old needles
remained on some branches of the two oldest stands. On
the 5 year-old stand (L site), three year-old needles rep-
resented less than 1% of the total sampled leaf area,
therefore they were ignored in the distribution study.
One year-old needles represented 60% of the total needle
area (table I). For the 21 and 26 year-old stands (Bray 90
and 95), one year-old needles formed a smaller propor-
tion of the total area, with 42 and 48% respectively,
whereas three year-old needles reached 22 and 8% of the
total area, for each stand, respectively. Distribution of
leaf area according to the woody axis order of ramifica-
tion (table I) showed the strong contribution of 3
rd
order
branches (54%) to total leaf area for the older stand,
whatever the needle age was. On the contrary, it showed
the importance of 1
st
and 2
nd
order axis for the 5 year-old
stand (16 + 38 = 54%).
3.1. Branch-level foliage area model
The highest linear correlation between branch foliage
and branch characteristics occurred with the product
variable D
10
2
× Ht
rel
(R = 0.81 to 0.90) for the one year-
old needle of every stand, and for the two year-old nee-
dles of the two oldest stands. Squared D
10
and relative
height into the crown were the recurrent explicative vari-
ables strongly related to branch foliage area (F value cor-
responding to an error probability inferior to 0.001).
Some variables such as the length of the trunk growth
unit occasionally appeared as explicative variables of
branch foliage variability, but they demonstrated a low
significant effect and were highly specific of both the
needle and stand ages. The different models investigated
were either linear or non-linear relationships, with more
or less numerous variables and finally exhibited quasi-
equivalent fittings on the data (in terms of sum of
squares, residual mean squares, F and R
2
values) and
Maritime pine foliage area
77
similar residuals graphs (data not shown). The choice of
the final model lay on the facts that it demonstrated high
significant F values and equivalent residual mean
squares and residuals distributions when compared to the
others. The linear functions that were explored presented
indeed smaller residual mean squares than the final
model, but often produced negative values for small
diameter values. Therefore, linear models were not
appropriate since we aimed at using the final relationship
to estimate foliage area for diameters ranging 0 to 6 cm.
The final model matched also our requirements of (i)
being a simple and useful tool. It required only two vari-
ables, branch diameter and branch relative height in the
crown, which were non destructive measurements that
can be rapidly and easily obtained in any forest. It only
required three parameters which also facilitated its para-
meterisation compared to more complex models. (ii)
This model was still empirical but variables and parame-
ters had a biological significance: this point will be
developed in the discussion. The allometric model of
branch foliage retained corresponded to the following
equation:
BrLA(age i) = (a2.D
10
2
.Ht
rel
+ a3.D
10
2
)
a1
(2)
with BrLA(i) being branch leaf area of needle cohort of
age i (1 or 2 year-old) (table II). The final model residual
mean square ranged from 0.03 to 0.27 (m
2
)
2
, the best one
occurring for the two-year old needles area on the
youngest stand.
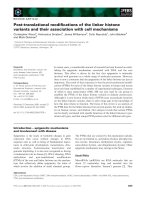
Figure 2 presents the branch foliage area calculated
using equation (2) versus the branch area data measured
on all three stands, for the one and two year-old needles.
For branch foliage area lower than 1 m
2
, variance on the
estimates was large comparatively to the estimated
value, whereas between 1 and 2.5–3 m
2
, the fittings were
very satisfying. Then at the upper end of the range (over
3 m
2
), the model resulted in slightly underestimating the
biggest branch area. The model was a little better for the
two year-old needles (figure 2, R
2
= 0.76). As a whole,
the models explained 71 and 76% of the branch needle
area variability. The use of one single branch model for
the three stands altogether (table II) gave as satisfying
fittings on the whole set than when using separate fit-
tings for each stand. But looking at each stand separate-
ly, it resulted in overestimating the needle area of the
younger stand branches and underestimating the branch
area of the older stand. Different fittings for each site
were then elected as the more adapted models (table II).
No clear tendency in the parameters (a1, a2, a3) could
be driven out of the study. Parameter a3 tended to
increase with stand age whereas parameter a2 tended to
decrease regularly for both needle ages. Parameter a1
tended to increase with stand age for the younger needles
and no tendency appeared for the two year-old needles.
Neither of these differences between site was significant.
Table I. Distribution of the measured foliage area according to the order of the bearing axis (1 = trunk, 2 = branch, 3 = branch on the
branch etc.) and to needle age, in percent of the total measured area. Specific leaf area values (SLA, m
2
kg
–1
) per needle age. Values
in parenthesis are standard deviations of the mean values. Values with the same letter are not significantly different (α = 0.05).
Needle age
Stand Order 3 year-old 2 year-old 1 year-old all
Foliage area 5 year-old stand 1 0.45 5.45 10.00 15.90
(%) (L) 2 0.22 13.52 23.88 37.62
3 0.25 17.44 25.75 43.44
4 0 1.88 1.15 3.03
all 0.92 38.30 60.78 –
21 year-old stand all 21.51 36.68 41.81 –
(Bray 90)
26 year-old stand 1 0.21 2.38 2.69 5.27
(Bray 95) 2 1.73 12.31 14.34 28.39
3 5.48 23.35 25.56 54.39
4 0.81 5.56 5.58 11.95
all 8.23 43.60 48.17 –
SLA 5 year-old stand – – 9.11
b
8.68
b
–
(1.58) (1.48)
(m
2
kg
-1
) 26 year-old stand – 6.57
a
6.82
a
7.69
a
–
(0.81) (1.33) (1.55) –
A. Porté et al.
78
For the two older stands, three year-old needle area
was hardly related to tree characteristics. Indeed, the
strongest correlation occurred with branch diameter but
it only explained a small part of the variability encoun-
tered (R = 0.36 for the 26 year-old stand, 0.70 for the 21
year-old stand). As we could not find any satisfying allo-
metric model, we decided to set the three year-old needle
area equal to its proportion in the total needle area of the
sampled branches (table I).
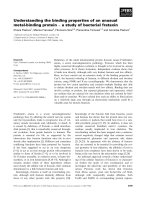
To check the allometric equations that we established
on the 26 year-old stand data set (table II), we applied
them to estimate the needle area of branches collected on
27 year-old maritime pines. Figure 3 presents the esti-
mated foliage area versus the measured foliage area of
these branches. The fittings were satisfying, performing
slightly better for the two year-old needles (slopes equal
to 1.04, R
2
= 0.81 for the two year-old needles, R
2
= 0.72
for the one year-old needles). As a consequence of the
high variability in needle fall, the 3 year-old needles
could not been estimated.
3.2. Crown level foliage area
The total crown foliage area (CrLA(i), with i = needle
age) of each sampled tree was estimated using the
branch level models developed for each stand (Eq. 2).
Values ranged from 1.4 m
2
to 56.17 m
2
for the 5 year-old
trees, from 14.45 m
2
to 93.45 m
2
for the 21 year-old
trees, and from 41.26 m
2
to 174.95 m
2
for the 26 year-
old trees (table III). The three year-old needle area was
corresponding to mean values of 0.89, 17 and 7% of the
total area for the 5, 21 and 26 year-old trees, whereas the
one year-old needles accounted for 59.8, 45.2 and 49.8%
of the total foliage area for the 5, 21 and 26 year-old
trees. The ratio of total crown leaf area to sapwood area
under the living crown was ranging between 0.27 and
0.89 m
2
cm
–2
for all three stands. It was significantly
higher for the younger stand (table III).
Linear and non-linear models were tested on each
stand separately, and on all three stands together. The
best model to estimate crown foliage area corresponded
to a non-linear function of tree diameter and tree age:
(3)
with CrLA(
i) being the crown leaf area of the needle
cohort of age i (1 or 2 year-old) (table IV), D corre-
sponding either to the diameter at breast height (DBH) or
the diameter under the living crown (DLC). No other
variables such as tree height or crown length were signif-
icant. The model was significantly different with needle
age, but not with stand age. The use of diameter at breast
height (or diameter at the tree basis for the L stand),
instead of diameter under the living crown, resulted in
equivalent fittings on the data (data not shown).
Therefore DBH was preferred to DLC since it is much
easier to measure at the stand level.
Figure 4 presents the crown foliage area estimated
with the model described in equation (3), and parame-
terised on the three stands altogether, versus the crown
area calculated using the branch level models developed
CrLA(age
i
)=
b
1.
D
b
2
treeage
b
3
Table II. Parameters of the model selected to estimate individual branch foliage area by needle age (1 or 2 year-old) as a function of
branch dimensions and relative height in the canopy. BrLA(
i) = (a1 * D
10
2
* ht
rel
+ a2 * D
10
2
)
a3
, with BrLA(i), branch foliage area of
needle age
i, D
10
, branch diameter at ten cm from insertion (cm), Ht
rel
, relative height of insertion of the branch in the crown (0 = bot-
tom of the crown, 1 = top of the crown). Polycyclism code is defined as A = first cycle of the year, all = all cycles mixed. Numbers in
parenthesis indicate the asymptotic standard error on the estimate.
Parameter
Stand Needle age Polycyclism a1 a2 a3 RMS
*
Bray 95 1 year-old A 0.235 (0.019) 0.031 (0.005) 1.290 (0.082) 0.27
2 year-old A 0.153 (0.014) 0.051 (0.004) 1.319 (0.085) 0.20
Bray 90 1 year-old A 0.325 (0.025) 0.039 (0.007) 1.112 (0.079) 0.11
2 year-old A 0.221 (0.017) 0.065 (0.005) 1.335 (0.081) 0.09
L 1 year-old all 0.614 (0.036) 0.051 (0.013) 1.102 (0.061) 0.05
2 year-old all –0.232 (0.044) 0.243 (0.016) 0.936 (0.071) 0.03
L + Bray 95 + Bray 90 1 year-old all 0.348 (0.017) 0.030 (0.005) 0.881 (0.031) 0.15
2 year-old all 0.194 (0.013) 0.061 (0.004) 0.994 (0.038) 0.13
*RMS, residual mean square.
Maritime pine foliage area
79
for each stand. Fittings were very satisfying, for both
needle age, with slopes close to 1 and R
2
greater than
0.80.
Simple models were also developed in order to rapid-
ly estimate crown length and crown maximum radius
(table IV). Crown dimensions were directly related to
DBH, without any difference among the stands.
However, the model performed better for crown length
(CrLgth) than for crown maximum radius (CrRad). On
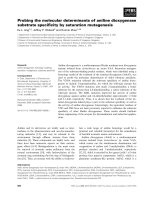
figures 5A and B, each measured co-ordinates (X
j
, Y
j
)
were standardised and plotted altogether, for the 26 and
5 year-old stands. A 4-degree polynomial function was
used to describe the data envelope curve; it corresponded
to the standardised shape of 5 and 26 year-old maritime
pine crowns. The main difference appeared between the
stands: maximum radius appeared lower in the crowns of
26 year-old trees (0.25–0.40 of relative height) and it
was more variable and located upper inside the crowns
of the 5 year-old trees (0.35–0.60 of relative height).
Within one stand, crown shapes could be differing con-
secutively to one particular branch position, but globally
remained within the same dimensional limits and could
be considered equivalent from one tree to another.
3.3. Stand level foliage area
The stand LAI was calculated by dividing the stand
foliage area by the stand area. For the 21 and 26 year-old
stands, stand foliage area was calculated as the sum of
the leaf area of each tree; the latter was estimated by
Figure 2. Estimated branch needle area versus measured
branch needle area, in m_. (A) Points correspond to data of the
three stands, lines to linear adjustments on the points.
Estimations were done with the branch level models adjusted
on each stand separately. (B) Points correspond to the valida-
tion data set from the 27 year-old stand, lines to linear adjust-
ments on the points. One year-old needles (
ο) , ( ). Two year-
old needles (
■), (). The broken line () corresponds to
the equation
Y = X.
Figure 3. Tree needle area estimated with the crown level
models (
table IV, with DBH and age) versus “measured” tree
needle area in m
2
. The “measured” values correspond to the
estimations of tree needle area using the branch models pre-
sented in
table III. Points correspond to data of the three
stands, lines to linear adjustments on the points: 1 year-old nee-
dles = (
ο) , ( ); 2 year-old needles = (■), (). The broken
line (
) corresponds to the equation Y = X.
A. Porté et al.
80
applying equation (3) with DBH as an explicative vari-
able. For the 5 year-old stand, this method could not
been used since we did not have diameter measurements
for every tree. We simply multiplied the leaf area of each
sampled tree by the number of trees in its class, and
summed the 30 values to calculate the stand foliage area.
Table V presents the LAI values for each cohort and
stand, and the total developed LAI (all-sided leaf area
index). There was only a slight difference between the
two older stands (+ 3%), but the 5 year-old stand had a
much lower LAI (–40%).
3.4. Vertical and horizontal distributions
of foliage density
This part of the work could not been performed on the
Bray site in 1990 because the adequate architectural
measurements were not measured by then. Figure 6
shows the vertical needle area density probability func-
tions for both stands (26 year-old Bray site, 5 year-old L
site) together with the measured values (bars). The verti-
cal distributions of the one year-old needle density were
similar for both stands. Most of the one year-old needle
area density was located in the top third of the crown. On
the opposite, the vertical distribution for the two year-old
needles differed between the two stands, the foliage den-
sity being mainly located in the upper part of the crown
for the 26 year-old stand, and mainly in the lower part of
the crown for the 5 year-old stand. On the older stand,
the three year-old NAD probability function was also
Table III. Crown foliage area (CrLA, m
2
) estimated using the branch level models presented in table I, and ratio of crown foliage
area to sapwood area at the base of the living crown (m
2
cm
–2
) according to the needle and the stand ages. Means are calculated on
14, 19 and 30 values for the Bray site in 1995, in 1990 and the L site, respectively. Means with the same letter are not significantly
different (α = 0.05).
Estimated crown foliage area
Stand Needle age mean SD min max
CrLA Bray 95 1 year-old 50.89 22.79 20.98 86.74
(m
2
) 2 year-old 44.08 20.19 17.21 75.25
3 year-old 7.60 3.44 3.06 12.96
Bray 90 1 year-old 25.60 10.77 7.08 40.78
2 year-old 22.46 10.47 4.96 37.09
3 year-old 9.61 4.24 2.41 15.57
L 1 year-old 17.78 6.97 0.89 33.51
2 year-old 12.13 5.35 0.51 24.08
3 year-old 0.27 0.11 0.01 0.51
Ratio CrLA / Bray 95 – 0.42
a
0.07 0.31 0.58
sapwood area Bray 90 – 0.39
a
0.07 0.27 0.50
(m
2
cm
–2
) L – 0.59
b
0.13 0.37 0.81
Figure 4. Relative crown radius as a function of relative height
into the crown. (A) for the 26 year-old stand. (B) for the
5 year-old stand. Closed circles correspond to each measured
point (
X
j
, Y
j
) standardised according to crown length and maxi-
mum radius, for all branches and trees together. The solid line
represents the boundary curve on the measured points, of corre-
sponding equation written on the graph.
Maritime pine foliage area
81
Table IV. Parameters of the non linear models estimating individual crown foliage by needle age class (1, 2 or 3 year-old) and crown
dimensions as a function of tree dimensions. The model for foliage area is CrLA (
i) = b1 * D
b2
/ age
b3
, with CrLA(i), crown leaf area
of age
i; age, stand age in year; D either DLC, diameter under the living crown, in cm or DBH, diameter at breast height (1.3 m), in
cm. The model for crown dimensions is CrL =
b1 * D
b2
, with CrL either CrLgth, crown length (m) or CrRad, crown maximum radius
(m). Numbers in parenthesis indicate the asymptotic standard error on the estimate.
Variable Diameter Model parameters RMS*
cm b1 b2 b3
CrLA (1) DLC 0.312 (0.093) 2.204 (0.185) 0.404 (0.103) 52.11
DBH 0.546 (0.167) 2.508 (0.245) 1.180 (0.186) 64.85
CrLA (2) DLC 0.148 (0.043) 2.295 (0.171) 0.293 (0.101) 31.70
DBH 0.234 (0.070) 2.708 (0.226) 1.160 (0.176) 37.26
CrLA (3) DLC 17.588 (1.475) 1.895 (0.267) 1.895 (0.267) 4.28
DBH 7.854 (0.418) 2.308 (0.297) 2.308 (0.297) 3.88
CrLgth DBH 0.853 (0.074) 0.629 (0.029) – 0.280
CrRad DBH 0.106 (0.019) 0.861 (0.059) – 0.052
*RMS = residual mean square.
Figure 5. Vertical probability function of needle area density (NAD) as a function of relative height inside the crown (0 = bottom,
1 = top). (A) 26 year-old stand (B) 5 year-old stand. Bars correspond to the data estimated with the branch models, solid lines corre-
spond to the beta fittings. Top graphs correspond to the one year-old needles, middle graphs to the two year-old needles, bottom
graphs to the three year-old needles.
A. Porté et al.
82
calculated: it was less asymmetric and most of the NAD
was located at the middle of the crown (mid- relative
height). On both stands, it appeared that the beta distrib-
utions (full line) fitted well on the foliage density data
(histogram). Parameters varied with stand and needle
age. The beta function used four parameters (a4 > 1, top
of the crown) since there were needles up to the top of
the crown. All parameters were significantly different
from zero (table III).
The horizontal probability functions of foliage density
are presented in figure 7. Density distributions differed
little between the one and two year-old needle cohorts
(parameters in table III) but were changing between the
younger and the older stand. The younger trees foliage
density was symmetrically distributed along the radius of
the crown (one year-old needles) or even located nearer
to the trunk (two year-old needles) whereas on the 26
year-old pines, it was located on the outer shell of the
crown (66% of the NAD between 0.65 – 0.95 of relative
radius). In the older trees, the three year-old NAD proba-
bility function (figure 7A) was symmetrical in the crown
and centred around 0.5 relative radius. The horizontal
profiles were well described using a 4 parameters beta
function, allowing a non-zero value of the lower bound
for the younger trees, and an upper bound greater than 1
for the 26 year-old trees.
4. DISCUSSION
The relationship that we obtained between branch
foliage area and sapwood area at branch base (or D
10
2
) is
a classical result. Most studies attempting to develop
equations to calculate branch foliage weight or area
underlined a strong relationship between branch foliage
and branch diameter or sapwood area [3, 10, 12, 15, 22,
25]. The positive correlation between foliage and sap-
wood area was expected: it corresponds to the equilibri-
um between sap-flow conducting area and transpiring
surfaces [26, 35]. Some of the studies concluded to the
sufficiency of diameter or sapwood area alone to explain
the variability of branch foliage [22] but they did not
take into account the fact that in coniferous trees,
branches are still increasing in diameter while ageing but
not always in foliage biomass. Similarly, they ignored
the discrepancy that exists between the foliage area
borne by a young branch situated at the top of the
canopy and the one borne by an older branch of the same
diameter located in lower parts of the tree crown.
Therefore, it was important to take into account that for a
given branch diameter, branch foliage area decreased
with increasing depth into the crown. Our use of the
interaction between square diameter and relative height
into the crown as an explicative variable improved con-
siderably the leaf area predictions. The necessity of
introducing the relative height into the crown was also
underlined for other coniferous species like
Pseudotsuga
menziesii
[15], Pinus taeda [3, 12], Tsuga heterophylla
and Abies grandis [15]. However, the exact shape of the
relationship was less consensual and varied from linear
[10, 41] to non-linear relationships [12, 22, 28], through
log transformed relationships [15, 22]. The non-linear
equation presented in this paper participates to this diver-
sity. The form of the selected model allowed to describe
two phenomena. First, branch foliage was not only relat-
ed to branch characteristics but also to trees and stands
Table V. Summary of the stands characteristics and LAI (leaf area index) per stand and needle age as calculated using the crown
level leaf area model with DBH and age as independent variables. LAI corresponds to the projected leaf area (m
2
) per unit ground
area (m
2
). Developed LAI is all-sided leaf area per unit ground area (m
2
m
–2
). Values in parenthesis are standard errors of the mean.
L Bray 90 Bray 95
Stand area (ha) 7 16 16
Plot area (ha) 5.51 4.70 4.70
Age (year) 5 21 26
Stocking density (stem ha
–1
) 1178 829 621
Mean DBH (cm) – 21.02 (3.97) 26.03 (4.74)
Basal area (–) – 29.80 34.16
Mean height (m) 3.19 (0.43) 13.88 (1.01) 17.63 (1.21)
Sample size (tree) 30 19 14
LAI 1 year-old (m
2
m
–2
) 0.81 1.14 1.11
2 year-old (m
2
m
–2
) 0.56 0.96 0.99
3 year-old (m
2
m
–2
) – 0.30 0.22
LAI total (m
2
m
–2
) 1.37 2.40 2.32
Developed LAI (m
2
m
–2
) 3.52 6.17 5.96
Maritime pine foliage area
83
particularities: the use of a power function over the vari-
able D
10
2
× Ht
rel
allowed us to adjust to the non exact
correspondence between branch dimensions and branch
foliage. Second, the larger foliage area observed on simi-
lar branches of the younger stand was certainly a conse-
quence of the open canopy which allowed branch devel-
opment between the tree lines, whereas the 21 and 26
year-old stands presented closed canopies. The changing
in the parameters from one site to another (table II)
allowed to describe the increasing gradient in foliage
area for a same value of the variable D
10
2
× Ht
rel
from
the older to the younger stand.
The major drawback of our branch models was the
under-estimation of calculated foliage area for the largest
values of our range because these branches represented a
large part of total crown leaf area. This bias in the model
resulted partly from the data set: the larger leaf areas
were corresponding to the biggest branches located at the
bottom of the crown. However, on old branches, needle
loss can be observed consecutively to the breaking (nat-
ural and/or consecutive to tree fall) of 3
rd
order branches
resulting in biased branch biomass measurements and to
an unsatisfying estimation of larger foliage area. Finally,
the use of the branch foliage model developed on the
26 year-old stand (figure 3) to estimate independent
values of needle area measured on 27 year-old tree
branches validated our model.
The loss of most of the three year-old needles certain-
ly explained the difficulty to achieve a good allometric
model for this cohort. Indeed, intra-annual litter falls
measurements undertaken in our laboratory indicated
important differences in the amount of needles fallen
from one year to another, and consequently in the
amount of old needles remaining on the trees. Annual
variations in weather and particularly in water stress
Figure 6. Horizontal probability function of needle area density (NAD) as a function of relative radius inside the crown (0 = trunk,
1 = outer shell). (A) 26 year-old stand (B) 5 year-old stand. Bars correspond to the data estimated with the branch models, solid lines
correspond to the beta fittings. Top graphs correspond to the one year-old needles, middle graphs to the two year-old needles, bottom
graphs to the three year-old needles.
A. Porté et al.
84
were showed to highly influence old-needle senescence
[9, 32, 38] in Pinus radiata and Pinus taeda.
At the tree level, the use of diameter at breast height
to estimate tree total foliage area was widespread [3, 10,
22]. However, the use of diameter or sapwood area under
the living crown was also investigated [12, 17, 22, 26,
36]: they confirmed our result that DLC performed better
than DBH. However, the ratio of crown leaf area to sap-
wood area under the living crown (table III) was site-
specific and so it could not been used alone as an estima-
tor of leaf area. Margolis et al. [26] explained that it
corresponded to the limitations of allometric relation-
ships and to the point where introducing a description of
the hydraulic functioning of the tree would produce
superior models. Though, the originality of our study
was to show that although stocking densities and/or silvi-
cultural history were quite different between the stands,
very young pines and adult pines foliage behave in the
same way (figure 4). The power function of tree age,
which was introduced in the model, reflected that for a
same DBH, younger trees presented larger crown foliage
area. This parameter can be regarded as a stand vigour
index. The LAI calculated on the 26 year-old stand using
these equations was consistent with the PAI (plant area
index) values obtained with light intercepting devices on
the same stand (3.10, measurement done in early
November 1995, Berbigier personal communication,
2.68–3.67 in 1991-1993 [4], 3–3.04 from July to October
1995 [14]). The higher PAI values could be attributed to
the fact that light transmission through the canopy result-
ed not only from the foliage area but also from the
woody parts of the crown. The LAI values (table V)
matched with the bottom of the range indicated by Vose
et al. [38] on different Pinus trees (developed LAI from
2.8 to 18.5), but they remained consistent with maritime
pine sparse crown. The low value of LAI on the 5 year-
old stand was a consequence of the open canopy: at least
half of the stand area was still uncovered by pines.
Concerning the crown structure models, it was devel-
oped as a rapid and useful tool to estimate crown dimen-
sions which are requirements, as well as NAD functions,
if one wants to obtain leaf area density profiles in tree
crowns. A more complete and detailed analysis of crown
structure still remains necessary to obtain a better tool.
The choice of a beta function to describe needle area
density probability functions was borrowed to the MAE-
STRO model and finally fitted well the data, both for
horizontal and vertical profiles (
figures 6, 7), provided
that the function was not forced to be bounded between 0
and 1. Indeed, consequent foliage amounts were located
on the limiting shell of the crown or close to the trunk
for the younger trees and a 3-parameter function would
have imposed the absence of foliage on both limits. It
was already demonstrated that before canopy closure, the
vertical foliage distribution was skewed downward and
that it was skewed upward after canopy closure [38].
This can explain the differences in vertical profiles
between the 5 and the 26 year-old trees. The shift
towards the top of the crown observed for younger nee-
dles was quite characteristic of the coniferous growth
pattern which approximately corresponded to an upward
translation. Such a translation of the foliage amounts was
observed between smaller and bigger Douglas-fir trees
[25], between younger and older needle cohorts of Pinus
radiata [39]. The gap between the one and two year-old
NAD probability functions was more important for the
5 year-old stand, consecutively to the conjunction of a
huge annual growth rate of the young tree (mean =
80 cm year
–1
, SD = 29, max = 175 cm year
–1
, min =
20 cm year
–1
) with the absence of crown recession (a
consequence of the still open canopy). A similar phe-
nomenon explained the shape of the horizontal profiles:
the rhythmic growth of the branches resulted in the off-
set location of foliage density for the older trees, since
2
nd
order needles (29% of one and two year-old needle
area) were located on the tips of the branches and 3
rd
order needles (53%) were mainly located on the younger
whorls of the branch. On the contrary, the consequent
contribution of trunk foliage (15%, versus 5% for older
trees) and 2
nd
order foliage (37%) contributed to main-
tain a high NAD closer to the trunk for the 5 year-old
trees. However, we must note that the horizontal NAD
probability profile was partly biased by the representa-
tion of branch shape using a circle arc: this regular shape
drifted the central part of the branch towards the shell of
the crown and consequently pulled leaf area away from
the centre of the crown. This bias was all the more visi-
ble than a branch was long and old; therefore this phe-
nomenon particularly affected the 26 year-old trees NAD
profiles.
5. CONCLUSION
The present work successfully achieved the study of
leaf area amounts and distributions in winter time (late
November- early February) in the humid part of the
Landes de Gascogne Forest, for different Maritime pine
stand ages. The equations presented in this paper were
specifically developed to locate the foliage area inside
the crown together with its quantification. They enabled
the estimation of leaf area for each needle cohort and for
trees ranging from 5 to 26 year-old, at the branch, the
tree and the stand level. However, we were forced to
chain successive equations at the different scales, accu-
mulating statistical errors at each step. To calculate these
errors, it would need further consequent studies to
solve complex matrices systems (Huet, personal
Maritime pine foliage area
85
communication). These estimations combined with
architectural measurements led to a description of
foliage density probability functions inside the crown
(adapted for 5 and 26 year-old stands). It could be com-
pleted by an intermediate stand to obtain a similar evolu-
tion with stand age than the one obtain concerning tree
foliage area.
However, all these results corresponded to the winter-
time state of the trees: a dynamic study of foliage burst,
growth and death should be undertaken to investigate
intra-annual foliage variations. By now using the results
presented in this paper, we can estimate crown dimen-
sions and crown foliage area by needle age class from
tree age and diameter at breast height. Then we can
describe foliage location inside the crown using the
probability functions of foliage density. These can be
used to parameterise crown structural modules of light
interception models [39] and to model carbon assimila-
tion. They were used on Maritime pine to be part of a
structure-function model that described the main primary
production processes [6].
Acknowledgements: The authors thanks warmly N.
Yahaya, A. Vinueza, F. Vauchel, P. Trichet, M. Sartore,
E. Pegoraro, L. Maleyran, H. Lataillade, A. Lardit, C.
Lambrot, F. Lagane, B. Issenhuth, M. Guédon, F.
Danjon, J.P. Chambon, D. Bert, V.M. Bernard who took
their turn to collect the different data sets. This work was
supported by the European projects Euroflux and
LTEEF-2, and the French project GIP-ECOFOR
“Landes 2”. The Bray site was used by courtesy of the
Company “France-Forêts”.
REFERENCES
[1] Bartelink H.H. a, A model of dry matter partitioning in
trees, Tree. Physiol. 18 (1998) 91-101.
[2] Bartelink H.H. b, Simulation of growth and competition
in mixed stands of Douglas-fir and beech, Ph.D. Thesis
Landbouwuniversiteit Wageningen, Pays-Bas (1998) p. 222.
[3] Baldwin Jr. V.C., Peterson K.D., Burkhart H.E.,
Amateis R.L., Dougherty P.M., Equations for estimating
loblolly pine branch and foliage weight and surface area distri-
butions, Can. J. For. Res. 27 (1997) 918-927.
[4] Berbigier P., Bonnefond J.M., Measurements and mod-
elling of radiation transmission within a stand of maritime pine
(
Pinus pinaster Aït.), Ann. Sci. For. 52 (1995) 23-42.
[5] Berbigier P., Loustau D., Diawara A., Étude microcli-
matique de l'effet de la sécheresse sur l'évaporation d'une plan-
tation de Pin maritime à sous-bois de Molinie, Ann. Sci. For.
48 (1991) 157-177.
[6] Bosc A., Étude expérimentale du fonctionnement
hydrique et carboné des organes aériens du Pin maritime
(Pinus pinaster Aït) : intégration dans un modèle Structure-
Fonction appliqué à l’analyse de l’autonomie carbonée des
branches de la couronne d’un arbre adulte, Thèse de
l’Université de Bordeaux II, (1999) pp. 192.
[7] Danjon F., Bert D., Godin C., Trichet P., Structural root
architecture of 5-year-old
Pinus pinaster measured by 3D digi-
tising and analysed with AMAPmod, in Stokes A. (Ed.), Proc.
Conf. “The supporting roots, Structure and Function”, 2 - 24
July 1998, Bordeaux, France, 1999, in press.
[8] Danjon F., Sinoquet H., Godin C., Colin F., Drexhage
M., Characterisation of the structural tree root architecture
using 3D digitising and the AMAPmod software handling plant
architecture, Plant and Soil 211 (2) (1999) 241-258.
[9] Dougherty P.M., Whitehead D., Vose J.M.,
Environmental influences on the phenology of pine, Ecol. Bull.
43 (1994) 64-75.
[10] Dvorak V., Oplustilova M., Janous D., Relation
between leaf biomass and annual ring sapwood of Norway
spruce according to needle age-class, Can. J. For. Res. 26
(1996) 1822-1827.
[11] Fourcaud T., Blaise F., Reffye (de) P., Houllier F.,
Barthélémy D., Plant growth simulation based on ecophysio-
logical processes. Influence of architectural on tree growth,
Poc. Plant Biomechanics 1 (1997) 331-336.
[12] Gillespie A.R., Allen H.L., Vose J.M., Amount and
vertical distribution of foliage in young loblolly pine trees as
affected by canopy position and silvicultural treatment, Can. J.
For. Res. 24 (1994) 1337-1344.
[13] Granier A., Loustau D., Measuring and modelling the
transpiration of a maritime pine canopy from sap-flow data,
Agric. For. Meteorol
. 71 (1994) 61-81.
[14] Hassika P., Berbigier P., Bonnefond J.M.,
Measurement and modelling of the photosynthetically active
radiation transmitted in a canopy of maritime pine, Ann. Sci.
For. 54 (1997) 715-730.
[15] Kershaw Jr. J.A., Maguire D.A., Crown structure in
western hemlock, Douglas-fir, and grand fir in western
Washington: trends in branch-level mass and leaf area, Can. J.
For. Res. 25 (1995) 1897-1912.
[16] Kremer A., Déterminisme génétique de la croissance
en hauteur du Pin maritime (
Pinus pinaster Aït.). I. Rôle du
polycyclisme, Ann. Sci. For. 38 (2) (1981) 199-222.
[17] Landsberg J.J., Stand structure and microclimate,
in: Milthorpe F.L. and Snaydon R.W. (Eds.), Physiological
ecology of forest production, Ac. Press Inc., London, 1986,
pp. 32-67.
[18] Laroussinie O., Introduction aux contributions sur les
bases biologiques et physico-chimiques de la gestion durable
des Landes de Gascogne, in : De la forêt cultivée à l'industrie
de demain, Actes du 4
ème
Colloque Arbora, 20-21, novembre
1997, pp. 1-2.
[19] Le Dizès S., Cruiziat P., Lacointe A., Sinoquet H., Le
Roux X., Balandier P., Jacquet P., A model for simulating
structure-function relationships in walnut tree growth process-
es, Silva Fennica 31 (1997) 313-328.
[20] Lemoine B., Growth and yield of maritime pine (
Pinus
pinaster
Ait): the average dominant tree of the stand, Ann. Sci
For. 48 (1991) 593-611.
A. Porté et al.
86
[21] Lemoine B., Decourt N., Tables de production pour le
pin maritime dans le sud-ouest de la France. R.F.F. XXI 1
(1969) 5-16.
[22] Lemoine B., Gelpe J., Ranger J., Nys C., Biomasses et
croissance du pin maritime. Étude de la variabilité dans un peu-
plement de 16 ans, Ann. Sci. For. 43 (1) (1986) 67-84.
[23] Linder S., McMurtrie R.E., Lansberg J.J., Growth of
Eucalypts: a mathematical model applied to Eucalyptus globu-
lus, In: Crop Physiology of Forest Trees.Tigerstedt P.M.A.,
Puttonen P. and Koski V. (Eds.), Proceedings of an
International Conference on Managing Forest Trees as
Cultivated Plants held in Finland, July 23-28, University of
Helsinki, (1984) 117-126.
[24] Loustau D., Domec J.C., Bosc A., Interpreting the vari-
ability of xylem sap flux density within the trunk of Maritime
Pine (
Pinus pinaster Ait.): application for calculating the water
flow at the tree and stand levels, Ann. Sci. For. 55 (1998) 29-
46.
[25] Maguire D.A., Bennett W.S., Patterns in vertical distri-
bution of foliage in young coastal Douglas-fir, Can. J. For. Res.
26 (1996) 1991-2005.
[26] Margolis H., Oren R., Whitehead D., Kaufmann M.R.,
Leaf area dynamics of conifer forests, in: Smith W.K. and
Hinkley T.M. (Eds.), Ecophysiology of coniferous forests, Ac.
Press Inc., San Diego, 1995, pp. 181-224.
[27] McMurtrie R.E., Leuning R., Thompson W.A.,
Wheeler A.M., A model of canopy photosynthesis and water
use incorporating a mechanistic formulation of leaf CO
2
exchange, For. Ecol. Man. 52 (1992) 261-278.
[28] Morales D., Jiménez M.S., González-Rodríguez A.M.,
Cermák J., Laurel forests in Tenerife, Canary Islands. II. Leaf
distribution patterns in individual trees, Trees 11 (1996) 41-46.
[29] Perttunen J., Sievänen R., Nikinmaa E., Salminen H.,
Saarenmaa H., Väkevä J., LIGNUM: A tree model based on
simple structural units, Ann. Bot. 77 (1996) 87-98.
[30] Porté A., Loustau D., Variability of the photosynthetic
characteristics of mature needles within the crown of a 25-
year-old
Pinus pinaster, Tree Physiol. 18 (1998) 223-232.
[31] Reffye P(de)., Fourcaud T., Balise F., Barthélémy D.,
Houllier F., A functional model of tree growth and tree archi-
tecture, Sylva Fennica 31 (3) (1997) 297-311.
[32] Schoettle A.W., Fahey T.J., Foliage and fine roots
longevity of pines, Ecol. Bull. 43 (1994) 136-153.
[33] Stokes A., Martin F., Scriste S., Fourcaud T.,
Adaptation of tree roots to wind loading – The relationship
between mechanical behaviour and wood formation, in
Jeronimidis G. and Vincent J.F.V. (Eds.), Plant Biomechanics,
university of Reading, 1997, pp. 339-347.
[34] Stokes A., Berthier S., Sacriste S., Martin F.,
Variations in maturation strains and root shape in root systems
of Maritime pine (
Pinus pinaster Aït.), Trees 12 (1998) 334-
339.
[35] Valentine H.T., A carbon-balance model of tree growth
with a pipe-model framework, in Dixon R.K., Meldahl R.S.,
Ruark G.A. and Warren W.G. (Eds.), Forest growth: process
modeling of forest growth responses to environmental stress,
Timber press, Portland, Oregon, 1990, pp. 33-40.
[36] Valentine H.T., Baldwin Jr. V.C., Gregoire T.G.,
Burkhart H.E., Surrogates for foliar dry matter in loblolly pine,
For. Sci. 40 (3) (1994) 576-585.
[37] Vannière B., Tables de production pour les forêts
françaises, Engref Nancy (Ed.), (1984) p. 158.
[38] Vose J.M., Dougherty P.M., Long J.N., Smith F.W.,
Gholz H.L., Curran P.J., Factors influencing the amount and
distribution of leaf area of pine stands, Ecol. Bull. 43 (1994)
102-114.
[39] Wang Y.P., Jarvis P.G., Benson M.L., Two-dimension-
al needle-area density distribution within the crowns of
Pinus
radiata
, For. Ecol. Man. 32 (1990) 217-237.
[40] Wang Y.P., Jarvis P.G., Influence of shoot structure on
the photosynthesis of Sitka spruce (
Picea sitchensis), Func.
Ecol. 7 (1993) 433-451.
[41] Webb W.L., Ungs M.J., Three dimensional distribution
of needle and stem surface area in a Douglas-fir, Tree Physiol.
13 (1993) 203-212.
APPENDIX 1.
Table A1. List of symbols used in the text, presented in alpha-
betical order.
Symbol Units Description
α rad angle between the trunk and the branch chord
BrLA m
2
branch leaf area
C m length of the branch chord
CrLA m
2
crown leaf area
CrLgth m length of the crown
CrRad m maximum radius of the crown
D cm diameter of a 1
st
order growth unit
D
j
cm diameter of a 2
nd
order internode j
D
10
cm branch diameter at 10 cm of the bole
DBH cm tree diameter at breast height
DLC cm tree diameter under the living crown
H m insertion height of a branch on the trunk
Ht
rel
– normalised length of the crown
L m length of a 1
st
order growth unit
L
b
m length of the branch
L
j
m length of a 2
nd
order internode j
L
jx
m length of the orthogonal projection of
internode
j on the horizontal axis
L
jy
m length of the orthogonal projection of
internode
j on the vertical axis
LA
j
m
2
leaf area borne by the 2
nd
order whorl j
and internode j
LAI m
2
m
-2
leaf area index (needles alone)
NAD
j
– needle area density borne by the 2
nd
order
whorl
j and internode j
PAI m
2
m
-2
plant area index (including needles and
woody axis)
SLA m
2
kg
-1
specific leaf area
X
j
m abscissa of the 2
nd
order whorl j
X
rel
– normalised radius of the crown
Y
j
m ordinate of the 2
nd
order whorl j