Báo cáo khoa học: "atterns in individual growth, branch population dynamics, and growth and mortality of first-order branches of Betula platyphylla in northern Japan" docx
Bạn đang xem bản rút gọn của tài liệu. Xem và tải ngay bản đầy đủ của tài liệu tại đây (111.03 KB, 12 trang )
Original article
Patterns in individual growth,
branch population dynamics, and growth
and mortality of first-order branches
of Betula platyphylla in northern Japan
Kiyoshi Umeki
a,*
and Kihachiro Kikuzawa
a
Hokkaido Forestry Research Institute, Koshunai, Bibai, Hokkaido 079-0198, Japan
b
Laboratory of Forest Biology, Graduate School of Agriculture, Kyoto University, Japan
(Received 1 February 1999; accepted 27 March 1999)
Abstract – Growth of individual trees, population dynamics of first-order branches within individuals, and growth and mortality of
first-order branches were followed for two years in an plantation of Betula platyphylla in central Hokkaido, northern Japan. The data
were analyzed by stepwise regressions. The relative growth rate in terms of above-ground biomass of individuals was negatively
correlated with a log-transformed competition index (ln(CI)), which was calculated for each individual from the size and distance of
its neighbours. The change in branch number within an individual was also correlated with ln(CI). The growth and mortality of
branches was correlated with the size of branches, size of individuals, growth of individuals, relative height of branches, and ln(CI).
Generally, the patterns revealed by the regressions were consistent with what was expected and can be used as references against
which the behavior of more detailed process-based models can be checked.
Betula platyphylla / branch population dynamics / competition / branch growth / branch mortality
Résumé – Modèles de croissance individuelle, dynamique de développement des branches et croissance et mortalité des
branches du Betula Platyphylla. La croissance des arbres individuels, la dynamique de développement des branches de premier
ordre sur les arbres individuels ainsi que la croissance et la mortalité des branches de premier ordre ont été étudiées pendant deux ans
dans une pépinière de Betula Platyphylla de la région centrale du Hokkaido dans le nord du Japon. Les modèles de croissance indivi-
duelle, la dynamique de développement des branches et la croissance et la mortalité des branches ont été analysées selon leur régres-
sion progressive. Le taux de croissance relatif en termes de biomasse aérienne des arbres individuels s’est avéré en rapport inverse à
l’index de concurrence des grumes (ln(CI)), après calcul pour chaque individu d’après la taille et l’éloignement de ses voisins. Le
changement du nombre de branches sur un même individu est également en rapport avec ln(CI). La croissance et la mortalité des
branches s’est avérée en rapport avec la taille des branches, la taille des individus, la croissance des individus, la hauteur relative des
branches et ln(CI). En général, les modèles mis en évidence par les régressions sont conformes aux hypothèses avancées et peuvent
servir de référence pour le contrôle d’autres modèles plus détaillés.
Betula platyphylla / dynamique de développement des branches / compétition / croissance des branches / mortalité des
branches
Ann. For. Sci. 57 (2000) 587–598 587
© INRA, EDP Sciences
* Correspondence and reprints
Tel. +81-1266-3-4164; Fax. +81-1266-3-4166; e-mail:
K. Umeki and K. Kikuzawa
588
1. INTRODUCTION
An individual tree is constructed from structural units
growing and iterating within an individual [12, 45], and
can be thought of as a population of structural units [45].
Thus far, various components of an individual plant such
as branches, shoots, and metamers [34] have been used
as the structural unit, or module, of a tree. In this paper,
the term “module” is defined, following Harper [13], as
“a repeated unit of multicellular structure, normally
arranged in a branch system.”
The spatial and static aspects of a module population
within a tree can be expressed by the spatial distribution
of modules within a tree. The distribution of modules is
important because it determines the crown form and the
amount of light captured by the crown; future growth is
determined by the amount of captured light. Previous
studies have reported the size and location of modules
and angles between modules [e.g. 1, 4-6, 19, 26, 33].
The dynamic aspect of a module population within a
tree can be expressed by the change in the number of
modules within a tree. The number of modules is
changed through the birth and death of modules [13].
Some studies have described the population dynamics
(birth and death) of modules within trees [e.g. 18, 25,
28]. If the size of modules under consideration can
change, the change in size (growth) of modules must
also be considered [15, 16].
In reality, the spatial and dynamic aspects of module
population within a tree are closely related. The distrib-
ution of modules determines the distribution of resources
(e.g. light) which determines the dynamics of local mod-
ule population. The dynamics of local module popula-
tions, in turn, determines the future distribution of
resources. Thus, development of a tree should be under-
stood as the dynamics (birth, death, and growth) of mod-
ules which occupy certain three-dimensional spaces
within a tree [8, 15, 39].
The distribution of resources is largely affected by the
presence of neighbouring individuals (or modules of
neighbouring individuals) [2, 10]. This implies that the
spatial distribution and sizes of neighbouring individuals
(i.e. competitive status of the target individual) must be
considered to better understand the module population
dynamics within individuals interacting with neighbours.
However, the relationship between module population
dynamics within individuals and the competitive status of
the individual is not fully understood, while the relation-
ship between local competition and the size or growth of
individuals is well-documented [e.g. 3, 42, 44].
In quantifying module population dynamics, some
morphological traces such as bud scars or annual rings
can be used for reconstructing the history of the develop-
ment of modules [e.g. 4, 18, 31, 32, 39]. However, it is
sometimes difficult to estimate module mortality by such
reconstruction methods because these methods recon-
struct the past of only presently living organs. In
consequence, direct information about the branches that
have already been shed cannot be obtained. Continuous
observations of modules provide more detailed informa-
tion on module population dynamics [16, 24, 27, 28].
For species with an erect main stem and lateral
branches that are clearly distinguishable from the main
stem, first-order branches (branches attached directly to
the main stem) are a convenient unit for describing tree
structure. The distribution of first-order branches is
important because it determines the shape of the whole
tree crown. For example, Kellomäki and Väisänen [18]
reported the dynamics of the first-order branch popula-
tion within individual trees of Pinus sylvestris. Jones
and Harper [15] quantified the growth of first-order
branches of Betula pendula by the number of buds or
higher-order branches within branches, and analysed the
effect of neighbouring trees. Although many tree archi-
tecture models include birth, mortality, and growth of
branches [e.g. 17, 30], these processes are not well
understood for first-order branches of trees.
In this paper, we analyze data obtained from a planta-
tion of Betula platyphylla var. japonica (Miq.) Hara
whose architecture is suitable for the observation of first-
order branches. We use a simple index to express the
competitive status of individual trees, and report 1) the
patterns in growth of individuals, 2) population dynam-
ics of first-order branches within individuals, and 3) how
growth and mortality of first-order branches are related
to the size and height of branches, the competitive status
of individuals, and the size and growth of individuals.
2. MATERIALS AND METHODS
2.1. Study site and data collection
At the end of the growing season in 1993, a square
plot (10 m × 10 m) was set up in an eight-year-old artifi-
cial plantation of Betula platyphylla in Shintotsukawa,
central Hokkaido, northern Japan. B. platyphylla is a
common deciduous tree in Hokkaido. It is a typical
early-successional tree species characterised by its fast
growth and shade-intolerance [21-23]. B. platyphylla
produces two distinct types of shoots: long shoots and
short shoots [9, 20]. Long shoots, which determines the
overall crown shape, usually develop as lateral branches
of parent long shoots [20]. In this study, we analyzed
Growth and mortality of branches of Birch
589
the growth and mortality of first-order branches > 5 cm
in length. First-order branches < 5 cm were not
included.
All individuals within the plot were numbered. For
each individual, diameter at breast height (Dbh), height
of the leader shoot tip (tree height; denoted as H in
figure 1), and the three-dimensional coordinates of the
base of the main stem ((x
0
, y
0
, 0)) were recorded in 1993.
The three-dimensional coordinates of the tip ((x
1
, y
1
,
z
1
)) and base ((x
0
, y
0
, z
2
)) of all first-order branches
(> 5 cm in length) were determined with a measuring
pole. If the main stem was not vertical, the x- and y-
coordinates of the leader shoot tip and the bases of first-
order branches were not (x
0
, y
0
) (i.e. the leader shoot tip
was not at (x
0
, y
0
, H)). In this case, the horizontal devia-
tion of the leader shoot tip from the base of the main
stem was determined and necessary corrections were
made in the coordinates of the leader shoot and the bases
of first-order branches. In general, horizontal deviations
of the leader shoot tips were small: the average deviation
was 24.3 cm.
At the end of each growing season in 1994 and 1995,
the same measurements were repeated so that dynamics
data in two sequential one-year intervals (1993-1994 and
1994-1995) were available. In the measurements in
1994 and 1995, the deaths of first-order branches and
three-dimensional coordinates of the first-order branches
that developed in the current year were recorded. All the
variables used in the equations are given in table I.
2.2. Biomass estimation
The branch length (BL) of the first-order branches was
calculated from the three-dimensional coordinates of the
base and tip of the branches, and then converted to foliar
biomass (FBbm) and woody biomass (WBbm) using allo-
metric equations. In 1995, thirty first-order branches, 15
of which were in the upper half of crowns and the rest of
which were in the lower half, were sampled from trees in
the same plantation adjacent to the 10 m × 10 m plot in
order to develop equations that estimate FBbm and
WBbm from BL. The sampled branches were taken to
the laboratory and separated into foliar and woody com-
ponents. The two components were dried and weighed.
Log-transformed FBbm and WBbm were regressed on
log-transformed BL.
The effect of the vertical position (upper half of
crowns vs. lower half) of branches on the allometric
equations was tested by analysis of covariance because
the light intensity associated with the vertical position in
crowns often affects the morphology and allocation of
branches and leaves [25]. The branch vertical position
had a significant effect on the intercept term in the
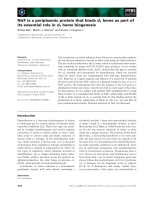
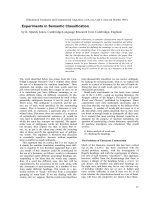
Figure 1. Diagram of the vari-
ous measurements made on
each tree during the study. (x
0
,
y
0
, H): three-dimensional coor-
dinates of the leader shoot tip,
(x
1
, y
1
, z
1
): three-dimensional
coordinates of the tip of a
branch, (x
0
, y
0
, z
2
): three-
dimensional coordinates of the
base of a branch, (x
0
, y
0
, 0):
three-dimensional coordinates
of the base of the main stem of
an individual. H: height of the
leader shoot tip (tree height),
z
2
: height of the base of a
branch.
K. Umeki and K. Kikuzawa
590
equation predicting FBbm (foliar biomass of a branch).
For WBbm (woody biomass of a branch), the effect of
the branch vertical position was not significant. The
obtained equations are as follows:
ln(FBbm) = 2.55 ln(BL) – 8.76,
for upper branches,
ln(FBbm) = 2.55 ln(BL) – 8.47,
for lower branches (r
2
= 0.96: the model with a common
slope and two specific intercepts for branches in the
upper and lower parts of crowns), and
ln(WBbm) = 1.01 ln(BL) – 0.85,
for all branches (r
2
= 0.82). Total branch biomass
(TBbm) for each branch was estimated by summing
FBbm and WBbm. To estimate the main stem biomass
(Sbm), a published equation was used [41]:
Sbm = 1.83 Dbh
2
H
where Dbh is the diameter at breast height (cm), and H is
the tree height (cm). By summing the biomass of the
main stem of a tree and all first-order branches attached
to the tree (including the foliar and woody biomasses),
the above-ground biomass (Agbm) was calculated for
each tree.
2.3. Data analysis
At the individual level, the relative growth rate in
terms of above-ground biomass (RgrAgbm: g g
–1
year
–1
),
the annual birth rate (B: year
–1
) and the death rate (D:
year
–1
) of first-order branches per individual, and the
annual net change in branch number per individual
(
∆
N = B – D, year
–1
) were analyzed. To detect patterns
in these variables, stepwise regressions were carried out
in which tree sizes (H, Dbh, and Agbm) and a log-trans-
formed competition index (CI: explained below) were
used as candidates for independent variables.
Table I. Description of variables used in equations.
Variable Unit Description
Individual level
H cm Tree height (height of the leader shoot tip)
Dbh cm Diameter at breast height
Sbm g Biomass of main stem
Agbm g Above-ground biomass including main stem, branches, and leaves
Agbm
i
g Above-ground biomass of the i-th neighbour
AgbmI g year
–1
Above-ground biomass increment per year
RgrAgbm g g
–1
year
–1
Relative growth rate in terms of above-ground biomss per year
HI cm year
–1
Height increment per year
RgrH cm cm
–1
year
–1
Relative growth rate in terms of tree height per year
B year
–1
Birth rate of first-order branches per tree per year
D year
–1
Death rate of first-order branches per tree per year
∆
N year
–1
Change in first-order branch number per tree per year
CI Competition Index
NN Number of neighobouring trees within 2 m from a target tree
d
i
m Distance from the i-th neighbor to a target tree
Branch level
BL cm Length of a first-order branch
FBbm g Foliar biomass of a first-order branch
WBbm g Woody biomass of a first-order branch
TBbm g Total (foliage and woody) biomass of a first-order branch
BH cm Height of the base of a first-order branch
RBH Ratio of the height of the base of a first-order branch to tree height
BE cm year
–1
Elongation of a first-order branch per year
FBbmI g year
–1
Increment in foliar biomass of a first-order branch per year
WBbmI g year
–1
Increment in woody biomass of a first-order branch per year
TBbmI g year
–1
Increment in total biomass of a first-order branch per year
BM % year
–1
Branch mortality rate per year
Growth and mortality of branches of Birch
591
To evaluate the competitive effect of neighbouring
individuals, a competition index (CI) was calculated for
each target individual:
(1),
where Agbm
i
is the above-ground biomass of the i-th
neighbour, d
i
is the distance from the i-th individual to
the target individual, and NN is the total number of
neighbours. Here, neighbours were defined as individu-
als within 2 m of the target individual. CI was calculated
for individuals within the 6 m × 6 m center quadrat in the
10 m × 10 m plot, and individuals outside the center
quadrat were used only as neighbours. CI was log-trans-
formed because the distribution of CI was positively
skewed and it performed well when transformed.
Branch elongation (BE), the increment in foliar bio-
mass of a branch (FBbmI), the increment in woody bio-
mass of a branch (WBbmI), and the increment in total
(foliar and woody) biomass of a branch (TBbmI) were
analyzed to detect patterns in branch growth. We used
12 variables as candidates for independent variables in
the stepwise regressions. They were classified into five
categories: (1) branch size = foliar biomass (FBbm),
woody biomass (WBbm), and total biomass (TBbm) of a
branch; (2) vertical branch position = height of the
branch base (BH; z
2
) and height of the branch base rela-
tive to tree height (RBH = z
2
/ H; see figure 1); (3) com-
petitive status = log-transformed competition index
(ln(CI)); (4) size of an individual = above-ground bio-
mass (Agbm) and tree height (H); and (5) growth of an
individual = above-ground biomass increment (AgbmI),
relative growth rate in terms of above-ground biomass
(RgrAgbm), height increment (HI), and relative growth
rate in terms of height (RgrH). These independent vari-
ables were selected using a stepwise regression with
α = 0.05 used for the criteria for entering and being
removed from the regression. Variables belonging to the
same category had strong correlations with each other.
Thus, they caused a problem of multicollinearity if more
than one of them remained in the regression models. To
reduce multicollinearity and to make it easier to interpret
the results of the regressions, we did not allow more than
one independent variable from a given category to
remain in a regression model. To do this, we removed
the variables that had poorer explanatory powers within
each category.
Branch mortality is a discrete event. A datum can
have either of two values: live or dead. A dichotomous
dependent variable calls for special consideration both in
parameter estimation and in the interpretation of good-
ness of fit [14]. We used the logistic regression to esti-
mate the annual probability of mortality of a first-order
branch (BM, % year
-1
) [14]. This model takes the form:
BM = 100 / [1 + exp(–X' β)]
where X' is the transpose of the vector of independent
variables used to predict BM, and
β
is the vector of
regression coefficients describing the relationship
between the independent variables and BM. The logistic
function has proven to be useful for developing models
of the probability of mortality of individual trees [11,
29]. Estimation of regression coefficients was carried
out by the maximum likelihood method. Usual measures
of goodness of fit such as the coefficient of determina-
tion or the correlation coefficient are not appropriate for
dichotomous variables. The appropriate test for signifi-
cance of the overall independent variables in a model
was provided by the likelihood ratio test in which the
statistic G is tested using a Chi-square distribution [14].
The significance of each independent variable is tested
by the Wald test [14]. As candidates for independent
variables in the logistic regressions for BM, we used the
same 12 variables as in the regressions of branch growth,
and used the same rule in selecting independent
variables.
All the regressions except for the logistic regression
were done by PROC REG in the SAS statistical package
[35] and the logistic regression was done by PROC
LOGISTIC in SAS [36]. Because there was no signifi-
cant year-to-year variance, dynamics data from the two
intervals (1993-1994 and 1994-1995) were pooled for
the analysis at the individual and branch levels.
3. RESULTS
3.1. Increment in diameter, height,
and biomass of individuals
The number of individuals measured was 46, only one
of which died during the measurement period. At the
start of the measurement (1993), the tree density was
4600 ha
–1
(table II), and average Dbh, H, and Agbm
CI
=
Agbm
i
d
i
2
Σ
i
=1
NN
Table II. Density and tree size (mean ± S.D.) in a plantation
of Betula platyphylla in Hokkaido, northern Japan.
Variable 1993 1995
Density (ha
–1
) 4 600 4 500
Dbh (cm) 2.01 ± 1.22 3.44 ± 1.77
Tree Height (cm) 324 ± 95 473 ± 125
Above-ground biomass (g) 5161 ± 6593 17029 ± 17 057
K. Umeki and K. Kikuzawa
592
(above-ground biomass of an individual) were 2.01 cm,
324 cm, and 5161 g, respectively (table II). In the two-
year measurement period, average Dbh, H, and Agbm
increased to 3.44 cm, 473 cm, and 17 029 g, respectively
(table II). The growth of the trees was very rapid;
above-ground biomass tripled in the two-year interval.
3.2. Branch population dynamics
within individuals
Ninety-seven percent (832 out of 862) of the new
branches developed and grew longer than 5 cm in the
same year that the main stem (parent shoot) developed.
This implied that almost all of the new first-order
branches (>5 cm in length) were sylleptic. The remain-
ing (3%) of the new branches attained the threshold of
5 cm in the year following the development of the main
stem. The birth rate of first-order branches per individ-
ual (B) was 10.7 year
–1
in the 1993-1994 interval and
8.2 year
–1
in the 1994-1995 interval (table III), which
corresponded, on average, to 50.0 and 32.6% of the
number of first-order branches in the previous year,
respectively. The death rate of first-order branches per
individual (D) was 7.8 year
–1
in the 1993-1994 interval
and 7.2 year
–1
in the 1994-1995 interval (table III),
which corresponded, on average, to 34.7 and 29.2% of
the number of first-order branches in the previous year,
respectively. In each of the two intervals, the mean birth
rate of first-order branches was larger than the mean
death rate although the difference was not significant in
the 1994-1995 interval (p = 0.4% by paired t test with
d.f. = 45 in the 1993-1994 interval, and p = 23.4% with
d.f. = 44 in the 1994-1995 interval). The number of first-
order branches per individual increased on average
(table IV).
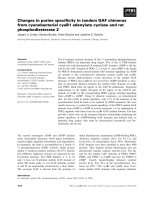
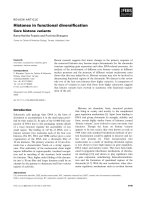
3.3. Patterns in individual growth and branch
population dynamics within individuals
Relative growth rate in terms of above-ground bio-
mass of individuals (RgrAgbm) was most strongly relat-
ed with log(CI) (log-translated competition index)
(figure 2a), but log(CI) explained only 18% of the vari-
ance of RgrAgbm. Some of the unexplained variation
was due to the above-ground biomass of an individual
(Agbm). Inclusion of Agbm into the regression model as
a further independent variable increased the coefficient
of determination to 34% (table IV). The selected model
indicated that RgrAgbm increased with decreasing com-
petition and with increasing individual size. The birth
rate of first-order branches per individual (B) had a nega-
tive relationship with ln(CI) whereas the death rate (D)
had a positive relationship with Agbm (above-ground
biomass of individuals) (figures 2b, c; table IV). The net
annual change in first-order branch number per individ-
ual (∆N) was negatively related to ln(CI) indicating that
the first-order branch population within an individual
grew rapidly for individuals with weak competition
(figure 2d; table IV). The number of first-order branches
decreased (i.e. ∆N < 0) for individuals with strong com-
petition though above-ground biomass increased even
for these individuals (figures 2a, d). The regressions
could account for 12.6 to 38.3% of the variance of the
above four variables (RgrAgbm, B, D, and ∆N); more
than half the variance remained unexplained. The final
models for these variables, which were selected by the
stepwise regressions, are tabulated in table IV.
Table III. Branch number and change in branch number per
tree in a plantation of Betula platyphylla in Hokkaido, northern
Japan (mean ± S.D.; n = 46 for 1993 and 1994, n = 45 for
1995).
Year or Variable
Measurement
Interval
1993 Branch Number 24.6 ± 10.3
1994 Branch Number 27.5 ± 11.3
1995 Branch Number 29.0 ± 13.0
1993~1994 Birth Rate (B; year
–1
) 10.7 ± 4.3
1993~1994 Death Rate (D; year
–1
) 7.8 ± 3.3
1993~1994 Net Change (∆N; year
–1
) 2.9 ± 5.2
1994~1995 Birth Rate (B; year
–1
) 8.2 ± 3.9
1994~1995 Death Rate (D; year
–1
) 7.2 ± 3.6
1994~1995 Net Change (∆N; year
–1
) 0.8 ± 6.1
Table IV. Final models for variables at the individual level
selected by the stepwise regressions. Agbm: above-ground bio-
mass (g), B: birth rate of first-order branches (year
–1
), CI: com-
petition index, D: death rate of first-order branches (year
–1
),
∆
N: change in branch number (year
–1
), RgrAgbm: relative
growth rate in terms of above-ground biomass (g g
–1
year
–1
).
***, **, and *: significant at the 0.1%, 1%, and 5% levels,
respectively.
Dependent Variable nr2 Final Model
RGR (Above-ground 38 0.340*** RgrAgbm = –1.30ln(CI)**
Biomass) – 0.000 0130Agbm**
+ 0.87
Birth Rate 38 0.126* B = –1.778ln(CI)*
+ 10.927
Death Rate 38 0.338*** D = 0.000233Agbm***
+ 6.31
Change in 38 0.383*** ∆N = –3.76ln(CI)***
Branch Number + 6.33
Growth and mortality of branches of Birch
593
3.4. Patterns of branch growth
The results of the stepwise regressions for four vari-
ables representing branch growth (BE: branch elonga-
tion, FBbmI: increment in foliar biomass of a branch,
WBbmI: increment in woody biomass of a branch, and
TBbmI: increment in total biomass of a branch) were
similar (table V). The selected independent variables
had the strongest explanatory power within each catego-
ry of the independent variables. For example, RBH (rel-
ative branch height) had stronger effects on BE, FBbmI,
WBbmI, and TBbmI than did BH (branch height).
Although most of the independent variables that
remained in the final models were highly significant, the
amounts of variance explained by the models were low,
ranging from 9.7 to 22.0%.
We consistently found significant effects of the
woody biomass of a branch (WBbm), the height of the
branch base relative to tree height (RBH), and the loga-
rithm of the competition index (ln(CI)) on the four
Figure 2. Effects of competition index and individual
above-ground biomass on individual growth and branch
population dynamics within individuals. a) relationship
between relative growth rate in terms of above-ground
biomass (RgrAgbm) and the logarithm of the competi-
tion index (ln(CI)). RgrAgbm = –0.138 ln(CI) + 0.773,
r
2
= 0.180, p < 1%. b) relationship between the birth
rate of first-order branches per individual (B) and the
logarithm of the competition index (ln(CI)). B =
–1.778 ln(CI) + 10.927, r
2
= 0.126, p < 5%. c) relation-
ship between the death rate of first-order branches per
individual (D) and the above-ground biomass of the
individual (Agbm). D = 0.000233Agbm + 6.31, r
2
=
0.338, p < 0.1%. d) relationship between the annual net
change in first-order branch number per individual (∆N)
and the logarithm of the competition index (ln(CI)).
∆N = –3.76 ln(CI) + 6.33, r
2
= 0.383, p < 0.1%.
Table V. Final models for variables at the branch level selected by the stepwise regressions. Agbm: above-ground biomass of an
individual (g), AgbmI: above-ground biomass increment of an individual (g year
–1
), BE: branch elongation (cm year
–1
), BM: branch
mortality (% year
–1
), CI: competition index, FBbm: foliar biomass of a branch (g), FBbmI: foliar biomass increment of a branch
(g year
–1
), H: tree height (cm), HI: height increment of an individual (cm year
–1
), RBH: relative branch height, TBbmI: total (foliar
and woody) biomass increment of a branch (g year
–1
), WBbmI: woody biomass increment of a branch (g year
–1
). ***, **, and *: sig-
nificant at the 0.1%, 1%, and 5% level, respectively.
†
: G statistic is only for branch mortality.
Criterion Variable nr
2
or G
†
Final Model
Branch Growth Elongation 650 0.097*** BE = 0.23WBbm** + 46.19RBH*** – 4.30ln(CI)*** + 0.08HI** – 17.46
Foliar Biomass 650 0.220*** FBbmI = 0.61WBbm*** + 25.28RBH*** – 3.64ln(CI)*** – 0.000 33 AgbmI* – 16.66
Woody Biomass 650 0.097*** WBbmI = 0.10WBbm** + 20.59RBH*** – 1.92ln(CI)*** + 0.04HI** – 7.83
Total Biomass 650 0.160***
TBbmI = 0.76WBbm*** + 48.21RBH*** – 5.26ln(CI)*** + 0.067HI* – 0.03H* – 22.27
Branch Mortality 952 377.1*** ln[BM/(100–BM)] = – 0.09 WBbm*** – 10.62RBH*** + 0.54ln(CI)***
– 0.000 11AgbmI*** + 0.000 08Agbm*** + 6.55
K. Umeki and K. Kikuzawa
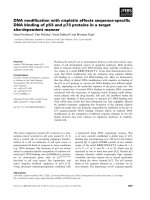
594
variables for branch growth (BE, FBbmI, WBbmI, and
TBbmI). WBbm and RBH had positive effects, and ln(CI)
had negative effects. This indicated a major pattern in
branch growth: branch growth tended to increase when
branches were large and located in relatively high posi-
tions in crowns, and was affected less by competition
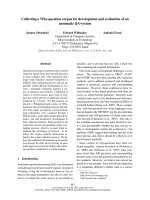
from neighbours. As an example of this pattern, the pre-
dicted response of TBbmI related to WBbm, RBH, and
ln(CI) is illustrated in figure 3. The predicted TBbmI
was calculated using the obtained regression model
(table V) with three levels of ln(CI) (0.0, 1.5, and 3.0),
three levels of RBH (0.3, 0.55, and 0.8), and mean values
of HI (68 cm year
–1
) and H (346 cm). The figure shows
the pattern clearly. The growth of smaller branches at
lower positions within individuals was predicted to be
negative.
An independent variable representing individual
growth (HI: height increment) had positive effects in
three regressions (for BE: branch elongation, WBbmI:
increment in woody biomass of a branch, and TBbmI:
increment in total biomass of a branch) indicating that
branch growth increased with increasing individual
height growth. In one regression (for FBbmI: increment
in foliar biomass of a branch), on the other hand, another
independent variable representing individual growth
(AgbmI: increment of above-ground biomass of an indi-
vidual) had a negative effect. Tree height (H) had a
weak negative effect on the total biomass increment of a
branch (TBbmI).
3.5. Patterns of branch mortality
The effect of the overall selected independent vari-
ables in the logistic regression for BM (branch mortality
rate) was highly significant (G = 377.1; d.f. = 5;
p < 0.1%), and the effect of each selected independent
variable was also highly significant (table V). BM
increased with decreasing woody biomass of a branch
(WBbm), with decreasing height of the branch base rela-
tive to tree height (RBH), and with increasing competi-
tion (ln(CI)) (table V).
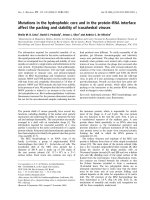
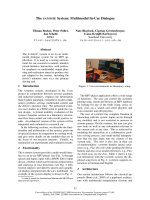
We found a major pattern in branch mortality similar
to the pattern observed in branch growth: BM tended to
decrease when branches were large and located in rela-
tively high positions in crowns, and was affected less by
competition from neighbours. The dependence of BM
on WBbm, RBH, and ln(CI) is illustrated in figure 4. The
predicted value of BM was calculated using the obtained
regression model (table V) with three levels of ln(CI)
(0.0, 1.5, and 3.0), three levels of RBH (relative branch
height: 0.3, 0.55, and 0.8), and mean values of AgbmI
(increment in above-ground biomass of an individual:
4613 g year
–1
) and Agbm (above-ground biomass of an
individual: 6 910 g). The figure shows a strong effect of
RBH. BM was less than 30% irrespective of WBbm and
ln(CI) if the branches were in the upper region of a
crown (RBH = 0.8), whereas it was more than 50% if the
branches were shorter than 38 cm and located in the
lower region of a crown (RBH = 0.3).
Figure 3. Predicted relationship between total (foliar and woody) biomass increment of a branch (TBbmI) and woody biomass of a
branch (WBbm) with three levels of ln(CI) (0.0, 1.5, and 3.0) and three levels of RBH (a, 0.3; b, 0.55; c, 0.8). TBbmI = 0.76 WBbm +
48.21 RBH – 5.26 ln(CI) + 0.067 HI – 0.03 H – 22.27. To calculate the predicted values, the mean values for HI (68 cm year
–1
) and
H (346 cm) were used.
Growth and mortality of branches of Birch
595
Two variables representing individual size (Agbm)
and growth (AgbmI) were selected as significant factors
in the logistic regression. Branch mortality was larger if
the individual to which the branch was attached was
large and growth of the individual was small.
4. DISCUSSION
The birth and death rates of first-order branches per
individual of young Betula platyphylla ranged from 7.2
to 10.7 year
–1
which were about a third of the number of
branches in the previous year. Almost all of the new
first-order branches (> 5 cm in length) developed as
sylleptic shoots from the leader shoot; they were located
in the upper part of the crowns. Branch mortality, on the
contrary, was concentrated in the lower part of crowns
(figure 4). Therefore, an individual Betula platyphylla
shifts its crown upward by shedding about a third of its
first-order branches in the lower part of the crown, and
by developing almost as many new branches in the upper
part of the crown. The rapid turnover rate of first-order
branches, coupled with the rapid height growth, is an
important characteristic of pioneer species such as
Betula platyphylla.
This dynamic view of crown development of Betula
platyphylla is consistent with the results of a previous
study. Sumida and Komiyama [40] showed that the
height of the base of the lowest first-order branch of
Betula platyphylla was high compared with those of
shade-tolerant species, and the maximum age of the
branches was low. They inferred that the period of
branch retention of Betula platyphylla was short (i.e.
branch mortality was high), and concluded that it was a
characteristic of crown development of shade-intolerant
species [40].
The regression analyses in the present study revealed
that individual tree growth expressed by the relative
growth rate in terms of above-ground biomass
(RgrAgbm) was affected by the competitive effect of
neighbours (ln(CI)) (figure 2a, table IV). The change in
the number of first-order branches within individuals
(∆N) was also affected by ln(CI) (figure 2, table IV).
These results indicated that competition with neighbours,
probably for light, is important in determining individual
tree growth and branch population dynamics within indi-
viduals. However, the amounts of the variances that
could be explained by the competition index (ln(CI))
were small. Similar patterns (i.e. competition affects the
growth of individuals, but cannot explain a large amount
of the variance in growth) have been found in some other
studies [7, 37, 39].
The number of first-order branches of individuals that
experience strong competition from neighbours can
decrease though the above-ground biomass increases
even for such individuals (figures 2a, d). The reduction
in the number of first-order branches causes reductions
in crown size and the amount of photosynthesis,
Figure 4. Predicted relationship between branch mortality (BM) and woody biomass of a branch (WBbm) with three levels of ln(CI)
(0.0, 1.5, and 3.0) and three levels of RBH (a, 0.3; b, 0.55; c, 0.8). ln[BM/(100 – BM)] = – 0.09 WBbm – 10.62 RBH + 0.54 ln(CI) –
0.00011 AgbmI + 0.00008 Agbm + 6.55. To calculate of the predicted values, the mean values for AGM (6910 g) and AGMI (4613 g
year
–1
) were used.
K. Umeki and K. Kikuzawa
596
eventually leading to the death of individuals. In the
study plot, individual mortality was low (table II) indicat-
ing that the stand had not reached the self-thinning stage.
However, the process leading to the deaths of individuals
was found in a considerable number of individuals.
The regression analyses in the present study detected
an important pattern in branch growth: larger branches in
the upper part within crowns that experience less compe-
tition can grow more rapidly (figure 3, table V). A simi-
lar pattern has been found in Betula pendula by Jones
and Harper [15] who reported that young branches locat-
ed in the upper part of crowns and branches with less
competition grow better. Maillette [27] also reported
that growth of branches of Betula pendula expressed by
the number of buds was larger in the upper part of the
crowns than in the lower part. This pattern can be
explained by the amount of light captured by the branch-
es; larger branches in higher positions within individuals
with less competition can intercept more light, resulting
in better growth.
Tree development is often reconstructed by some
morphological traces such as bud scars or annual rings
[e.g. 4, 18, 31, 32, 39]. These methods, however, recon-
struct the past of only presently living organs so that
direct information about the branches that have already
been shed cannot be obtained. This is probably the rea-
son why few studies have dealt with branch mortality of
hardwood trees. For some conifers, on the other hand,
reconstruction methods are useful because dead branches
are retained on stems for a long time [18, 25]. Data on
branch mortality can be obtained by continuous observa-
tion of branches by non-destructive methods. The pat-
tern detected in the present study regarding branch
mortality was similar to the pattern in branch growth (i.e.
BE: branch elongation, FBbmI: increment in foliar bio-
mass of a branch, WBbmI: increment in woody biomass
of a branch, and TBbmI: increment in total biomass of a
branch): larger branches in the upper part within individ-
uals that experience less competition have a higher prob-
ability of surviving (figure 4, table V). This pattern in
branch mortality can be explained by the amount of light
captured by branches. McGraw [28] reported a similar
pattern in shoot mortality of a shrub, Rhododendron
maximum in which the mortality of large shoots, which
intercept more light, was lower than that of small shoots.
The major patterns revealed by the regressions at the
branch level (figures 3, 4) suggested that the growth and
mortality of branches were largely determined by the
amount of light captured by each branch, indicating an
autonomy of branches [38].
Despite the autonomous behavior of branches, parts of
an individual still depend on the other parts of the indi-
vidual to various degrees [38, 43]. It is important to
understand the extent to which modules are physiologi-
cally integrated to an individual plant in order to under-
stand the architectural development of plants [38, 43].
In the regression analyses for branch growth and mortali-
ty, some suggestions of integration of modules were
found. Throughout the regressions, the height of the
branch base relative to tree height (RBH) had greater
explanatory powers over the absolute height of the
branch base (BH) which would be more closely related
to the light condition in a stand. Moreover, variables
representing individual size and growth (HI: height
increment, AgbmI: increment in above-ground biomass,
H: tree height, and Agbm: above-ground biomass) were
found to be significant factors in the regressions. These
results indicated that branch growth and mortality are
influenced by the status of whole individuals and may
suggest integration of modules in an individual.
However, the effects of the variables representing indi-
vidual growth and size cannot be easily interpreted. For
example, HI had positive effects on BE, WBbmI, and
TBbmI, while AgbmI had a negative effect on FBbmI.
The underlying causal processes for these patterns are
not clear and future research efforts should clarify the
biomass allocation pattern between the branches and the
main stem, and among the branches.
In all the regression analyses in the present study, the
selected independent variables can explain significant
amounts of the variances in the dependent variables, but
the unexplained variances were large. This implies that,
in modelling of tree development, the obtained regres-
sion models should be used with error variances. The
obtained regression models can be used as references
against which the behavior of more detailed process-
based models can be checked.
In conclusion, the regression analyses revealed the pat-
terns in individual growth (RgrAgbm: relative growth rate
in terms of above-ground biomass), branch population
dynamics within individuals (B: birth rate of branches,
D: death rate of branches, and ∆N: change in branch num-
ber per year), branch growth (BE: branch elongation,
FBbmI: increment in foliar biomass of a branch, WBbmI:
increment in woody biomass of a branch, and TBbmI:
increment in total biomass of a branch), and branch mor-
tality (BM). Competition with neighbours affects both
biomass growth of individuals and branch population
dynamics within individuals. Large branches located in
relatively higher positions within individuals that experi-
ence less competitive effects from neighbouring individu-
als grow rapidly and have large probabilities of surviving.
These patterns in branch growth and mortality can be
explained by the amount of light captured by each branch,
suggesting branch autonomy. The obtained regression
models can be used as references for further modelling.
Growth and mortality of branches of Birch
597
Acknowledgements: We gratefully acknowledge the
field assistance provided by H. Koyama, M. Takiya,
K. Terazawa, M. Saito, and the late N. Mizui.
REFERENCES
[1] Bozzuto L.M., Wilson B.F., Branch angle in red maple
trees, Can. J. For. Res. 18 (1988) 643-646.
[2] Canham C.D., Finzi A.C., Pacala S.W., Burbank D.H.,
Causes and consequences of resource heterogeneity in forests:
interspecific variation in light transmission by canopy trees,
Can. J. For. Res. 24 (1994) 337-349.
[3] Cannell M.G.R., Rothery P., Ford E.D., Competition
within stands of Picea sitchensis and Pinus contorta. Ann. Bot.
53 (1984) 349-362.
[4] Ceulemans R., Stettler R.F., Hinckley T.M., Isebrands
J.G., Heilman P.E., Crown architecture of Populus clones as
determined by branch orientation and branch characteristics,
Tree Physiol. 7 (1990) 157-167.
[5] Cluzeau C., Le Goff N., Ottorini J M., Development of
primary branches and crown profile of Fraxinus excelsior, Can.
J. For. Res. 24 (1994) 2315-2323.
[6] Doruska P.F., Burkhart H.E., Modeling the diameter and
locational distribution of branches within the crowns of loblol-
ly pine trees in unthinned plantations, Can. J. For. Res. 24
(1994) 2362-2376.
[7] Firbank L.G., Watkinson A.R., On the analysis of com-
petition at the level of the individual plant, Oecologia 71
(1987) 308-317.
[8] Franco M., The influence of neighbours on the growth
of modular organisms with an example from trees, Philos.
Trans. R. Soc. Lond. B. 313 (1986) 209-225.
[9] Fujimoto S., On the growth characteristics branching
into long shoots and short ones, Trans. Meet. Hokkaido Branch
Jan. For. Soc. 34 (1987) 163-165.
[10] Goldberg D.E., Components of resource competition in
plant communities, in: Grace J.B., Tilman D. (Eds.),
Perspectives on Plant Competition, Academic Press, San
Diego, 1990, pp. 27-49.
[11] Hamilton D.A. Jr., A logistic model of mortality in
thinned and unthinned mixed conifer stands of northern Idaho,
For. Sci. 32 (1986) 989-1000.
[12] Harper J.L., The population biology of plants,
Academic Press, London, 1977.
[13] Harper J.L., The concept of population in modular
organisms, in: May R.M. (Ed.), Theoretical Ecology: Principles
and applications, Blackwell Scientific Publications, Oxford,
1981.
[14] Hosmer D.W., Lemeshow S., Applied logistic regres-
sion, John Wiley & Sons, New York, 1989.
[15] Jones M., Harper J.L., The influence of neighbours on
the growth of trees. I. The demography of buds in Betula pen-
dula, Proc. R. Soc. Lond. Ser. B. 232 (1987) 1-18.
[16] Jones M., Harper J.L., The influence of neighbours on
the growth of trees. II. The fate of buds on long and short
shoots in Betula pendula, Proc. R. Soc. Lond. Ser. B. 232
(1987) 19-33.
[17] Kellomäki S., Kurttio O., A model for the structural
development of a Scots pine crown based on modular growth,
For. Ecol. Manage. 43 (1991) 103-123.
[18] Kellomäki S., Väisänen H., Dynamics of branch popu-
lation in the canopy of young Scots pine stands, For. Ecol.
Manage. 24 (1988) 67-83.
[19] Kershaw J.A. Jr., Maguire D.A., Crown structure in
western hemlock, Douglas-fir, and grand fir in western
Washington: trends in branch-level mass and leaf area, Can. J.
For. Res. 25 (1995) 1897-1912.
[20] Kikuzawa K., Leaf survival and evolution in
Betulaceae, Ann. Bot. 50 (1982) 345-353.
[21] Kikuzawa K., Leaf survival of woody plants in decidu-
ous broad-leaved forests. 1. Tall trees, Can. J. Bot. 61 (1983)
2133-2139.
[22] Koike T., Leaf structure and photosynthetic perfor-
mance as related to the forest succession of deciduous broad-
leaved trees, Pl. Sp. Biol. 3 (1988) 77-87.
[23] Koike T., Autumn coloring, photosynthetic perfor-
mance and leaf development of deciduous broad-leaved trees in
relation to forest succession, Tree physiol. 7 (1990) 21-32.
[24] Lehtilä K., Tuomi J., Sulkinoja M., Bud demography of
the mountain birch Betula pubescens spp. tortuosa near tree
line, Ecology 75 (1994) 945-955.
[25] Maguire D.A., Branch mortality and potential litterfall
from Douglas-fir trees in stands of varying density, For. Ecol.
Manage. 70 (1994) 41-53.
[26] Maguire D.A., Moeur M., Bennett W.S., Models for
describing basal diameter and vertical distribution of primary
branches in young Douglas-fir, For. Ecol. Manage. 63 (1994)
23-55.
[27] Maillette L., Structural dynamics of silver birch. I. The
fates of buds, J. Appl. Ecol. 19 (1982) 203-218.
[28] McGraw J.B., Effects of age and size on life histories
and population growth of Rhododendron maximum shoots,
Amer. J. Bot. 76 (1989) 113-123.
[29] Monserud R.A., Sterba H., Modeling individual tree
mortality for Austrian forest species, For. Ecol. Manage. 113
(1999) 109-123.
[30] Perttunen J., Sievänen R., Nikinmaa E., Salminen H.,
Saarenmaa H., Väkevä J., LIGNUM: A tree model based on
simple structural units, Ann. Bot. 77 (1996) 87-98.
[31] Remphrey W.R., Davidson C.G., Branch architecture
and its relation to shoot-tip abortion in mature Fraxinus penn-
sylvanica, Can. J. Bot. 70 (1992) 1147-1153.
[32] Remphrey W.R., Davidson C.G., Spatiotemporal distri-
bution of epicormic shoots and their architecture in branches of
Fraxinus pennsylvanica, Can. J. For. Res. 22 (1992) 336-340.
[33] Remphrey W.R., Powell G.R., Crown architecture of
Larix laricina saplings: quantitative analysis and modelling
of (nonsylleptic) order 1 branching in relation to development
of the main stem, Can. J. Bot. 62 (1984) 1904-1915.
K. Umeki and K. Kikuzawa
598
[34] Room P.M., Maillette L., Hanan J.S., Module and
metamer dynamics and virtual plants, Adv. Ecol. Res. 25
(1994) 105-157.
[35] SAS institute, SAS/STAT user’s guide, Cary, USA,
1990.
[36] SAS institute, SAS/STAT software: changes and
enhancements, Cary, USA, 1996.
[37] Schellner R.A., Newell S.J., Solbrig O.T., Studies on
the population biology of the genus Viola IV. Spatial pattern of
ramets and seedlings in three stoloniferous species, J. Ecol. 70
(1982) 273-290.
[38] Sprugel D.G., Hinckley T.M., Schaap W., The theory
and practice of branch autonomy, Annu. Rev. Ecol. Syst. 22
(1991) 309-334.
[39] Stoll P., Weiner J., Schmid B., Growth variation in a
naturally established population of Pinus sylvestris, Ecology 75
(1994) 660-670.
[40] Sumida A., Komiyama A., Crown spread patterns for
five deciduous broad-leaved woody species: ecological signifi-
cance of the retention patterns of larger branches, Ann. Bot. 80
(1997) 759-766.
[41] Takahashi Y., Asai T., Kikuzawa K., On biomass esti-
mation of Betula platyphylla var. japonica forest stand in
Nayoro, Bull. Hokkaido For. Exp. St. 12 (1974) 29-37.
[42] Wagner R.G., Radosevich S.R., Neighborhood predic-
tors of interspecific competition in young Douglas-fir planta-
tions, Can. J. For. Res. 21 (1991) 821-828.
[43] Watson M.A., Casper B.B., Morphogenetic constraints
on patterns of carbon distribution in plants, Annu. Rev. Ecol.
Syst. 15 (1984) 233-258.
[44] Weiner J., Neighborhood interference amongst Pinus
rigida individuals, J. Ecol. 72 (1984) 183-195.
[45] White J., The plant as a metapopulation, Annu. Rev.
Ecol. Syst. 10 (1979) 109-145.