Coal America’s Energy Future phần 1 ppt
Bạn đang xem bản rút gọn của tài liệu. Xem và tải ngay bản đầy đủ của tài liệu tại đây (1.36 MB, 10 trang )
VOLUME II: A TECHNICAL OVERVIEW
Coal: America’s Energy Future
VOLUME II
Table of Contents
Electricity Generation . . . . . . . . . . . . . . . . . . . . . . . . . . . . . . . . . . . . . . . . . . . . . . . . . . . . . . . . . . . . . . . 1
Coal-to-Liquids. . . . . . . . . . . . . . . . . . . . . . . . . . . . . . . . . . . . . . . . . . . . . . . . . . . . . . . . . . . . . . . . . . . . 27
The Natural Gas Situation . . . . . . . . . . . . . . . . . . . . . . . . . . . . . . . . . . . . . . . . . . . . . . . . . . . . . . . . . . 39
Economic Benefits of Coal Conversion Investments . . . . . . . . . . . . . . . . . . . . . . . . . . . . . . . . . . . . . 55
Appendices . . . . . . . . . . . . . . . . . . . . . . . . . . . . . . . . . . . . . . . . . . . . . . . . . . . . . . . . . . . . . . . . . . . . . . . 69
Appendix 2.1 Description of The National Coal Council . . . . . . . . . . . . . . . . . . . . . . . . . . . . . 69
Appendix 2.2 The National Coal Council Member Roster . . . . . . . . . . . . . . . . . . . . . . . . . . . . 70
Appendix 2.3 The National Coal Council Coal Policy Committee . . . . . . . . . . . . . . . . . . . . . . 80
Appendix 2.4 The National Coal Council Study Work Group. . . . . . . . . . . . . . . . . . . . . . . . . . 83
Appendix 2.5 Correspondence Between The National Coal Council
and the U.S. Department of Energy. . . . . . . . . . . . . . . . . . . . . . . . . . . . . . . . . . . 88
Appendix 2.6 Correspondence from Industry Experts . . . . . . . . . . . . . . . . . . . . . . . . . . . . . . . . 92
Appendix 2.7 Acknowledgements . . . . . . . . . . . . . . . . . . . . . . . . . . . . . . . . . . . . . . . . . . . . . . . 98
Appendix 2.8 Abbreviations . . . . . . . . . . . . . . . . . . . . . . . . . . . . . . . . . . . . . . . . . . . . . . . . . . . . 99
i
Commercial Combustion-Based Technologies
Combustion technology choices available today for utility scale power generation include circulating fluidized
bed (CFB) steam generators and pulverized coal (PC) steam generators utilizing air for combustion. Circulating
fluidized beds are capable of burning a wide range of low-quality and low-cost fuels. The largest operating CFB
today is 340 Megawatts (MW), although units up to 600 MW are being proposed as commercial offers.
Pulverized coal-fired boilers are available in capacities over 1000 MW and typically require better quality fuels.
Advanced Pulverized Coal Combustion (PC) Technology
Pulverized Coal Process Description
In a pulverized coal-fueled boiler
, coal is dried and ground in grinding mills to face-powder fineness (less than
50 microns). It is transported pneumatically by air and injected through burners (fuel-air mixing devices) into the
combustor. Coal particles burn in suspension and release heat, which is transferred to water tubes in the
combustor walls and convective heating surfaces. This generates high temperature steam that is fed into a turbine
generator set to produce electricity.
In pulverized coal firing, the residence time of the fuel in the combustor is relatively short, and fuel particles are
not recirculated. Therefore, the design of the burners and of the combustor must accomplish the burnout of coal
particles during about a two-second residence time, while maintaining a stable flame. Burner systems are also
designed to minimize the formation of nitrogen oxides (NO
X
) within the combustor.
The principal combustible constituent in coal is carbon, with small amounts of hydrogen. In the combustion
process, carbon and hydrogen compounds are burned to carbon dioxide (CO
2
) and water
, releasing heat energy.
Sulfur in coal is also combustible and contributes slightly to the heating value of the fuel; however, the product
of burning sulfur is sulfur oxides, which must be captured before leaving the power plant. Noncombustible
portions of coal create ash; a portion of the ash falls to the bottom of the furnace (termed bottom ash), while the
majority (80 to 90%) leaves the furnace entrained in the flue gas.
Pulverized coal combustion is adaptable to a wide range of fuels and operating requirements and has proved to
be highly reliable and cost-effective for power generation. Over 2 million MW of pulverized coal power plants
have been operated globally.
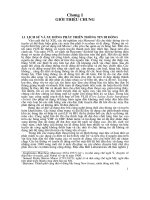
After accomplishing transfer of heat energy to the steam cycle, exhaust flue gases from the PC combustor are
cleaned in a combination of post combustion environmental controls. These environmental controls are described
in detail in further sections. A schematic of a PC power plant is shown in Figure 1.1.
1
CONVERSION INVESTMENTSCONVERSION INVESTMENTS
ELECTRICITY GENERATIONELECTRICITY GENERATION
COAL-TO-LIQUIDSCOAL-TO-LIQUIDS
NATURAL GAS SITUATIONNATURAL GAS SITUATION
APPENDICESAPPENDICES
CONVERSION INVESTMENTS
ELECTRICITY GENERATION
COAL-TO-LIQUIDS
NATURAL GAS SITUATION
APPENDICES
A
TECHNICAL OVERVIEW
A TECHNICAL OVERVIEW
AN OVERVIEW OF THE
Fluidized Bed Combustion
Fluidized Bed Combustion Process Description
In a fluidized bed power plant, coal is crushed (rather than pulverized) to a small particle size and injected into
a combustor, where combustion takes place in a strongly agitated bed of fine fluidized solid particles. The term
“fluidized bed’’ refers to the fact that coal (and typically a sorbent for sulfur capture) is held in suspension
(fluidized) by an upward flow of primary air blown into the bottom of the furnace through nozzles and strongly
agitated and mixed by secondary air injected through numerous ports on the furnace walls. Partially burned coal
and sorbent is carried out of the top of the combustor by the air flow. At the outlet of the combustor, high-
ef
ficiency cyclones use centrifugal force to separate the solids from the hot air stream and recirculate them to the
lower combustor
.
This recirculation provides long particle residence times in the CFB combustor and allows combustion to take
place at a lower temperature.
The longer residence times increase the ability to ef
ficiently burn high moisture,
high ash, low-reactivity
, and other hard-to-burn fuel such as anthracite, lignite, and waste coals and to burn a
range of fuels with a given design.
CFB technology incorporates primary control of NO
X
and sulfur dioxide (SO
2
) emissions within the combustor.
At CFB combustion temperatures, which are about half that of conventional boilers, thermal NO
X
is close to
zero. The addition of fuel/air staging provides maximum total NO
X
emissions reduction. For sulfur control, a
sorbent is fed into the combustor in combination with the fuel.
The sorbent is fine-grained limestone, which is
calcined in the combustor to form calcium oxide. This calcium oxide reacts with sulfur dioxide gas to form a
solid, calcium sulfate. Depending on the fuel and site requirements, additional NO
X
and SO
2
environmental
controls can be added to the exhaust gases.
W
ith this combination of environmental controls, CFB technology
provides an excellent option for low emissions and very fuel-flexible power generations.
CFB technology has been an active player in the power market for the last two decades. Today, over 50,000 MW
of CFB plants are in operation worldwide.
Fuel Preparation
Combustor
Air
Preheaters
Turbine/
Generator
Pulverizers
Environmental
Controls
Schematic Illustration
of a Pulverized Coal-Fired Utility Boiler
Figure 1.1
2
E
LECTRICITY GENERATION
Advanced Steam Cycles for Clean Coal Combustion
Improving power plant thermal efficiency will reduce CO
2
emissions and conventional emissions such as SO
2
,
NO
X
and particulate by an amount directly proportional to the efficiency improvement. Efficiency improvements
have been achieved by operation at higher temperature and pressure steam conditions and by employing
improved materials and plant designs. The efficiency of a power plant is the product of the efficiencies of its
component parts. The historical evolutionary improvement of combustion-based plants is traced in Figure 1.2.
As shown, steam cycle efficiency has an important effect upon the overall efficiency of the power plant
.
Current Coal-Fired Power Plant Improvements
Rankine cycle efficiency
improvement from 34% to 58% (LHV)
Due to: Regenerative feedwater
preheating
Increase of steam pressure
and temperature
Reheat
Steam turbine efficiency
improvement from 60% to 92%
Due to: Blade design
Reheat
Increase in steam pressure
and temperature
Shaft and inter-stage seals
Increase in rating
Generator efficiency improvement
from 91% to 98.7%
Due to: Increase in rating
Improved cooling
(hydrogen/water)
Boiler efficiency improvement
from 83% to 92% (LHV)
Due to: Pulverized coal combustion
with low excess air
Air preheat
Reheat
Size increase
Auxiliary efficiency improvement
from 97% to 98%
Due to: Increase in component
efficiencies
Size increase
Auxiliary efficiency decrease
from 98% to 93%
Due to: More boiler feed pump power
Power and heat for
emission-reduction systems
Power plant net efficiencies:
η Power Plant = η Rankine Cycle x η Turbine x η Generator x η Boiler x η Auxiliaries
η Early Power Plant = 34% x 60% x 91% x 83% x 97% = 15%
η Today’s Power Plant = 58% x 92% x 98.7% x 92% x 93% = 45% (LHV)
Note: Efficiency is usually expressed in percentages. The fuel energy input can be entered into the efficiency calculation either by the higher
(HHV) or the lower (LHV) heating value of the fuel. However, when comparing the efficiency of different energy conversion systems, it is
essential that the same type of heating value is used. In U.S. engineering practice, HHV is generally used for steam cycle plants and LHV
for gas turbine cycles. In European practice efficiency calculations are uniformly LHV-based. The difference between HHV and LHV for a
bituminous coal is about 5%, but for a high-moisture low-rank coal, it could be 8% or more.
Figure 1.2
Source: Termuehlen and Empsperger 2003
3
A
s steam pressure and superheat temperature are increased above 225 atm (3308 psi) and 374.5°C (706°F),
respectively, the steam becomes supercritical (SC); it does not produce a two phase mixture of water and steam
but rather undergoes a gradual transition from water to vapor with corresponding changes in physical properties.
In order to avoid unacceptably high moisture content of the expanding steam in the low pressure stages of the
steam turbine, the steam, after partial expansion in the turbine, is taken back to the boiler to be reheated. Reheat,
single or double, also serves to increase the cycle efficiency.
Pulverized coal fired supercritical steam cycles (PC/SC) have been in use since the1930s, but material
developments during the last 20 years, and increased interest in the role of improved efficiency as a cost-effective
means to reduce pollutant emission, resulted in an increased number of new PC/SC plants built around the world.
After more than 40 years of operation, supercritical technology has evolved to designs that optimize the use of
high temperatures and pressures and incorporate advancements such as sliding pressure operation. Over 275,000
MW of supercritical PC boilers are in operation worldwide.
Supercritical steam parameters of 250 bar 540°C (3526psi/1055°F) single or double reheat with efficiencies that
can reach 43 to 44 % (LHV) (39 to 40% HHV) represent mature technology. These SC units have efficiencies
two to four points higher than subcritical steam plants representing a relative 8 to 10% improvement in
efficiency. Today, the first fleet of units with Ultra Supercritical (USC) steam parameters of 270 to 300 bar and
600/600°C (4350 psi, 1110°/1110°F) are successfully operating, resulting in efficiencies of >45% (LHV) (40 to
42% HHV), for bituminous coal-fired power plants. These “600°C” plants have been in service more than seven
years, with excellent availability. USC steam plants in service or under construction during the last five years are
listed in Figure 1.3.
P
ower Cap.
Steam Parameters Fuel
Year of Eff%
Station MW Comm. LHV
Matsuura 2 1000 255bar/598°C/596°C PC 1997
Skaerbaek 2 400 290bar/580°C/580°C/580° C NG 1997 49
Haramachi 2 1000 259bar/604°C/602°C PC 1998
Nordjyland 3 400 290bar/580°C/580°C/580° C PC 1998 47
Nanaoota 2 700 255bar/597°C/595°C PC 1998
Misumi 1 1000 259bar/604°C/602°C PC 1998
Lippendorf 934 267bar/554°C/583°C Lignite 1999 42.3
Boxberg 915 267bar/555°C/578°C Lignite 2000 41.7
Tsuruga 2 700 255bar/597°C/595°C PC 2000
Tachibanawan 2 1050 264bar/605°C/613°C PC 2001
Avedere 2 400 300bar/580°C/600°C NG 2001 49.7
Niederaussen 975 290bar/580°C/600°C Lignite 2002 >43
Isogo 1 600 280bar/605°C/613°C PC 2002
Neurath 1120 295bar/600°C/605°C Lignite 2008 >43%
Figure 1.3
Source: Blum and Hald and others
USC Steam Plants in Service or Under Construction Globally
4
E
LECTRICITY GENERATION
L
ooking forward, advancements in materials are important to the continued evolution of steam cycles and higher
efficiency units. Development programs are under way in the United States, Japan and Europe, including the
THERMIE project in Europe and the Department of Energy/Ohio Cooperative Development Center project
in the United States, which are expected to result in combustion plants that operate at efficiencies approaching
48% (HHV) (Figure 1.4). Advanced materials development will be critical to the success of this program.
Japan – NIMS
Materials
Development
U.S. – DOE
Vision 21
Europe – THERMIE AD700
1997–2007 2002–2007 1998–2013
Development
Requirements
Ferritic steel
for 650°C
Materials development
and qualification
Target: 350 bar,
760°C, (870°C)
Materials development
and qualification
Component design
and demonstration
Plant demon stration
Target: 400 –1000 MW,
350 bar, 700°C, 720°C
Ongoing Development for USC Steam Plants
Figure 1.4
Source: Blum and Hald
5
F
igure 1.5 summarizes the evolution of efficiency for supercritical PC units. It should be noted that commercial
offerings for supercritical CFBs have been made in the last two years and that the first SCCFB units will be
commissioned in the next 2 to 3 years.
The effect of plant efficiency upon CO
2
emissions reduction is shown in Figure 1.6.
It is estimated that during the present decade 250 gigawatts (GW) of new coal-based capacity will be
constructed. If more efficient SC technology is utilized instead of subcritical steam, CO
2
emissions would be
about 3.5 gigaton (Gt) less during the lifetime of those plants, even without installing a system to capture CO
2
from the exhaust gases.
1. Eastern bituminous Ohio coal. Lower heating value, LHV, boiler fuel efficiency is higher than higher heating value, HHV, boiler fuel
efficiency. For example, an LHV net plant heat rate at 6205.27 Btu/kWh with the LHV net plant efficiency of 55% compares to the HHV
net plant heat rate at 6494 Btu/kWh and HHV net plant efficiency of 52.55%.
2. Reported European efficiencies are generally higher compared to those in the United States due to differences in reporting practice
(LHV vs. HHV), coal quality, auxiliary power needs, condenser pressure and ambient temperature, and many other variables. Numbers
in this column for European project numbers are adjusted for U.S. conditions to facilitate comparison.
Figure 1.5
Source: P. Weitzel, and M. Palkes
Estimated Plant Efficiencies for Various Steam Cycles
Description Cycle
Reported at
European
Location (LHV)
Converted to
U.S. Practice
(2)
(HHV)
Subcritical–commercial 16.8 MPa/558°C/538°C 37
Supercritical–mature 24.5
MPa/565°C/565°C/565°C
(1)
39–40
ELSAM (Nordjyland 3) 28.9 MPa/580°C/580°C/580°C 47/44 41
State of the Art 31.5
Supercritical–commercial MPa/593°C/593°C/593°C
(1)
40–42
THERMIE–future 38 MPa/700°C/720°C/720°C 50.2/47.7 46/43
EPRI/Parson–future 37.8 MPa/700°C/700°C/700°C 44
DOE/OCDO 38.5 MPa/760°C/760°C 46.5
USC Project–future 38.5 MPa/760°C/760°C/760°C 47.5–48
6
E
LECTRICITY GENERATION
Environmental Control Systems for Combustion-Based Technologies
In all clean-coal technologies, whether combustion- or gasification-based, entrained ash and trace contaminants
and acid gases must be removed from either the flue gas or syngas. Different processes are used to match the
chemistry of the emissions and the pressure/temperature and nature of the gas stream.
PC/CFB plants can comply with tight environmental standards. A range of environmental controls are integrated
into the combustion process (low NO
X
burners for PC, sorbent injection for CFB) or employed post combustion
to clean flue gas. The following sections describe the state of the art for emissions controls for combustion
technologies. In general, these environmental processes can be applied as retrofit to older units and designed into
new units. In some cases, performance will be better on a new unit since the design can be optimized with the
new plant.
Carbon Dioxide Emissions vs. Net Plant Efficiency
(Based on firing Pittsburgh #8 Coal)
CO
2
Emissions, tonne/MWh
Percentage CO
2
Reduction
Net Plant Efficiency, %
Percent CO
2
Reduction from
Subcritical PC Plant
Ultrasupercritical
PC Plant Range
Subcritical
PC Plant
CO
2
Emissions,
tonne/MWh
0.90
0.85
0.80
0.75
0.70
0.65
0.60
30
25
20
15
10
5
0
37 38 39 40 41 42 43 44 45 46 47 48 49 50
Figure 1.6
7
F
igure 1.7 illustrates the comprehensive manner in which combustion and post-combustion controls combine to
minimize formation and maximize capture of emissions from clean-coal combustion.
Recent Air Permit Limits
CONTROL AVERAGING PERMITTED
POLLUTANT TECHNOLOGY EMISSIONS LIMIT TIME FACILITIES
Carbon Monoxide (CO)
Good Combustion
Practices
.10 lb/MBtu
3-day rolling average,
excluding start up (SU)/
shut down (SD)
Thoroughbred, Trimble
County II, others
Nitrogen Oxides (NO
x
)
Low NO
X
Burners and
Selective Catalytic
Reduction
.05 lb/MBtu
<2 ppmdv Ammonia
30-day rolling average,
excluding SU/SD
CPS San Antonio,
Trimble County II
Particulate Matter (PM)
Fabric Filter Baghouse,
Flue Gas Desulfurization,
Wet ESP
.018 lb/MBtu
20% Opacity
Based on a 3-hour block
average limit, includes
condensables
Thoroughbred, Elm Road
Particulate matter
<10 microns (PM
<10
)
Fabric Filter Baghouse,
Flue Gas Desulfurization,
Wet ESP
.018 lb/MBtu
20% Opacity
Based on a 3-hour block
average limit, includes
condensables
Trimble County II
Sulfur Dioxide (SO
2
)
Washed Coal and Wet
Flue Gas Desulfurization
.1 lb/MBtu
98% Removal
30-hour rolling average,
including SU/SD
Trimble County II
Volatile Organic
Compounds (VOC)
Low NO
X
Burners
and Good Combustion
Practices
.0032/lb MBtu
24-hour rolling average
excluding SU/SD
Trimble County II
Lead (Pb)
Fabric Filter Baghouse,
Flue Gas Desulfurization
3.9 lb/TBtu
Based on a 3-hour block
average limit
Thoroughbred
Mercury (Hg)
Fabric Filter Baghouse,
Flue Gas Desulfurization
1.12 lb/TBtu (Based on
90% Removal, Final Limit
is Operational Permit)
Stack testing,
coal sampling
&
analysis
Elm Road
Beryllium (Be)
Fabric Filter Baghouse,
Flue Gas Desulfurization
9.44x10
-7
lb/MBtu
Stack testing,
coal sampling
&
analysis
Thoroughbred
Fluorides (F)
Fabric Filter Baghouse,
Flue Gas Desulfurization
0.000159 lb/MBtu
Stack testing,
coal sampling
& analysis
Thoroughbred
Hydrogen Chloride (HCl)
Flue Gas Desulfurization
6.14 lb/hr
Stack testing
based on a 24-hour
rolling average
Thoroughbred
Sulfuric Acid Mist
(H
2
SO
4
)
Flue Gas Desulfurization
and
W
et ESP
.004 lb/MBtu .004 lb/MBtu Trimble County II
Figure 1.7
8
E
LECTRICITY GENERATION