Energy Options for the Future phần 5 pot
Bạn đang xem bản rút gọn của tài liệu. Xem và tải ngay bản đầy đủ của tài liệu tại đây (583.51 KB, 7 trang )
at the Lawrence Livermore National Laboratory
(LLNL), is aimed at achieving ignition within 10–
15 years, see Figure 46.
‘‘Fast ignition’’ is an option that may allow the
driver energy to be reduced by separately compress-
ing then rapidly heating the target locally. Using a
petaWatt driver.
The primary effor ts in this area are in the
U.S., France and Japan The major U.S. sites are
at the Lawrence Berkeley National Laboratory
(heavy ions), LLNL (solid-state lasers), Naval
Research Laboratory (KrF lasers), Sandia National
Laboratories (Z-pinch X-rays), University of
Rochester (capsule irradiation), and General Ato-
mics (capsule fabrication). Example drivers are
shown in Figure 47.
Progress
Progress has been systematic in both magnetic
and inertial fusion in experiment, technology and
theory. However, the pace of progress has been
slowed by inadequate funding for timely commit-
ments to the construction of new facilities, some
important technology areas, and radiation resistant
materials. Advances in computers and scientific
computation are allowing more rapid progress in
the understanding of plasmas and system compo-
nents and the ability to make projections. An
example of computation in IFE is in Figure 48.
Issues
For magnetic fusion, the primary issue is
optimizing the configuration for effective confine-
ment of the fuel. For inertial fusion, the primary
issue is optimizing the techniques for compressing
the fuel in a stable manner. For both approaches,
an important additional issue is identifying materi-
als that provide long life and low induced radio-
activity in the harsh neutron-rich environment.
Fig. 47. Inertial fusion facilities.
Fig. 46. National Ignition Facility.
103Energy Options for the Future
Overall a major issue is optimizing the total capital
cost of a system with high availability.
Projections
A number of projections of the tim e to power
plant operation have been made, though there is no
official government timetable for fusion Ther e are
large uncertainties in these projections due to tech-
nical unknowns and to a lack of firm funding
commitments. The projections range from 15 to
50 years, with a mean around 30–35 years. Example
projections, assuming the required funding are shown
in Figures 49 and 50.
HOW DO NUCLEAR POWER PLANTS EMIT
GREENHOUSE GASES? P.L. DENHOLM AND
G. KULCINSKI (U. WISCONSIN)
There have been numerous inaccurate state-
ments that have been published about how nuclear
power and renewable energies are carbon-free. In
reality, in the present energy system, fossil fuels will
have been used in building the plant—electricity
coming typically 56% from coal plants, transporta-
tion using oil products, etc. even if there are no such
emissions from producing electricity e.g., as for wind
power. The study discussed in this presentation
considers all stages of the ‘‘fuel cycle’’ in construction
of the power plant as shown in Figure 51.
Fig. 49. ITER project office magnetic fusion roadmap, December 2003.
Fig. 48. Good progress has been made.
104 Sheffield et al.
The energy input to six power plants was
analyzed:
Coal—El-Bassioni, NUREG/CR-1539, 1980.
Natural Gas—2 · 1 combined cycle, Cass
County, MO.
Fission—Brian, ORNL TM-4515, 1974.
Fusion—2 tokamaks (Aries -RS and
UWMAK-1).
Wind—Buffalo Ridge Wind Farm, South-
western MN.
Photovoltaic—Big Horn Center, Silver-
thorne, CO; a roof unit.
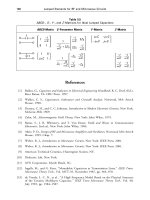
An example of a process chain analysis for
material co mponents of a gas plant is given in
Table 5. It uses information on the typical amount
of energy used to produce a tonne of each material,
coupled with the amount of material used in the
plant. An alternative approach, uses an analysis for
major components based on information on en ergy
investment per dol lar of cost.
The CO
2
emissions are calculated from both
electrical and thermal inputs as shown in Figure 52.
Relative to the CO
2
emissions of coal and natural
gas, those from nuclear and renewable energies are
low but not zero, see Figure 53. Note that, given
Fig. 50. The path to develop laser fusion energy UNNRL-2003.
Fig. 51. Life-cycle analysis considers all stages of the ‘‘Fuel cycle’’.
105Energy Options for the Future
uncertainties in the calculations, no weight should be
given to small differences in the numbers!
In the case of intermittent energies it may be
necessary to use energy storage. [It was pointed out
that in a strong grid system typically 20% of the
electricity can be from intermittents, particularly
when it is known when they will be producing].
In this study the following storage technologies
were analyzed:
Pumped storage, which is >99% of utility
storage world-wide with about 100 GWe.
The U.S. capacity is 18GWe from 36 facili-
ties with sizes ranging from about 200 MWe
to 2100 MWe.
Compressed Air Energy Storage (CAES),
which is usually a hybrid storage/generation
technology and consumes natural gas. There
are 2 facilities world -wide with 400 MWe to-
tal capacity. There are plans for 3 facilities
in the U.S. including a 2700 MWe plant in
Ohio (the model for this study). The system
requires a large storage cavern in hard rock
or a salt dome.
Battery Energy Storage Systems (BESS)—
lead acid, flow batteries, vanadium, Regene-
sys. Partially through the USABC program
a number of new technologies, with longer
life and greater efficiency, have become
competitive.
Fig. 52.
Table 5. Example of process chain analysis.
106 Sheffield et al.
Likely renewable energy+storage scenarios
which were analyzed are:
Wind+PHS, sho wn in Table 6.
Wind+CAES.
Solar PV+Battery.
In the example shown, the emissions rate
increased from 14 to 20 tonnes of CO
2
equivalent/
GW he. For the case where a CAES system was used
the increase was to 109 tonnes of CO
2
equivalent/
GW he, because of the use of gas. For the case of
batteries there are significant construction related
energy requirements and emissions, and in the PV +
batteries case the emission rate rises from 39 to more
than 136–152 tonnes of CO
2
equivalent/GW he.
In the discussions it was pointed out that with CO
2
sequestration the emissions rate from coal and gas
would be very much reduced e.g., with 97% sequestra-
tion to 88 and 47 tonnes of CO
2
equivalent/GW he
respectively.
An interesting approach to displaying what it
would take to achieve policy goals such as those of
Kyoto, is to use a ‘‘triangle plot,’’ see Figure 54.
Fig. 53. CO
2
are calculated from both electrical and thermal inputs.
Table 6.
107Energy Options for the Future
[Note that if sequestration were used then the curves
would shift allowing the goals to be met with a lower
percentage of nuclear and renewables].
GENERAL DISCUSSION
Cost of Electricity: Numerous studies have been
made of potential fusion power plants. In these
studies, it is the normal practice to calculate a cost of
electricity (COE). The main purpose of these calcu-
lations is to help in understanding the relative
importance of achieving a certain performance in
the various components of the power plant. In
addition, it is important to understand what would
be necessary in order to achieve a COE that is in the
ballpark of other sources of electricity. This aspect
leads to the question of ‘‘what is the ballpark?’’
In the discussion of this topic, a number of
points were made:
COE is not the only factor that determines
choice of a new power plant. Environmental
considerations, including waste disposal,
public perception, balance between capital
cost and operating cost, reliability and vari-
ability of cost of fuel supply, regulation, and
politics also play important roles. This is
seen very clear ly for the case of fission
plants.
In the U.S., the COE varies widely from re-
gion to region. The COE can vary owing to
changes in demand and its production costs
can depend strongly on fuel costs—as seen,
recently in the cases of both coal and gas.
In summary, it will be necessary for fusion
energy to be competitive but the other factors may be
as important in determining its deployment when it is
developed. Competitive does not mean that if another
source has a COE of around 5 c/kW.h., fusion would
have to come in at most 4.9 c/kW.h
Waste disposal: One advantage cited for fusion is
its relative safety and environmental advantages over
fission energy. A discussion was held on what this
meant. It was noted that, while the fuel rods require
special storage and disposal—ul timately a depository
such as Yucca Mountain, the other material activated
in a fission reactor can be disposed of much more
readily. Further, in activated structural materials the
radioactivity is bound up in the material and could not
be dispersed easily. Fusion power plants do not
contain the uranium, plutonium, actinides and other
products of fission. By careful choice of materials the
radioactivity can have a lifetime much shorter than
fission products and most of it will be bound up in
solid structures. In fact, it is conceivable that these
waste materials could be dispose d of by shallow burial
and possibly be retained on site until they had decayed
to an acceptable level to be reused. This is important
Fig. 54.
108 Sheffield et al.
because the bottom line for a utility will be that there
must be a clear route to handling the wastes.
Distributed generation: There are some who
believe that distributed generation i.e., not grid
connected, will become a larger part of electricity
supply in the future. Reasons for this trend include:
The need for high quality, guaranteed power
for sensitive equipment.
Making it more difficult for terrorists to dis-
rupt supply.
Taking advantage of combined heat and
power-co-generation.
Such a trend would probably favor smaller
unit size power plants and be less favorable
to fusion systems. In the discussion a num-
ber of points were made:
There are numerous, successful co-generation
systems that are grid connected.
Distributed does not have to mean small. Sizes
up to 600 MWe exist. Co-generation can also
be large and in Russia some nuclear plants are
used to also provide district heating.
It would be hard to implement a completely
distributed system in a big city. Switching to
natural gas does not alter that conclusion.
Unless the gas were delivered in bottles it
would simply change from an electric grid to
a gas grid.
Future improvements to the grid can make
it more attractive.
In summary, it was concluded that distributed
power may well play a valuable role but probably, on
average, only at the 10s% level. There will continue to
be a major role for grid-connected large power plants.
Hydrogen: The attractiveness of large fission and
fusion plants can be enhanced by using them to co-
produce hydrogen. This would also allow them to do
some load-following. A possible plus for fusion, for
high temperature hydrogen production, could be the
ability to allow a part of the neutron capture region
to run at higher temperatures than the walls e.g.,
1800–2500 °C.
The issue of the safety of hydrogen pipelines was
raised. At high enough pressures a small leak can lead
to spontaneous combustion of the leaking hydrogen.
It was noted that pipelines many 10s of kilometers in
length have been operating for decades—presumably
at lower pressures.
International collaboration: There is a growing
trend towards undertaking the development of the
big new power systems with widespread international
collaboration—advanced, clean coal plants, Gen-IV
fission reactors and, in fusion, the Inter national
Thermonuclear Experimental Reactor. A discussion
was held on the pros and cons of such an approach.
The following comments were made:
It is politically good even though, in total
across the participant s, it may cost more.
It can benefit from the combined technical
strengths of the participants. Even the Uni-
ted States does not retain all industrial capa-
bilities and many major industrial companies
have a multi-national base.
In the case of the moon program, the U.S.
went it alone, why can’t we do it for energy
areas? The total cost to the U.S. of developing
advanced fossil, fission and fusion plants
could be less than a major defense acquisition.
It makes great sense sharing costs for R&D.
As the system nears demonstration and com-
mercialization is it necessary to reduce the
collaboration for our industries to gain man-
ufacturing advantages?
One view is that we are living in a globalized
society and having the ability to be competi-
tive in the world market means we will bene-
fit from doing things internationally all
along.
109Energy Options for the Future