Engineering Drawing for Manufacture phần 8 pdf
Bạn đang xem bản rút gọn của tài liệu. Xem và tải ngay bản đầy đủ của tài liệu tại đây (1.06 MB, 17 trang )
Surface finish specification 113
6.2 Measuring the surface finish
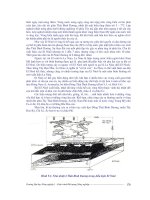
The most common method of assessing the SF is by traversing a
stylus across a surface. A typical stylus is shown in the scanning
electron microscope (SEM) photograph in Figure 6.2 (courtesy of
Hommelwerke GmbH). The stylus tip is made of diamond having a
tip spherical radius of 5um and an included cone angle of 90 ~ Styli
are available in a standard range of spherical radii of 2, 5 and 10um
and included cone angles of 60 ~ and 90 ~ (ISO 3274:1996). The
stylus is shown in contact with a ground surface that gives an indi-
cation of the scale of the surface features. The stylus is positioned at
the end of a mechanical arm that connects to a transducer such that
the undulations on the surface are translated into an electrical
signal. This signal is amplified and eventually displayed on a PC
screen along with the calculated parameters.
6.2.1 Sample length and evaluation length
Considering the case of a flat surface, the traverse unit drives the
stylus over a distance called the
evaluation length
(EL). This length is
Figure 6.2
A scanning electron microscope photograph of a stylus (courtesy of
Hommelwerke GmbH)
114 Engineering drawing for manufacture
divided into five equal parts, each of which is called a
sampling length
(SL). In ISO 4287:1997, the sample length is defined as the
'length
in the direction of the X-axis used for identifying the irregularities character-
ising the profile under evaluation'.
The evaluation length is defined as
the
'length in the direction of the X-axis used for assessing the profile under
evaluation'.
The SL length is significant and is selected depending upon the
length over which the parameter to be measured has statistical
significance without being long enough to include irrelevant
details. This limit will be the difference between roughness and
waviness. In Figure 6.3, the waviness is represented by the sine wave
caused by such things as guideway distortion. The roughness is
represented by the cusp form caused by the tool shape and micro-
roughness by the vees between cusps caused by tearing. The SL over
which the profile is assessed is critical, if it is too large (L1) then
waviness will distort the picture, if it is too small (L2) then the
unrepresentative micro-roughness will only be seen. The correct SL
is that length over which the parameter to be measured is signif-
icant without being so long as to contain unwanted and irrelevant
information. The length (L3), containing several feed-rate cycles,
would be a suitable representative length. The drift due to the wave-
length would be filtered out.
The default SL is 0,8mm. This is satisfactory for the vast majority
of situations but for processes that use a very small or a very large
feed, this is inappropriate. Information on how to determine the
correct SL for non-standard situations is given in ISO 4288:1996.
6.2.2 Filters
A filter is a means of separating roughness from waviness.
Mummery (1990) gives the useful analogy of a garden sieve. A sieve
Feedrate
ROU~lhness -~ ~ _~_
Waviness
t.2
Figure 6.3
The effect of different sampling lengths
Surface finish specification 115
separates earth into two piles. One could be called rock and the
other dirt. The sieve size and therefore the distinction between dirt
and rock is subjective. A gardener would use a different sieve size in
comparison to a construction worker. With reference to machine
surfaces, a sieve hole size is analogous to the filter. Figure 6.4 shows
the results of different types of filters.
The simplest filter is the
2CR filter.
It consists of two capacitors
and two resistors. With the 2CR filter, there is 75% transmission for
a profile with a 0.8mm wavelength. This is because all filter design is
a compromise; 100% transmission up to the cut-off value and
nothing after is impractical. In practice, the 2CR filter produces a
phase shift and overshoot because it cannot read ahead. The 2CR
filter is not mentioned in the latest standards.
The
phase corrected (PC)filter
(ISO 11562:1996) overcomes some
of the disadvantages of the 2CR filter in that it can look forward. It
does this by the use of a window or mask similar to that used in
digital image processing. The mask or window of a PC filter is called
a weighted function.
The mask is 1D and consists of a series of weights
arranged in a Gaussian distribution. Each weight is applied to each
profile point over the length of the window. Shifting the mask step
by step scans the profile.
9 Unfiltered profile
2 Rc fl~er
~~,~ ~ ~~ ~~'~~Phase
Co=ected
Figure 6.4
The effect of 2CR, phase corrected (PC) and valley suppression (VS)
filters on a profile
116 Engineering drawing for manufacture
The PC filter will still produce errors particularly with the highly
asymmetric profiles. For example, deep valleys will cause a
distortion because of their comparative 'weight' within the mask. To
overcome the above disadvantage, a double filter is applied which
has the effect of suppressing valleys even further. This is called the
valley suppression (VS) filter or the double Gaussian filter. It is
defined in ISO 13565-1:1996.
Figure 6.4 (Mummery, 1990) shows a comparison of the 2CR, PC
and VS filters when applied to a plateau-honed surface. The 2RC
filter produces a 'bump' distortion in the region of the centre-left
deep valley. This distortion is reduced but not eliminated by the PC
filter in that a slight raising of the profile can still be seen at the
same centre-left valley. The double filter reduces this to an almost
negligible amount.
6.3 Surface finish characterization
Once a satisfactory profile is obtained, it can be analysed and repre-
sented by a variety of means. This raises the question of what
particular number, parameter or descriptor should be used.
Unfortunately, there is no such thing as a universal parameter or
descriptor and one must select from the ones published in the ISO
standards.
With reference to Figure 6.5, the ADF (Amplitude Distribution
Function or height distribution function) is a histogram where the
value of p(y) represents the fraction of heights lying in the stratum
between y and (y + dy). If the ADF is integrated, the BAC or
Abbott-
Firestone Curve
or
Material Ratio Curve
is obtained. The BAC can also
LI I_2 L3 ~ Li/Lt
-~II ~- -~II ~- -~II ~- ~_-~_ _I~___
-~~
_
1:- 1 o ,
Height Distribution Bearing
Area
Profile
Function (HDF) Curve (BAC)
Figure 6.5
A profile and the corresponding height distribution function and
bearing area curve
Surface finish specification 117
be generated by slicing the profile in a straight line parallel to the
mean from the highest peak down, plotting the total length revealed
as a fraction of the profile length under consideration. This is the
equivalent of a perfect abrasion or wear process. Examples of the
graphical outputs as well as parameters are shown in Figure 6.6. This
is a trace from a fine-turned surface, showing the conventional
turning unit event 'cusp' surface form. The peak spacing is approxi-
mately 115um and the peak to valley height is 45um.
Q
Q
Profile Trace of a Fine-Turned Surface
9 0:,o o.,o
,.=0 i.,0 -'.~o =.,o
z:,o ~.'zo ~:~o Zoo
(~0
= /FILTER
Amplitude Distribution Function
' ! 24.38um
1 2.9 t
g
8 5.8 18.8
Ra e.~
3g',67
31.84
31 .~?.
44.64
"E
~ 38.22
41.99
3 33.64
39.49
35.83
26.52
8.12
HEIGHT
~D
9 ~ /FILTER
,,
I 24.gBuR
2Z.4
~ ,
,
I
~
I,,,
0
58'
Bearing Area Curve
Ra 8.78
R'c 44.64
HSC 35
TP18 33.13
29,12
Tlr38 24.17
28,21
15.83
12,92
11)79 18 ,~.
11~ 8,54
BEf~IIt6
188 Fr, eq
Figure 6.6
A profile of a fine-turned surface and the corresponding ADF and BAC
s T'Oes
118 Engineering drawing for manufacture
6.3.1 2D roughness parameters
The range of parameters calculated from a trace may be repre-
sented by the equation:
parameter = TnN
where"
m 'T' represents the scale of the parameter. If the trace is unfil-
tered, the designation 'P' is used. After filtering, the parameters
calculated are given the designation 'R' for roughness or 'W' for
waviness. If parameters relate to an area, the designation 'S' is
used.
m 'n' represents the parameter suffix which denotes the type calcu-
lated, e.g.
average
is 'a',
RMS
is 'q',
Skew
is 'sk', etc.
m 'N' refers to which of the five SLs the parameter relates to, e.g.
the RMS value of the third sample is Rq3.
Over the years, hundreds of roughness parameters have been
suggested. This has prompted Whitehouse (1982) to describe the
situation as a 'parameter rash'! The standard ISO 4287:1997
defines 13 parameters which are shown in the table in Figure 6.7.
These parameters are the most commonly used ones and the ones
accepted by the international community as being the most
relevant. They are divided into classes of heights, height distri-
bution, spacing and angle (or hybrid). It should be noted that there
are other parameters, based on shapes of peaks and valleys, which
are more relevant to specific industries like the automotive (ISO
13565-2:1996 and ISO 12085:1996).
6.3.1.1 2D amplitude parameters
The table in Figure 6.8 gives the definitions of the ISO 4287:1997
height parameters. The centre line average (Ra) is the most
common. It is defined in ISO 4287:2000 as the
'arithmetic mean devi-
ation of the assessed profile'.
Over an EL, there will normally be five Ra
values, Ral to Ra5. The root mean square (RMS) parameter (Rq) is
another average parameter. It is defined in ISO 4287" 1997 as the
'root mean square deviation of the assessed profile'.
There will normally be
five Rq values" Rql to Rq5. The Rq parameter is statistically signif-
icant because it is the standard deviation of the profile about the
mean line.
Surface finish specification 119
PARAMETER CLASS
Heights
PARAMETERS IN ISO
4287
Ra, Rq, Rv, Rp, Rt, Rz, Rc
Height Distribution Rsk, Rku, Rmr, Rmr(c)
Rsm
Spacing
Hybrid
ii ,,,
RAq
Figure 6.7
The 2D roughness parameters given in ISO 4287:2000
With respect to parameters which measure extremes rather than
averages, the Rt parameter is the value of the vertical distance from
the highest peak to lowest valley within the EL (see Figures 6.8 and
6.9). It is defined in ISO 4287:1997 as the
'total height of profile'.
There will be only one Rt value and this is THE extreme parameter.
It is highly susceptible to any disturbances. The maximum peak to
valley height within each SL is Rz (see Figures 6.8 and 6.9). It is
defined in ISO 4287" 1997 as the
'maximum height of the profile'.
There
are normally five Rz values, Rz 1 to Rz5, or Rzi. With reference to the
fine-turned profile of Figure 6.6, the Rzi values are shown as Ryi, a
former designation.
Material above and below the mean line can be represented by
peak and by valley parameters (see Figures 6.8 and 6.9). The peak
parameter (Rp) is the vertical distance from the highest peak to the
ll[o]llil :il[~_ :/| ~-,l-'l,.llli111~
Parameter ]
, ,,
Ra Centre Line
Average
Rq RMS
Average
Rt EL peak to valley height
Rz SL peak to valley height
Rp Peak height
IRv " Valley depth
Description
Ra- 1 lYil = yidx
n i=l
= ,10f
Peak to valley height within the EL
Peak
to valley
height within a SL
Highest
peak to
mean line height
Lowest valley to mean line depth
Figure 6.8
The 2D height parameters given in ISO 4287:2000
120
Engineering drawing for manufacture
0~1
N
nr"
t
SL1 SL2
,~.,,, ~ _ ,,., _
,,. ,,,, ,.,= v
nr"
03
N
tr
ol
_
SL3
=,, _
.,,
EL
N
rr
,q.
SL4
; t = ,
! I
.~,_
SL5
.~,
Figure 6.9
A schematic profile and the parameters Rt, Rz, Rv, Rp
mean line within a SL. It is defined in ISO 4287"1997 as the
'maximum profile peak height'.
The valley parameter, Rv, is the
maximum vertical distance between the deepest valley and the
mean line in a SL. It is defined in ISO 4287:1997 as the
'maximum
profile valley depth'.
6.3.1.2 2D amplitude distribution parameters
With respect to a profile, the sum of the section profile lengths at a
depth 'c' measured from the highest peak is the material length
(Ml(c)). In ISO 4287:1997 the parameter Ml(c) is defined as the
'sum
of the section lengths obtained by a line parallel to the axis at a given level,
"c"'. This is the summation of 'Li' in Figure 6.5. If this length is
expressed as a percentage or fraction of the profile, it is called the
'material ratio'
(Rmr(c)) (see Figure 6.10). It is defined in ISO
4287:1997 as the
'ratio of the material length of the profile elements Ml(c)
at the given level
"c"
to the evaluation length'.
In a previous standard,
this Rmr(c) parameter is designated 'tp' and can be seen as TP 10 to
TP90 in the fine-turned BAC of Figure 6.6.
The shape and form of the ADF can be represented by the
function moments (m~)"
m N
l !y N dx
1 Y7 L
n i=t
where N is the moment number, y~ is the ordinate height and 'n' is
the number of ordinates. The first moment (ml) is zero by defi-
nition. The second moment (m2) is the variance or the square of the
Surface finish specification
121
PRORLE HEIGHT' DISTRIBUTIO'N' PARAMETERS '
Para meter Description
J
,,, i ,,,, -
1
n
= ~ -
M/(c)
Material ratio
at'depth 'c'
Rmr(c) ~ ~ Lj
i=1 Ln
Rsk Skew
1 [1~ 1 1 [-~rLfoy
]
Rsk=~ yi 3 =~ 3dx
Rq 3 i=1 Rq 3
Rku
Kurtosis
.,u=
"q'
Figure
6.10
The 2D height distribution parameters given in ISO 4287:2000
standard deviation, i.e. Rq. The third moment (m~) is the skew of the
ADE It is usually normalised by the standard deviation and, when
related to the SL, is termed Rsk. It is defined in ISO 4287:1997 as
the
'skewness of the assessed profile'.
For a random surface profile, the
skew will be zero because the heights are symmetrically distributed
about the mean line. The skew of the ADF discriminates between
different manufacturing processes. Processes such as grinding,
honing and milling produce negatively skewed surfaces because of
the shape of the unit event/s. Processes like sandblasting, EDM and
turning produce positive skewed surfaces. This is seen in the fine-
turned profile in Figure 6.6 where the Rsk value is +0.51. Processes
like plateau honing and gun-drilling produce surfaces that have
good bearing properties, thus, it is of no surprise that they have
negative skew values. Positive skew is an indication of a good
gripping or locking surface.
The fourth moment (m4) of the ADF is
kurtosis.
Like the skew
parameter, kurtosis is normalised. It is defined in ISO 4287:1997 as
the
'kurtosis of the assessed profile'.
In this normalised form, the
kurtosis of a Gaussian profile is 3. If the profile is congregated near
the mean with the occasional high peak or deep valley it has a
kurtosis greater than 3. If the profile is congregated at the extremes
it is less than 3. A theoretical square wave has a kurtosis of unity.
122
Engineering drawing for manufacture
6.3.1.3 2Dspacingparameters
Figure 6.11 shows a schematic profile of part of a surface that has
been turned at a feed of 0, l mm/rev. The cusp profile is modified by
small grooves caused by wear on the tool. The problem with this
profile is that there are 'macro' and 'micro' peaks, the former being
at 0,1mm spacing and the latter at 0,01 lmm spacing. Either could
be important in a functional performance situation. This begs the
question, 'when is peak a peak a peak?' To cope with the variety of
possible situations, many spacing parameters have been suggested
over the years. However, it is unfortunate that in the ISO standard
only one parameter is given. This is the average peak spacing
parameter RSm that is the spacing between peaks over the SL at the
mean line. It is defined in ISO 4287:1997 as the
'mean value of the
profile element widths within a sampling length'.
With respect to Figure
6.11, if the 0,2mm were the SL, there are 10 peaks shown and hence
RSm = 0,02mm.
6.3.1.4 2D slope parameters
The RMS average parameter (RAq) is the only slope parameter
included in the ISO 4287:1997 standard. It is defined as the
'root
mean square of the ordinate slopes dz/dx within the sampling length'.
There
will normally be five RAq values for each of the SL values: RAq 1 to
RAq5. The RAq value is statistically significant because it is the
standard deviation of the slope profile about the mean line.
Furthermore, the slope variance is the second moment of the slope
distribution function. In theory, there can be as many slope param-
eters as there are height parameters because parameters can be just
as easily be calculated from the differentiated profile as from the
original profile.
v-" ~1 Cej
_
_ z
[
RSm =20um
I Feed=O,lmm ]
Figure 6.11
The 2D spacing parameter given in ISO 4287:2000
Surface finish specification
123
6.4 Tolerances applied to the assessment of surface finish
The SL sets the limits for the horizontal length to be considered
along the surface. By definition, there also needs to be limits defined
in the other direction (the vertical). This defines the deviation
allowed perpendicular to the surface. This will be the SF tolerance.
Like any length dimension, the SF tolerance needs to be in the form
of a tolerance band or range within which the 2D parameter may
vary. There are two types of tolerance. Firstly, there is an upper one
that the measured value must not be greater than and secondly, an
upper one and a lower one that the measured value must not be less
than. In the first case, there is only one value and this is the upper
one. No lower one is specified but, in the case of, say, height param-
eters it is effectively zero because this is the lowest practical limit.
The standard ISO 4288" 1996 provides flexibility with respect to
the acceptance or rejection of the measured surface when compared
with a tolerance because there are two rules specified in the
standard, the '16%-rule' and the
'max-rule'.
The '16%-rule' allows
some of the values to be greater than the upper limit or less than the
lower limit (see Figure 6.12). With respect to the upper limit, the
surface is considered acceptable if not more than 16% of the
measured values of the selected parameter exceed the value spec-
ified on an engineering drawing. With respect to the lower limit, the
p,1
1
2D Surface ~
Parameter
-_ ,~ =
Value
Upper limit of
y
parameter
Figure
6.12
The 16%-rule and the upper limit for two distributions (ISO
4288:1996)
124
Engineering drawing for manufacture
surface is considered acceptable if not more than 16% of the
measured values of the selected parameter are less than the value
specified. In cases where the surface parameter being inspected
follows a normal distribution, the 16%-rule means that the upper
limit is located at a value of the ~ + o where Ix is the mean value and
o" is the standard deviation of the values. The greater the value of
the standard deviation, the further from the specified limit the
mean value of the roughness parameter needs to be.
6.5 Method of indicating surface finish and texture
Section 6.3.1 above described parameters using
'TnN'.
However, no
information was given concerning how these are added to features
on a drawing. The methodology to do this is described in ISO
1302:2001. It is based on what is termed a 'tick symbol' that defines
the SF and points to the surface in question via a leader line.
Figure 6.13 shows the tick symbol with various descriptors
surrounding it. The tick symbol is placed on the surface or an
extension drawn to it. The basic tick comprises two lines at 60 ~ to
each other. This basic open tick (Figure 6.13a) has no significance of
its own. Closing the tick symbol (Figure 6.13b) indicates that the
surface must be machined. If machining is prohibited for some
reason, for example, residual stresses must not be added, a circle is
placed over the tick (Figure 6.13c). When additional information is
to be added, a horizontal line is added to the right tick arm (Figure
6.13d). When the same surface texture is required on all surfaces
around a workpiece, represented on an orthographic 2D drawing
by a closed outline, a circle is added to the symbol at the junction of
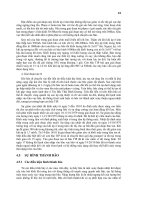
the tick and the horizontal line (Figure 6.13e). It is the symbol that
means 'all surfaces around a workpiece outline'. For example,
consider the gauge shown in Figure 6.14. A surface roughness 'tick'
symbol is added to the top face. Because the tick has the small circle
on it, the surface roughness requirement applies the eight faces
around the front view but not the front face, shown as face (a), nor
the back face, shown as face (b).
Additional information can be added to the closed tick symbol
and arm as shown in Figure 6.15 as follows:
Positions 'a, b and c' -
the surface texture parameters, numerical
values, transmission band and SL information are placed at
Surface finish specification
125
,'/
//
(a) The basic 'tick' symbol
,'/ //
(c) Removal not permitted
,-/
(e) Finish requirement applies to
all four surfaces in the orthographic
projection view.
Figure 6.13
The 'tick'symbol of ISO 1302:2001
,'/ //
(b) Material to be removed
"/
(d) Extension added indicating
additional information.
C
,%
Back face 'b'
~ Front face
'a'
,/
Figure 6.14
A component that has the same surface finish requirement on 8 of its
l O faces
126
Engineering drawing for manufacture
d
C
f
KEY
II J!
a = 2D parameter 1
b = 2D parameter 2
c = 2D parameter 3
d = process
e = lay pattern
f = allowance
x = not al lowed
Figure
6.15
The position of additional information to be added to the 'tick' symbol
positions a, b and c. If only one single SF parameter is to be
specified, then the numerical value and the transmission band
and SL are to be indicated in the complete graphical symbol at
position a. The transmission band or SL is to be followed by an
oblique stroke followed by the surface parameter designation,
followed by its numerical value. If a second surface parameter is
to be specified it should be located at position b. If a third is
required it will be located at position c. If a fourth is required the
graphical symbol is enlarged in the vertical direction to make
room for more lines.
Position 'd'-
at this position the manufacturing method,
treatment, coating or other requirement is located, e.g. turned,
ground, plated, etc.
Position
'e'- at this position information concerning the lay and
orientation is given. A symbol represents the lay pattern. There
are seven lay classes represented by the symbols: '=, .1, X, M, C,
R and P'. These are shown in the table in Figure 6.16.
Position 'f -
at this position the required machining allowance is
indicated as a numerical value in millimetres. The machining
Surface finish specification
127
allowance is generally indicated only in those cases where more
than one processing stage is shown on one drawing. Machining
allowances are therefore found, for example, in drawings of raw,
cast or forged workpieces.
Position 'x'-
no SF indications are to be added above the tick
symbol at position x. This may seem a peculiar thing to say but
in previous standards, only the Ra value was to be placed at this
position, all other parameters were to be placed at a different
position. This implied that the Ra value had a prominence over
other parameters and that it was the most important parameter
of all.
The full designation attached to positions a, b and c of a tick symbol
could contain up to seven elements. Consider the following as an
example:
U 'X'0,08-0,8/Rz2max 3,3
i
Graphical
Symbol
m
m
X
M
C
R
i
Interpretation
Parallel to the plane of projection of the view in
which the symbol is used.
Perpendicular to the plane of projection of the
view in which the symbol is used.
1
Lay Pattern
Crossed in two oblique directions relative to
the plane of projection of the view in which
the symbol is used.
Multi-directional.
Approximately circular relative to the centre of
the surface to which the symbol applies.
Approximately radial relative to the centre of
the surface to which the symbol applies.
O
p
Lay is particulate, non-directional or protuberant. ~-'71
/x \/V
,,,~'2~ L"
,
Figure 6.16
Symbols for surface lay according to ISO 1302:2001
128
Engineering drawing for manufacture
The interpretation of this is as follows. The first specification, the
'U', means the upper specification limit that applies to the
parameter Rz in the second SL (Rz2). In this instant there is no
lower value and the Rz parameter in theory could be 0. If there is a
lower limit then the capital letter 'l~' is shown. If neither 'U' nor 'I~' is
shown, it is assumed to be the upper limit (U). The second specifi-
cation, shown as 'X' in the above is the filter (see Section 6.2.2
above). It should be noted that a range of something like 12 filter
standards will be published as Technical Specifications (ISO 16610)
in 2002 and 2003. The third and fourth specifications are the trans-
mission band limits, shown in this case as 0,08-0,8. These are the
short wave and long wave filters. The fifth specification is the 2D
parameter itself, in this case the Rz value in the second SL. The
sixth specification in the above is the'l 6% rule' or the 'max-rule', in
this case the 'max-rule'. The seventh specification is the parameter
limit value, in this case 3,3um (Rz2).
Figure 6.17 shows examples of the use of the tick symbol. The
interpretation shown in Figure 6.17a is as follows. The process is not
specified therefore any which meets the roughness specification is
acceptable. The parameters specified apply to the roughness
U R a max 3,1
L RaO,9
(a)
milled
/0,008-4 / a a 5,5
\ / 0,008-4/Ra6,2
(b)
VL;
ground
Ra 1,5
\ ~ -2,5 / Rz max 6,7
(c)
VI
Fe/Ni lOb Cr r
/-0,8/Ra 3,1
U -2,5/Rz 18
L-2,5 / az 6,5
(d)
v
Figure 6.17
Examples of tick symbol designations
Surface finish specification
129
profile. The upper limit is a Ra value of 3,1 um using the 'max-rule'.
The lower limit is a Ra value of 0,9um and the '16% rule' applies as
the default. With both the upper and lower limits, the default trans-
mission bands apply and the Ra value is to be examined over the EL
of five SEs. The lay is unspecified so therefore any lay pattern is
acceptable.
The interpretation of the tick symbol shown in Figure 6.17b is as
follows. The upper specification limit is a Ra value of 5,5um and the
lower specification limit is a Ra value of 6,2urn. The '16% rule'
applies to both as the default. In both cases the lower transmission
band is 0,008mm and the upper is 4mm. No SL is specified with
respect to the parameter so the default situation of the EL applies.
Thus, all of the five SL Ra values must be tested. The manufacturing
processes is to be milling such that the surface layer is approxi-
mately circular around the centre. In this case the 'U' and 'E is not
stated because they are obvious.
The interpretation of the tick symbol as shown in Figure 6.17c is
as follows. The surface is to be produced by grinding with the lay
approximately perpendicular to the projection plane. There are two
upper specification limits set by a Ra value and a Rz value. The Ra
value is limited to 1,5um using the default '16% rule'. The upper
and lower transmission bands are the default values. All five SEs are
to be considered. The Rz value is to be limited to 6,7um and the
'max-rule' applies. The upper transmission band is 2,5mm and the
lower transmission band is the default value. All five Rz values in an
EL must be considered.
The interpretation of the tick symbol in Figure 6.17d is as follows.
The surface is to be produced by nickel-chromium plating and no
material is to be removed afterwards. There is one upper limit for
Ra and an upper and a lower limit for Rz. The upper limit for Ra is
3,1urn and '16% rule' applies. The lower transmission band is the
default value and the upper transmission band is 0,8mm. Each of
the five SEs is to be examined for the Ra values. The upper limit is
18um when the lower transmission band is the default value and the
upper transmission band is 2,5mm. The lower limit is Rz of 6,5um
when the lower transmission band is the default value and the
upper is 2,5mm. The '16% rule' applies to the both the upper and
the lower Rz values. All five SEs are to be investigated with respect
to the upper and lower Rz values.