Báo cáo lâm nghiệp: "A model of with even-aged beech stands productivity process-based interpretations" doc
Bạn đang xem bản rút gọn của tài liệu. Xem và tải ngay bản đầy đủ của tài liệu tại đây (1.15 MB, 20 trang )
Original
article
A
model
of
even-aged
beech
stands
productivity
with
process-based
interpretations
JF
Dhôte
Laboratoire
de
recherches
en
sciences
forestières,
ENGREF-INRA,
14,
rue
Girardet,
54042
Nancy,
France
(Received
18
July
1994;
accepted
25
April
1995)
Summary —
In
order
to
describe
the
productivity
of
pure
even-aged
stands
of
common
beech,
a
system
of
three
differential
equations
is
proposed
for
dominant
height,
basal
area
and
total
volume
growth.
The
model
was
derived
and
fitted
to
317
observation
periods
in
29
long-term
experimental
plots
ranging
from
northwest
to
northeast
France.
It
involves
parameters
at
the
forest
and
stand
levels.
Site
index
is
the
asymptote
of
the
height-age
curve.
Model
structure
is
such
that,
for
any
given
height,
some
differences
in
total
volume
yield
exist
between
stands
of
different
productivities.
This
result
is
in
contradiction
with
Eichhorn’s
rule.
However,
in
our
model,
no
parameter
other
than
site
index
is
nec-
essary
to
characterize
stand
productivity.
The
possibility
to
generalize
the
model
to
a
larger
range
of
ecological
conditions
is
discussed
by
a
process-based
interpretation.
The
site
dependence
of
the
parameters
can
be
understood
by
reference
to
carbon-balance
models.
A
linear
relationship
between
basal
area
and
height-growth
rates
is
investigated
by
a
separate
model
of
sapwood
geometry
and
dynamics.
Fagus
sylvatica
L
/
stand
productivity
/
Eichhorn’s
rule
/
growth
and
yield
models
/
carbon-
balance
models
/
sapwood
Résumé —
Un
modèle
de
productivité
des
hêtraies
régulières
avec
des
interprétations
éco-
physiologiques.
Afin
de
décrire
la
productivité
de
peuplements
purs
et
réguliers
de
hêtre,
on
propose
un
système
de
trois
équations
différentielles
pour
la
hauteur
dominante,
la
surface
terrière
et
le
volume.
Le
modèle
a
été
construit
et
ajusté
à
partir
de
317
périodes
d’observations
dans
29
anciennes
placettes
expérimentales
réparties
entre
le
nord-ouest
et
le
nord-est
de
la
France.
Il
comprend
des
paramètres
aux
niveaux
de
la
forêt
et
du
peuplement.
L’indice
de
fertilité
est
l’asymptote
des
courbes
hauteur—
âge.
La
structure
du
modèle
est
telle
que,
pour
une
hauteur
dominante
donnée,
la
production
totale
en
volume
diffère
entre
peuplements
de
fertilités
différentes.
Ce
résultat
est
en
contradiction
avec
la
loi
d’Eichhorn.
Pourtant,
dans
notre
modèle,
seul
l’indice
de
fertilité
est
nécessaire
pour
caractériser
la
pro-
duction
d’un
peuplement. À
partir
d’une
interprétation
écophysiologique,
on
discute
la
possibilité
de
géné-
raliser
ce
modèle
à
une
large
gamme
de
conditions
écologiques.
La
dépendance
des
paramètres
par
rapport
au
milieu
peut
être
justifiée
par
référence
aux
modèles
de
bilan
de
carbone.
La
relation
linéaire
entre
croissances
en
hauteur
et
en
surface
terrière
est
explorée
grâce
à
un
modèle
de
la
géométrie
et
de
la
dynamique
de
l’aubier.
Fagus
sylvatica
L
/ productivité
des
peuplements
/ loi
d’Eichhorn
/ modèles
de
croissance
/
modèles
de
bilan
de
carbone / aubier
INTRODUCTION
The
problem
of
productivity
assessment
is
a
crucial
one
in
the
field
of
growth
and
yield
of
forest
stands.
Four
related
issues
can
be
distinguished: i)
How
can
we
define
pro-
ductivity
of
a
stand?
ii)
How
can
we
mea-
sure
it?
iii)
How
can
we
model
the
compo-
nents
of
productivity?
iv)
What
are
the
relationships
between
the
measured
pro-
ductivity
and
variables
describing
site
(qual-
itative,
eg,
species
association,
and/or
quan-
titative,
eg,
soil
depth,
etc).
This
paper
deals
with
the
first
three
questions,
on
the
basis
of
a
set
of
long-term
experimental
plots
of
even-aged
common
beech.
Definition
of
total
yield
As
stressed
by
Assmann
(1970,
pp
158-
163),
the
practical
definitions,
methods
of
measurement
and
analysis
are
quite
differ-
ent
in
the
cases
of
annual
plant
crops
or
for-
est
stands.
Yield
of
annuals
is
harvested
at
the
end
of
a
season,
so
that
long
series
of
data
are
available.
The
methods
are
quite
sure
and
the
external
factors
such
as
soil
characteristics
or
climate
may
be
used
for
yield
prediction.
As
in
the
case
of
forest
stands,
only
part
of
the
global
yield
is
actually
of
agricultural
interest
(aerial
or
underground,
fruits,
etc),
which
leads
to
additional
vari-
ables
such
as
the
harvest
index
(ratio
between
harvestable
part
and
total
biomass;
see Cannell,
1989).
The
very
long
time
spread
of
forest
development,
from
installation
to
final
har-
vest,
is
a
first,
obvious
difficulty.
Many
nat-
ural
or
man-induced
processes
contribute
to
the
particular
level
of
standing
biomass
which
can
be
measured
in
a
stand:
natu-
ral
mortality,
removals
by
thinnings,
age
and
so
on.
The
structure
of
the
standing
crop
may
also
be
very
diverse:
mixed-
species
stands
with
species
composition
changing
through
time,
uneven-aged
stands
where
even
the
notions
of
age
or
final
har-
vest
cannot
be
defined.
In
almost
pure
even-aged
stands,
which
this
paper
deals
with,
the
present
state
of
the
art
is
based
upon
the
notion
of
total
yield,
sensu
Assmann
(1970,
p
160):
total
yield
is
the
sum
of
the
standing
crop
and
all
past
removals
from
the
date
of
stand
creation
(natural
mortality
and
thinnings).
The
deci-
sion
to
include
mortality
is
important,
since
the
silvicultural
treatment
(initial
spacing,
thinning
weight)
directly
influences
the
rate
of
mortality
and
hence
the
apparent
growth
of
living
basal
area
or
volume.
Practical
and
methodological
problems
related
to
total
yield
The
unit
of
measurement
is
usually
volume
over
bark
to
a
specified
end
diameter.
There
is
a
considerable
variation
in
the
procedures
for
defining
the
volume
of
interest
(stem
only
or
total
tree
volume,
under
or
over
bark,
dif-
ferent
end
diameters).
This
makes
it
diffi-
cult
to
compare
different
data
sets,
not
only
in
the
absolute
amounts,
but
also
in
the
shape
of
curves
with
respect
to
age.
Total
yield
in
basal
area
is
also
considered
(Duplat, 1993).
A
second
problem
lies
in
the
fact
that
vol-
ume
of
trees
or
stands
is
not
measured,
but
estimated
from
volume
tables.
The
accu-
racy
of
volume
tables
may
seriously
limit
what
can
be
deduced
even
from
the
best
series
of
data.
This
is
especially
the
case
when
computing
volumes
for
permanent
plots
on
the
basis
of
"local"
volume
equa-
tions,
that
is,
independent
equations
derived
from
independent
data
samples
at
different
dates
of
measurement:
the
estimation
of
volume
generally
implies
sampling
errors
(selection
of
a
population
of
trees
to
build
the
equation),
measurement
errors
(of
diam-
eters,
heights
and
volumes)
and
modeling
errors.
Christie
(1988)
and
Assmann
(1970,
p
152)
emphasize
that
part
of
the
variability
in
volume
increments
is
due
to
such
arti-
facts
of
calculation.
Total
yield
in
volume
or
basal
area
may
also
be
defined
as
the
integral
of
gross
growth
rate,
which
is
the
apparent
growth
of
living
stand
plus
mortality.
From
this
point
of
view,
growth
and
yield
are
mathemati-
cally
equivalent.
The
integration
of
growth
rate
to
compute
yield
produces
an
integra-
tion
constant,
which
can
reasonably
be
set
to
zero
if
integration
starts
at
a
relatively
early
age.
In
many
permanent
plots,
how-
ever,
the
age
at
beginning
of
observations
is
such
that
a
significant
part
of
yield
is
unknown
(Christie,
1988).
This
leads
to
problems
if
one
wants
to
compare
stands
in
various
conditions
of
site
and/or
silvicul-
ture:
apparent
differences
in
yield
between
stands
may
be
due
partly
or
completely
to
different
amounts
of
the
"missing
yield".
The
major
argument
against using
total
yield
versus
age
as
a
index
of
stand
pro-
ductivity
is
that
it
includes
and
mixes
instan-
taneous
increments,
which
may
have
been
achieved
under
very
different
conditions:
for
example,
silviculture
is
rarely
applied
in
a
uniform
way
on
the
whole
period
of
obser-
vation;
this
is
the
case
in
our
data
set,
where
thinning
weight
was
very
irregular.
If,
for
example,
stand
density
affects
stand
incre-
ment,
it
may
lead
to
differences
in
total
yield
due
to
silviculture
only
and
reflecting
no
dif-
ferences
in
site
potential.
Other
possible
sil-
vicultural
sources
for
differences
in
total
yield
are
the
growing
conditions
at
the
very
young
stages
(plantation
densities,
length
of
the
regeneration
period).
"Eichhorn’s
rule"
At
least
in
the
European
literature,
"Eich-
horn’s
rule"
has
a
major importance
for
the
issue
of
productivity
assessment
and
the
design
of
yield
tables
(Assmann,
1970).
Since
this
concept
will
be
discussed
in
light
of
the
model
presented
in
this
paper,
a
brief
presentation
is
given
here.
For
a
compre-
hensive
analysis
of
the
relevant
literature,
see
reviews
by
Houllier
(1990),
Hautot
and
Dhôte (1994).
Eichhorn’s
rule
may
be
termed
with
the
two
basic
relationships
("Grundbeziehun-
gen")
of
Assmann
(1955):
for
pure,
even-
aged
and
closed
stands
of
a
particular
species,
in
a
given
region,
total
volume
yield
is
a
function
of
dominant
height
only,
what-
ever
the
age
and
site
index
of
the
stand;
hence,
we
have
where
A
is
age,
H0
is
dominant
height,
VT is
total
volume
yield,
μ
s
is
a
vector
of
parame-
ters
depending
on
site
(local
parameters)
and
v is
a
vector
of
parameters
independent
on
site
(global
parameters).
Generally,
only
one
parameter
is
neces-
sary
to
characterize
the
site
dependence
of
μ
s,
the
site
index.
Because
v is
independent
on
site,
the
problems
of
estimating
total
vol-
ume
yield
or
mean
height
are
completely
equivalent
(Assmann,
1970,
p
159).
All
the
variability
of
yield
between
sites
is
deduced
from
the
variability
of
dominant
height.
Thus,
low
productivity
sites
follow
the
same
curve
as
highly
productive
sites
in
the
(H
0,
VT)
plane,
although
the
latter
follow
it
more
rapidly.
Another
important
point
to
stress
in
this
conception
of
stand
productivity
is
that
silvi-
culture
is
not
explicitly
considered.
The
area
of
validity
of
Eichhorn’s
rule
is
restricted
to
closed
stands,
but
no
explicit
model
describes
how
silviculture
would
influence
yield.
In
some
papers
on
yield
tables
design
(see,
eg,
Bartet
and
Pleines,
1972),
it
is
assumed
that
"total
yield
is
independent
on
stand
density,
in
a
large
range
of
stand
den-
sities".
This
additional
assumption
allows
the
use
of
equations
[1]
and
[2]
for
a
larger
range
of
situations
than
the
original
"normal
stands"
of
Eichhorn
(1904).
An
intensive
critique
of
Eichhorn’s
rule
was
undertaken
by
German
scientists
in
the
1950s.
They
progressively
identified
some
consistent
differences
in
total
yield
for
a
given
dominant
height.
These
results
led
to
the
notion
of
yield
level
("Ertragsniveau"),
which
is
indeed
a
measure
of
deviation
from
Eichhorn’s
rule
(Hautot
and
Dhôte,
1994).
Objectives
of
this
study
This
study
on
productivity
is
part
of
a
larger
project
aimed
at
modeling
growth
of
pure
even-aged
stands
of
common
beech,
on
the
basis
of
a
network
of
permanent
plots
observed
since
the
turn
of
the
century
(Dhôte,
1991).
For
the
purpose
of
model-
ing
stand
productivity,
the
data
base
for this
project
was
not
optimal.
Although
the
cli-
matic
conditions
represented
by
the
per-
manent
plots
spread
from
a
mild
atlantic
to
a
semicontinental
climate,
the
ecologic
amplitude
within
each
region
is
limited:
plots
are
located
in
one
or
two
forests,
average
soil
conditions
are
favorable.
Furthermore,
series
of
data
for
volume
or
basal
area
yield
often
started
at
late
ages,
resulting
in
large
amounts
of
the
"missing
yield"
described
in
previous
sections.
This
prevented
us
from
a
direct
analysis
of
total
yield
versus
height,
for
example.
The
anal-
ysis
focused
on
modeling
increments
rather
than
total
yield.
A
preliminary
glance
at
the
yield
table
for
beech,
northern
Germany
(Schober,
1972)
and
at
the
data
discussed
by
Kennel
(1973)
revealed
that
none
of
these
2
sources
verified
Eichhorn’s
rule
(Dhôte,
1992).
So
this
rule
was
not
imposed
as
a
constraint
for
data
analysis:
our
position
was
to
test
a
posteriori
whether
the
model
verified
Eichhorn’s
rule.
We
decided
to
build
a
model
of
the
com-
ponents
of
stand
productivity:
dominant
height,
basal
area
and
volume.
The
objec-
tive
was
a
system
of
differential
equations,
describing
the
interactions
between
the
growth
rates
of
the
three
components.
The
main
factors
affecting
growth
were
the
stage
of
development
(stand
age
or
height)
and
site
factors
assumed
to
vary
at
two
differ-
ent
scales:
climatic
factors
(differences
of
growth
between
climatic
regions)
and
site
index
(differences
of
growth
within
each
region).
The
last
step
of
the
research
was
to
pro-
pose
a
process-based
interpretation
of
the
model.
The
interpretation
was
expected
to
give
us
indications
on
how
the
model
would
behave
outside
the
range
of
the
observed
situations.
This,
we
believed,
was
a
means
to
overcome
the
limitations
of
the
data
base
(narrow
range
of
site
conditions).
MATERIALS
AND
METHODS
Definitions
and
notations
The
following
variables
and
notations
will
be
used:
quadratic
mean
diameter
is
Dg;
stand
basal
area,
G;
stand
volume
over
bark
of
whole
tree
(stem
and
branches)
to
a
final
diameter
of
7
cm,
V;
dominant
height,
H0,
which
is
the
average
height
of
the
100
largest
trees
per
ha
(see
practical
esti-
mation
later).
Basal
area
and
volume
figures
refer
to
the
whole
stand,
ie,
trees
belonging
to
the
main
vegetation
story
and
the
understory.
As
a
result
from
an
analysis
of
individual
tree
growth
(Dhôte,
1991),
the
increments
of
understory
trees
in
beech
are
very
close
to
zero
in
the
range
of
observed
treatments:
their
contribution
to
production
might
be
neglected
in
situations
where
only
the
upper
story
has
been
recorded.
We
will
also
consider
total
yield
in
basal
area
(GT),
which
is
the
sum
of
standing
basal
area
and
basal
area
of
all
trees
removed
in
thinnings
or
dead
since
installation
of
the
plot;
the
same
definition
holds
for
total
volume
yield
(VT).
These
quantities
are
different
from
the
"true"
total
yields
sensu
Ass-
mann
(1970),
mentioned
earlier.
His
starting
point
is
the
creation
of
stand,
ours
is
the
date
of
plot
installation;
therefore,
our
values
will
be
different
from
the
"true"
ones
by
an
unknown
constant,
whereas
the
increments
are
known
exactly,
except
for
measurement
or
estimation
errors.
This
will
not
be
a
major
drawback,
since
most
of
the
analysis
will
focus
on
modeling
increments.
Growth
rates
of
basal
area
(resp
volume)
are
noted
either
as
discrete
increments
ΔG/Δt
(resp
ΔV/Δt)
or
as
differentials
dG/dt (resp
dV/dt).
These
figures
stand
for
gross
increments,
ie
including
mortality.
Material:
a
set
of
permanent
plots
The
French
network
of
permanent
plots
in
com-
mon
beech
was
installed
between
1883
and
1924.
Plots
are
located
in
four
state
forests
ranging
from
Normandy
(atlantic
climate)
to
Lorraine
(semicontinental
climate);
an
intermediate
is
the
north
of
the
Bassin
Parisien,
whose
climate
is
characterized
by
lower
rainfalls
than
the
two
other
areas,
but
high
average
atmospheric
humidity.
These
conditions
are
very
favorable
for
beech
vegetation.
Partial
summaries
of
these
plots
(site
conditions,
treatments,
results)
have
been
issued
by
Arbonnier
(1958),
Pardé
(1962,
1981)
and
Oswald
and
Divoux
(1981).
The
experimenters
wanted
to
gain
some
series
of
data
on
the
production
of
beech
stands
at
various
stages
of
development.
Ultimately,
this
would
lead
to
the
construction
of
yield
tables.
A
special
interest
was
devoted
to
the
phase
of
natural
regeneration
(how
heavy
should
the
shel-
terwood
cuttings
be
in
order
to
allow
a
success-
ful
regeneration?)
and
to
the
tending
of
pole-
stage
stands
(what
is
the
effect
of
different
thinning
regimes
on
yield
and
quality
of
the
remaining
stems?).
The
design
of
the
whole
network
does
not
cor-
respond
to
the
statistical
conception
of
forest
growth
and
yield
experiments:
no
repetitions,
very
few
control
plots,
variability
of
site
conditions
not
clearly
identified
as
an
external
factor
to
take
into
account.
There
are
several
major
reasons
for
this:
i)
No
statistical
background
of
the
analysis
of
variability
was
available
at
that
time;
ii)
few
broad-
leaved
forests
had
been
treated
in
regular
high
forest,
so
that
the
existing
material
imposed
severe
constraints;
iii)
apart
from
the
scientific
objective,
the
experimenters
also
wanted
to
imple-
ment
some
"models
of
treatment"
that
could
be
directly
applied
by
foresters.
The
design
of
the
plots
was
the
following:
In
each
forest,
several
stands
of
different
ages
were
selected
according
to
the
criteria
of
complete
and
homogeneous
canopy,
homogeneous
site
con-
ditions,
origin
from
seed
(natural
regeneration)
and
dominance
of
beech.
Stands
where
beech
represented
less
than
80%
in
basal
area
for
part
of
the
observation
period
were
rejected
from
this
study.
These
stands
will
be
considered
as
approx-
imately
pure,
complete
and
even-aged.
The
com-
position
and
density
of
the
understory
are
vari-
able
between
stands,
but
in
all
cases
its
growth
rate
is
very
low
and
we
have
considered
that
these stands
"work"
as
single-storied.
In
younger
stands
(aged
30
to
60
years),
sev-
eral
plots
were
installed
to test
different
thinning
regimes.
Only
treatment
is
different
between
these
plots,
site
conditions
and
initial
state
being
iden-
tical.
In
stands
older
than
60
years,
a
single
"pro-
duction
plot"
was
installed
and
received
an
ordi-
nary
treatment
(selective,
not
too
heavy
thinnings
of
a
mixed
nature,
ie,
both
in
dominant
and
sup-
pressed
trees).
In
the
oldest
stands,
1
plot
was
defined
as
"production
plot
during
the
regenera-
tion
phase"
and
was
subject
to
shelterwood
cut-
tings.
Site
conditions
may
be
slightly
different
between
stands.
The
definition
of
treatments
to
be
practiced
in
the "thinning
plots"
was
rather
loose.
In
the
oldest
experiment
of
Haye,
a
comparison
of
low
versus
crown
thinnings
was
the
objective.
In
all
plots
installed
in
the
1920s,
the
main
objective
was
to
test
different
combinations
of
thinning
weight
and
cutting
cycles.
In
order
to
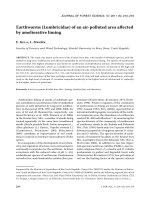
quantify thinning
weight,
a
relative
density
index
(RDI)
was
hand-fitted
after
the
idea
of
Reineke
(1933):
it
reads
as
RDI
=
N
* D
g
1.5
/
119866
(N
in
ha-1
,
quadratic
mean
diameter
Dg
in
cm).
As
indicated
in
figure
1,
stand
densities
have
remained
between
0.4
and
1,
except
in
the
regen-
eration
phase
(shelterwood
cuttings
are
the
rea-
son
why
stands
older
than
160
years
have
RDI
values
lower
than
0.4;
see
fig
1).
This
interval
indicates
a
rather
conservative
silviculture;
pre-
vious
work
has
shown
that,
for
a
given
age,
stand
basal
area
or
dominant
height
growth
rates
are
almost
independent
on
density,
in
this
range
of
densities
(Dhôte,
1991).
Data
All
plots
were
measured
at
intervals
of
3
to
10
years
(6
to
19
measurements
per
plot;
see
table
I).
In
young
stands,
diameter
was
measured
with
a
caliper
(2
cm
precision)
on
all
live
trees
and
the
data
are
a
collection
of
histograms
for
each
species.
As
soon
as
stand
density
allowed
it,
trees
were
numbered
physically;
then
girth
was
measured
at
the
nearest
1
cm
and
the
data
structure
became
a
tree
list
(see
table
I
for
dates).
The
estimation
of
mortality
is
easy
in
the
case
of
tree
lists.
For
the
early
recordings
of
his-
tograms,
mortality
trees
per
diameter
class
and
species
were
estimated
by
comparing
succes-
sive
histograms.
This
procedure
relies
on
the
fact
that
growth
rate
in
the
lower
diameter
classes
is
almost
zero
in
these stands
and
hence
deficits
of
trees
may
be
interpreted
as
mortality
(Dhôte,
1990).
In
addition,
a
sample
of
trees
were
measured
for
total
height
and volume
at
repeated
dates.
Until
the
1940s,
only
felled
trees
were
measured.
From
the
1950s
on,
a
composite
sample
of
felled
and
standing
trees
was
defined,
the
latter
being
measured
with
optical
devices
(see
Pardé
and
Bouchon,
1988).
Successive
samples
were
inde-
pendent.
Height
and
volume
measurements
were
not
performed
at
each
date
of
inventory
(see
num-
ber
of
measurements
in
table
I).
A
total
of
15
stands,
29
plots,
346
dates
of
measurement
and
317
observed
growth
periods
were
available.
Plot
area
ranged
from
0.20
to
1
ha.
Estimation
procedure
for
dominant
height
The
figures
for
dominant
height
used
in
this
study
were
estimated
by
means
of
sets
of
height-girth
curves
(details
on
the
model
properties
can
be
found
in
Dhôte
and
de
Hercé,
1994).
On
every
sample
of
height-girth
measurements,
we
used
nonlinear
least
squares
to
fit
an
equation
of
the
fol-
lowing
form:
where
a
= μ
1
-
1.3
+ μ
2
c
and
c is
girth
(cm),
his
total
tree
height
(m),
μ
i
(1
≤
i
≤ 3)
is
a
vector
of
parameters.
Parameter
μ
3
must
remain
in
the
interval
[0,1].
This
model
is
a
hyperbola
with
an
upper
hor-
izontal
asymptote
at
μ
1
, μ
2
being
the
derivative
in
0
and
μ
3
an
index
of
shape:
μ
3
=
0
is
for
the
rectangular
hyperbola,
increasing
values
of
μ
3
indicate
increasing
curvature
for
medium
values
of
girth.
The
curve
is
constrained
to
pass
through
1.30 m for c=0.
The
estimation
procedure
is
a
modification
of
that
used
by
Dhôte
and
de
Hercé
(1994).
In
order
to
accomodate
for
poorly
conditioned
samples,
parameters μ
2
and
μ
3
were
fixed
as
functions
of
stand
age:
These
two
functions
are
common
to
all
plots
and
forests.
Only
parameter μ
1
is
estimated
for
each
data
set.
The
fitting
procedure
provides
an
estimate
of
μ
1
as
well
as
an
estimate
of
its
preci-
sion
(standard
deviation).
The
series
of
succes-
sive
estimates
of
μ
1
through
time
were
controlled,
for
every
plot.
In
order
to
prevent
erratic
estimates
of
dominant
height,
we
corrected
some
of
the
estimates
of
μ
1
by
adding
or
substracting
a
max-
imum
of
1
standard
deviation.
For
dates
of
mea-
surement
when
no
sample
of
heights
was
avail-
able,
μ
1
was
estimated
by
linear
interpolation.
A
first
graphical
examination
of
the
data
revealed
that
the
data
clouds
for
different
plots
were
almost
identical.
Hence,
for
fitting
the
model,
all
plots
within
a
stand
were
pooled
together.
In
some
dubious
cases,
separate
fittings
were
per-
formed;
no
differences
in
the
estimates
of
μ
1
were
found
significant.
If
Cg
is
quadratic
mean
girth
and
C0
is
domi-
nant
girth
(quadratic
mean
of
the
100
largest
trees
per
ha),
the
application
of
equation
[3]
at
each
date
for
c
= C
g
and
c
=
C0
provides
estimates
of
the
mean
height
Hg
and
the
dominant
height
H0.
This
is
a
classical
procedure
for
permanent
plot
data
computation
(see,
eg,
Kennel,
1972),
but
one
has
to
stress
some
weaknesses
of
the
method:
—
Not
all
tree
heights
are
measured;
instead
of
computing
a
standard
"mean"
of
actual
mea-
surements,
three
steps
are
involved:
sampling
trees,
measuring
heights,
fitting
a
model
to
relate
height
and
diameter.
Thus,
three
sources
of
error
are
introduced
in
the
estimation
of
dominant
height
by
this
procedure.
—
In
our
case,
the
successive
samples
are
inde-
pendent.
Every
point
estimate
of
dominant
height
may
be
biased
and
successive
biases
may
be
in
opposite
directions,
resulting
in
a
large
imprecision
of
height
increments.
—
On
the
long
term,
however,
the
general
curve
dominant
height
versus
age
is
probably
a
good
approximation
of
the
actual
one.
This
indicates
that
smoothing
this
curve
may
be
a
good
solu-
tion
in
order
to
analyze
height
increments.
Estimation
of
volumes
Volume
was
estimated
by
means
of
a
general
volume
table
computed
by
Bouchon
(1981).
This
equation
provides
an
estimate
of
volume
as
a
function
of
diameter
and
total
height.
It
was
fit-
ted
to
data
for
1
066
beech
trees
coming
from
ten
forests
covering
the
whole
distribution
of
the
species
in
France.
The
volume
data
from
the
per-
manent
plots
we
use
here
were
the
main
part
of
this
material.
No
attempt
was
made
to
fit
"local"
volume
tables
for
every
plot
or
forest.
For
application,
we
used
the
measured
value
of
girth
and
the
estimated
value
of
height
accord-
ing
to
that
used
earlier.
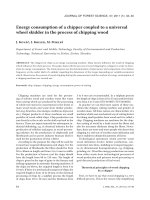
RESULTS
Dominant
height
growth
On
the
whole
data
set,
dominant
height
at
a
base
age
of
100
(a
kind
of
site
index)
ranges
from
25
to
35
m,
but
most
of
the
values
lie
between
30
and
35
m
(fig
2).
In
addition,
the
classification
of
stands
according
to
site
index
is
strictly
valid
within
one
particular
climatic
region.
Only
the
two
forests
in
Lor-
raine
(Haye
and
Darney)
exhibit
some
dif-
ferences
in
height
at
a
particular
age.
The
differences
between
stands
within
the
forests
of
Retz
and
Eawy
are
very
small.
This
is
a
confirmation
that
site
conditions
are
very
homogeneous
within
each
forest.
As
a
consequence,
this
data
set
is
not
adequate
for
a
complete
modeling
of
dom-
inant
height
growth,
including
the
separa-
tion
of
curves
according
to
the
site
index.
Our
choice
was
to
describe
height
incre-
ment
with
a
simple,
provisional
model:
where r
f
is
a
parameter
characterizing
the
forest
and
Ks
is
a
parameter
characterizing
the
stand
(K
s
is
the
asymptote
and r
f
Ks
is
the
growth
rate
when
height
is
zero).
This
is
the
monomolecular
model,
which
has
the
following
property:
since
the
deriva-
tive
decreases
for
all
positive
values
of
height,
this
model
cannot
feature
an
inflex-
ion
point.
If
such
an
inflexion
point
exists
in
our
stands,
it
occurs
at
a
very
early point
in
stand
life
and
in
all
cases
before
the
plots
were
installed
(extrapolate
from
fig
2).
For
the
observed
part
of
curves,
equation
[5]
provides
an
efficient
summary
of
data
and
requires
only
two
parameters.
Although
this
model
can
be
integrated
easily,
we
chose
to
fit
it
in
the
differential
form,
ie,
by
modeling
the
increments.
The
statistical
model
for
fitting
was:
where
subscripts
f,
s,
i
refer
to
the
forest,
the
stand
and
the
time
period,
respectively;
ΔH
0
Δt
is
the
observed
height
increment
for
forest
f,
stand
s
between
dates
ti
and
t
i+1
;
H
0mean,f,s,i
is
the
mean
of
height
values
at
dates
ti
and
t
i+1
;
ϵ
f,s,i
is
a
normally
distributed
error
of
mean
0
and
constant
variance.
Since
no
parameters
were
common
to
all
forests,
the
model
was
fitted
separately
to
each
forest.
The
results
are
given
in
table
II.
The
pro-
portion
of
variance
explained
by
the
model
is
variable.
The
quality
of
the
fitting
can
be
considered
satisfactory
in
Eawy
and
Retz.
In
Haye,
the
early
growth
(at
the
pole
stage)
was
rather
slow,
so
that
the
data
cloud
has
a
low
slope
(parameter
rf)
and
the
model
is
poorly
determined.
In
Darney,
the
amount
of
noise
around
the
increments
is
important,
due
to
the
short
periods
between
two
suc-
cessive
measurements
(height
sampling
every
3
years).
High
coefficients
of
correlation
between
parameter
rf
and
the
different
Ks
are
noted.
The
highest
values
are
observed
for
the
youngest
stands:
this
is
logical
since
these
stands
have
the
largest
variance
in
the
dependant
variable
and
determine
the
slope
of
the
whole
data
cloud.
Within
each
forest,
stands
were
grouped
according
to
the
grading
of
the
observed
heights
(fig
2)
and
the
values
of
the
esti-
mated
Ks,
taking
into
account
their
preci-
sion.
A
second
fitting
was
performed,
with
one
Ks
for
each
group
(see
table
III).
These
parameter
values
will
be
used
in
the
fol-
lowing
sections.
There
is
a
decrease
of
parameter r
f
along
the
gradient
west
(Eawy)
to
east
(Haye).
The
very
high
value
obtained
in
Darney,
which
is
located
in
Lorraine
as
the
Forêt
de
Haye,
must
be
taken
with
caution
because
it
is
very
imprecise.
Anyway,
our
data
set
is
clearly
not
adequate
for
testing
any
geo-
graphic
trend
of
this
parameter.
This
work
is
a
preliminary
analysis
and
must
be
com-
pleted
by
use
of
other
data
sets
(series
of
plots
located
in
different
climatic
regions
and/or
stem
analyses).
Basal
area
growth
The
basis
of
the
modeling
was
to
try
to
relate
basal
area
and
dominant
height
growth
rates.
A
preliminary
analysis
of
the
yield
table
for
common
beech
in
northern
Ger-
many
by
Schober
(1972)
had
revealed
that
the
basal
area
growth
rate
ΔG/Δt
was
lin-
early
related
to
dominant
height
growth
rate
ΔH
0
/Δt
and
that
this
relation
was
identical
for
all
four
productivity
classes
(Dhôte,
1992).
A
direct
fit
of
basal
area
increments
on
the
"observed"
values
of
height
increments
proved
to
be
difficult,
because
of
the
impor-
tant
noise
around
the
latter
variable.
So
we
computed
the
"predicted
dominant
height
increments",
defined
as
follows:
where
H0
mean,f,s,i
is
the
mean
of
observed
height
values at
dates
ti
and
t
i+1
;
rf
and
Ks
are
parameters
computed
in
the
previous
section.
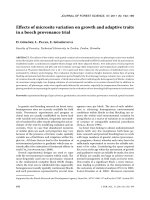
We
fitted
the
following
model:
where
α
and
β
are
regression
parameters
and
ϵ
f,s,i
is
a
normally
distributed
error
of
mean
0
and
constant
variance.
Since
there
were
no
parameters
specific
to
subunits
(plots
or
forests),
all
data
were
pooled
together
for
fitting
this
model.
Table
IV
and
figure
3
give
a
summary
of
the
results.
The
overall
quality
of
the
linear
regression
is
apparent.
No
attempt
was
made
to
test
for
the
significance
of
a
quadratic
term,
in
order
to
keep
the
model
as
simple
as
possible
(as
shown
by
the
graph,
the
residual
variance
is
slightly
higher
at
high
values
of
the
independent
variable).
Neither
did
we
test
for
different
regression
lines
for
the
four
forests:
the
distributions
of
data
for
predicted
height
increment
have
different
amplitudes,
so
that
we
could
hardly
conclude
concerning
the
practical
meaning
of
different
regression
lines
(statistical
arti-
fact
or
true
difference
in
behavior).
In
order
to
test
for
the
effect
of
silvicul-
ture,
we
performed
an
analysis
of
the
resid-
uals
against
various
measures
of
stand
den-
sity
(number
of
stems,
basal
area,
relative
density
index):
no
trend
was
detected.
Pos-
sible
reasons
for
this:
stand
densities
in
our
data
set
are
very
often
more
than
half
the
maximum;
even
low
densities
were
achieved
progressively,
by
maintaining
a
reasonable
degree
of
ground
cover;
common
beech
productivity
is
not
very
sensitive
to
density
in
a
large
range
of
silvicultures
(Assmann,
1970;
Dhôte,
1991);
even
if
a
slight
trend
existed
in
that
range
(monotonic
or
other
types
of
response
curves),
it
might
not
be
detected
because
the
major
source
of
noise
is
periodic
(for
a
given
stand
and
observation
period,
all
plots
are
either
above
or
below
the
regression
line).
This
"periodic
effect"
is
due
to
climate
and/or
measurement
biases
and
was
not
modeled.
Since
the
amplitude
in
both
the
depen-
dent
and
independent
variables
is
fairly
large,
we
can
be
confident
in
the
applica-
tion
of
this
result,
at
least
within
the
ecolog-
ical
range
of
our
plots.
The
intercept
of
the
regression
is
highly
significant,
which
means
that
basal
area
growth
rate
should
remain
approximately
constant
as
height
growth
approaches
zero.
Volume
growth
Volume
growth
results
from
area
increments
laid
over
the
actual
cambial
surface
of
stems
and
branches.
This
introduces
a
relation-
ship
between
volume
growth
on
the
one
hand,
basal
area
growth
and
height
on
the
other
hand.
In
this
regard,
it
is
usual
to
take
into
account
the
current
taper
of
stems
(see,
eg,
Assmann,
1970,
p
151).
Another
method
to
relate
basal
area
and
volume
growth
orig-
inates
from
Pressler’s
law
(used
by
Mitchell,
1975),
which
states
that
area
increment
at
any
point
of
the
stem
is
proportional
to
the
amount
of
foliage
located
above
that
point
(butt
swell
is
ignored).
Testing
whether
this
result
actually
holds
for
beech
is
beyond
the
scope
of
this
study.
If
it
holds
at
the
stand
level
and
for
stems
and
branches
as
well,
then
we
would
expect
that
total
stand
vol-
ume
increment
be
proportional
to
the
prod-
uct
of
basal
area
increment
and
height
(no
taper
is
to
be
considered).
To
test
this
expectation,
we
considered
the
following
model:
where
ΔV ΔG
f,s,i
is
the
ratio
between
volume
and
basal
area
increments
between
dates
ti
and
t
i+1
;
H0
mean,f,s,i
is
the
mean
of
height
val-
ues
at
dates
ti
and
t
i+1
;
y
and
δ
are
regres-
sion
parameters
and
ϵ
f,s,i
is
a
normally
dis-
tributed
error
of
mean
0
and
constant
variance.
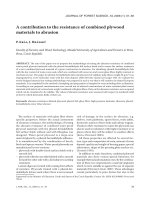
Once
again,
equation
[9]
was
fitted
to
all
data
pooled
together
(fig
4).
The
quality
of
the
regression
is
very
high,
but
one
has
to
remember
that
modeling
the
ratio
between
volume
and
basal
area
increments
elimi-
nates
much
of
the
variability:
basal
area
and
volume
are
computed
from
the
same
data,
climatic
or
experimental
noise
influences
the
figures
in
the
same
way.
Furthermore,
it
is
logical
that
height
appears
highly
corre-
lated
to
this
ratio.
The
most
important
result
is
that
the
inter-
cept
term
is
not
significant.
Table
V
gives
the
statistics
for
the
no
intercept
regression
(ie,
yfixed
to
zero).
Synthesis:
a
possible
generalization
of
Eichhorn’s
rule
The
data
analysis
of
the
3
previous
sec-
tions
provides
a
model
for
the
3
compo-
nents
of
productivity
in
even-aged
beech
stands:
where
α,
β,
δ
are
global
parameters
(com-
mon
for
the
whole
area); r
f
is
characteristic
of
the
forest
and
Ks
is
characteristic
of
the
stand.
These
equations
may
be
combined
and
integrated
to
provide
an
expression
of
the
relationship
between
dominant
height
and
volume
yield.
The
integration
is
analytically
tractable
because
we
have
chosen
simple
differential
equations.
We
obtain:
where
yis
an
integration
constant.
Equation
[14]
defines
volume
yield
as
a
second-order
polynomial
function
of
domi-
nant
height,
with
an
intercept
term
depend-
ing
on
stand
Age.
Because
of
parameter
rf,
different
forests
will
have
different
curves.
rf
traduces
the
general
shape
of
height
growth:
if
we
assume
that
this
shape
varies
according
to
climate
(eg,
Décourt,
1964;
Le
Goff,
1981),
then
we
would
expect
from
equation
[14]
that
the
volume-height
curve
varies
on a
large
scale
(ie,
the
scale
of
cli-
matic
regions).
Parameter
Ks
has
an
effect
on
the
time
dependence
of
the
equation.
This
means
that,
in
a
given
forest,
stands
with
different
site
indices
will
follow
different
volume-height
curves.
While
H0
approaches
its
asymptote
Ks
(the
term
then
remains
approximately
constant),
vol-
ume
continues
to
increase
as
the
term
y+
δ
α K
s
Age.
See
simulations
in
figure
5.
Although
there
is
no
single
total
volume
yield-height
relationship
for
all
the
forests
(see
Assmann,
1955)
and
although
total
yield
may
vary
at
a
given
height
when
site
index
varies
(coherent
with
Kennel,
1973),
only
one
local
parameter
is
necessary
to
describe
stand
productivity
(the
asymptote
Ks
).
Thus,
equation
[14]
does
not
comply
with
Eichhorn’s
rule
(equation
[2]),
but
it
may
be
considered
as
a
kind
of
generalization
of
the
productivity
assessment
method
based
on
Eichhorn’s
rule.
Provided
that
equation
[14]
holds
and
that
sets
of
height-age
curves
are
available,
any
couple
of
height-age
data
for
a
stand
allows
the
estimation
of
the
asymptote
Ks
and
hence
of
the
corre-
sponding
total
volume
yield.
These
conclusions
are
valid
only
if
parameter
rf
is
actually
constant
in
a
given
climatic
region,
which
cannot
be
assured
from
our
material.
The
differences
in
yield
level
between
different
site
indices
predicted
by
our
model
(see
fig
5)
are
in
good
agree-
ment
with
the
yield
table
by
Schober
(1972),
but
less
important
than
those
reported
by
Kennel (1973).
The
second
problem
of
practical
impor-
tance
is
how
to
estimate,
from
simple
stand
measurements
(one
single
measure
of
age
and
dominant
height),
the
asymptote
Ks,
if
this
proves
to
be
an
appropriate
index
of
stand
productivity.
A
series
of
stem
analy-
ses
could
bring
some
insights
to
these
ques-
tions.
The
stability
of
equations
[11]
and
[12]
is
also
very
important.
By
this
we
mean
that
our
results
are
valid
only
if
these
two
equa-
tions
are
indeed
constant
over
large
regions
(at
least
within
a
given
climatic
region).
If
this
is
not
the
case,
local
parameters
other
than
Ks
may
have
an
influence.
The
only
way
to
know
is
to
gain
information
from
other
data
sets.
In
the
following
sections,
we
try
to
derive
a
functional
explanation
of
these
relationships,
in
order
to
increase
the
confidence
in
the
model
and
to
guide
future
research.
A
FUNCTIONAL
INTERPRETATION
OF
THE
STAND
GROWTH
MODEL
Volume
growth
equation
and
carbon-balance
models
Equations
[10]
and
[12]
may
be
assembled
in
the
following
way:
This
expression
is
a
conventional
bal-
ance
between
a
positive
term,
which
is
pro-
portional
to
dominant
height,
and
a
nega-
tive
term
proportional
to
the
square
power
of
height.
This
looks
very
much
like
the
car-
bon-balance
models,
where
the
positive
term
represents
the
allocation
of
photosyn-
thates
to
stem
and
branch
growth
and
the
negative
term
the
losses
of
carbon
due
to
mortality
and
maintenance
respiration
(Lin-
der
et al,
1985;
Valentine,
1985;
Mäkelä,
1986).
Here,
we
consider
gross
volume
yield,
including
tree
mortality;
hence,
loss
of
matter
comprises
only
maintenance
res-
piration
and
mortality
of
tissues
(leaves,
twigs,
branches).
We
may
consider
that
growth
respiration
is
implicitly
included
if
it
is
assumed
proportional
to
growth
rate.
If
the
forest-level
parameters
rf
are
assumed
to
reflect
average
climatic
condi-
tions
and
the
stand-level
parameters
Ks
the
stand
productivity,
then
equation
[15]
can
be
interpreted
as
follows:
there
is
an
influ-
ence
of
regional
climate
on
both
terms
of
the
balance
(assimilation
and
maintenance
respiration);
the
length
of
the
vegetation
period
and
the
course
of
daily
temperatures
can
influence
both
processes
in
annual
terms
(on
the
influence
of
temperature
on
maintenance
respiration,
see
Kira,
1975,
cited
by
Cannell,
1989;
Yokoi
et al,
1978;
Frossard
and
Lacointe,
1991).
The
index
for
stand
productivity
Ks
appears
only
in
the
positive
term,
which
could
be
interpreted
as
the
effect
of
primary
production
factors
(water
and
nutrients)
on
net
photosynthe-
sis
and/or
on
the
allocation
of
photosyn-
thates
to
above-ground
parts.
Possible
pro-
cesses
here
are
a
reduction
of
the
assimilation
rate
due
to
water
shortage
(stomatal
closure)
and
a
larger
share
of
pho-
tosynthates
to
fine
roots
turnover
on
sites
with
poor
water
or
nutrient
supply
(Reynolds
and
Thornley,
1982;
Linder
et al,
1985;
Can-
nell,
1989).
The
site-dependence
of
the
model
is
therefore
coherent
with
some
cur-
rent
results
or
theories
in
ecophysiology.
A
more
unexpected
feature
of
this
model
is
the
height-dependence
of
both
terms
of
equation
[15].
It
seems
logical
that
the
neg-
ative
term
is
related
to
height:
the
loss
of
carbon
through
maintenance
respiration
is
proportional
to
the
amount
of
living
biomass.
If
this
living
biomass
is
roughly
equivalent
to
stem
and
branch
sapwood
(Mäkelä,
1986;
Sievänen,
1993)
and
if
there
is
a
regulation
between
foliar
area
and
sapwood
area
(see,
eg,
Grier
and
Waring,
1974;
Rogers
and
Hinckley,
1979;
Granier,
1981),
then
we
would
expect
that
respiration
losses
depend
on
height.
The
fact
that
this
term
depends
on
the
square
power
of
height
is
further
inves-
tigated
in
the
next
section.
Concerning
the
positive
term,
it
is
rea-
sonable
to
assume
that
net
photosynthesis
is
approximately
constant
as
soon
as
the
stand
has
achieved
a
stable
foliar
area,
although
some
authors
argue
that
the
water
constraint
increases
with
height
develop-
ment
(Møller
et al,
1954).
If
net
assimilation
then
remains
constant,
it
could
be
assumed
that
the
proportion
of
assimilates
allocated
to
above-ground
wood
depends
on
height.
Because
living
tissues
in
stems
are
an
increasing
proportion
of
total
biomass,
it
is
possible
that
there
is
an
increasing
demand
for
assimilates
in
stems
and
branches
as
height
increases,
in
order
to
maintain
other
regulations
(eg,
sapwood-foliar
areas).
A
theoretical
derivation
of
a
height-depen-
dence
for
allocation
to
wood
can
be
found
in
Mäkelä
(1986).
But
a
review
by
Cannell
(1989)
indicates
that
partitioning
to
wood
remains
fairly
constant
after
canopy
closure.
Height-basal
area
relationships
and
dynamics
of
sapwood
To
complete
the
previous
interpretation,
we
propose
here
a
separate
model
for
sapwood
geometry
and
dynamics.
This
model
will
possess
2
properties
coherent
with
our
empirical
findings:
there
is
a
site-indepen-
dent
linear
relationship
between
basal
area
and
height
growth
and,
in
addition,
the
neg-
ative
term
of
the
volume
growth
equation
is
proportional
to
a
square
power
of
height.
We
consider
a
stand
of
N
identical
trees
of
height
h(t)
at
date
t.
A1.
We
assume
that
total
stand
sapwood
(including
stems
and
branches)
has
the
geometry
of
a
paraboloid,
that
is,
sapwood
area
sa(z,t)
at
any
level
z
above
ground
and
at
any
date
t is:
sa(z,
t)
= ϕ
(h(t) -
z)
with
ϕ
a
parameter.
A2.
We
assume
that
sapwood
area
at
the
level of
crown
base
h(t) -
cl(t)
(where
cl(t)
is
crown
length)
is
proportional
to
stand
foliar
biomass
fm(t):
with χ
a
parameter.
The
evolution
with
time
of
sapwood
area
is
featured
by
the
following
partial
deriva-
tive:
If
we
introduce
the
rate
of
creation
of
new
(external)
sapwood
(∂s
/ ∂t)
(z,t)
(which
is
equivalent
to
the
annual
increment
in
dis-
crete
terms)
and
the
rate
of
conversion
of
sapwood
to
heartwood
δ(z,t),
then
we
may
write:
A3.
We
assume
that
the
density
of
foliar
weight
per
m
of
crown
length
is
constant
with
time,
ie
A4.
We
assume
that
the
rate
of
conversion
of
sapwood
to
heartwood
is
constant
with
respect
to
date
t and
vertical level
z,
ie
∂(z,
t)
=
ω.
Provided
that
assumptions
A3
and
A4
hold,
we
can
write:
Sapwood
volume
sv(t)
may
be
computed
by
integration
of
equation
[17]:
As
a
first
consequence
of
equation
[20],
the
area
of
the external
ring
does
not
depend
on
the
vertical
position.
This
result
is
coherent
with
"Pressler’s
law",
which
pos-
tulates
that
area
increment
at
any
point
along
the
stem
is
proportional
to
the
amount
of
foliar
biomass
located
above
that
point
(see
Mitchell,
1975;
Ottorini,
1991
for appli-
cations
to
growth
modeling).
So
a
parabolic
geometry
of
sapwood
may
be
compatible
with
Pressler’s
law,
under
some
additional
hypotheses.
This
result
is
important,
since
Pressler’s
law
is
often
considered
more
or
less
equivalent
with
the
pipe
model
of
Shi-
nozaki
et al (1964).
Here
we
demonstrate
that
a
constant
area
of
increments
along
the
stem
is
compatible
with
a
tapered
sap-
wood,
whereas
derivations
based
on
the
pipe
model
generally
consider
that
sapwood
area
is
constant
along
the
stem.
Equation
[20]
is
equivalent
to
our
empir-
ical
relationship
between
basal
area
and
dominant
height
growth.
If
parameters
ω,χ
and
&phis; are
independent
on
site,
then
we
would
expect
a
single
general
relation,
as
stated
experimentally.
In
addition,
volume
of
sapwood
is
a
square
power
function
of
stand
height,
which
is
coherent
with
equation
[15]
for
volume
increment
and
the
argument
that
maintenance
respiration
rate
is
pro-
portional
to
sapwood
volume
(or
biomass).
A
discrepancy
between
observations
and
the
predictions
provided
by
this
model
is
that
volume
increment
should
be
the
exact
product
of
basal
area
increment
and
domi-
nant
height
(because
area
increment
is
uni-
form
along
the
stems,
eg,
[20]).
We
found
that
these
values
are
indeed
proportional,
but
with
a
proportionality
constant
of
0.7,
which
was
statistically
different
from
1.
Rea-
sons
for
this
might
be
that
our
model
of
sap-
wood
distribution
is
overly
simple
and
neglects
the
presence
of
butt
swell
and
the
effect
of
branching.
In
addition,
dominant
height
is
probably
a
biased
estimator
of
the
height
of
the
dominant
story
(mean
height
has
some
other
drawbacks,
especially
when
computed
from
all
trees
including
the
under-
story).
Discussion
of
the
model
for
sapwood
The
cost
for
obtaining
an
appropriate
rela-
tionship
between
area
and
height
incre-
ments
was
rather
high:
we
had
to
make
four
successive
assumptions,
which
are
dis-
cussed
here.
To
begin
with,
it
is
important
to
emphasize
that
our
model
is
at
the
stand
level,
whereas
most
of
the
work
cited
later
is
at
the
individual
level
(eg,
sapwood).
Assumption
A1
is
a
schematical
repre-
sentation
of
sapwood
distribution:
we
sim-
plified
the
actual
geometry
and
neglected
the
problems
associated
with
branching
pat-
terns
and
butt
swell
in
order
to
make
the
problem
analytically
tractable.
More
realis-
tic
simulations
based
on
a
three-dimensional
featuring
of
trees
could
help
in
a
sensitivity
analysis.
Such
models
exist
only
for
some
particular
situations
(Mitchell,
1975).
The
parabolic
nature
of
sapwood
distribution
is
coherent
with
experimental
findings
of
Granier
(1981),
Waring
et al (1982),
Hatsch
(1993)
on
different
conifer
or
broad-leaved
species.
Concerning
A2,
many
authors
claim
that
the
proportional
(or
linear)
relationship
between
sapwood
area
and
leaf
area
(or
biomass)
is
better
determined
when
sap-
wood
area
is
taken
at
crown
base
(Granier,
1981;
Dean
and
Long,
1986;
Maguire
and
Hann,
1986),
because
sapwood
taper
intro-
duces
a
source
of
noise.
Unpublished
work
by
Karimi
and
Keller
(personal
communi-
cation)
indicates
that
the
distinction
of
heart-
wood
and
sapwood
in
common
beech
is
very
difficult,
by
any
of
the
usual
methods
(anatomy,
water
content,
coloration,
etc):
this
would
be
in
favor
of
an
approximately
parabolic
taper
of
sapwood
(sapwood
is
roughly
equivalent
to
total
wood,
and
hence
both
have
the
same
geometry,
which
is
close
to
a
paraboloïd).
Parameter χ
is
implied
by
the
proportional
relationship
between
sapwood
area
and
foliar
biomass
(or
area).
Some
results
indicate
that
this
parameter
may
be
altered,
at
least
tem-
porarily,
by
thinning
or
fertilization
(Brix
and
Mitchell,
1983;
Aussenac
and
Granier,
1988).
Nevertheless,
the
first
two
assump-
tions
are
strengthened
by
a
series
of
exper-
imental
results.
The
status
of
assumptions
A3
and
A4
is
quite
different:
they
are
a
speculation
which
makes
it
possible
to
solve
the
problem,
but
their
validity
is
questionable.
The
fact
that
the
rate
of
conversion
of
sapwood
to
heart-
wood
is
constant
with
respect
to
spatial loca-
tion
(site
conditions),
vertical
position
(along
the
stems
and
branches)
and
time
(age
of
stand)
seems
very
hard
to
support.
Experi-
menting
on
dynamics
of
sapwood
is
proba-
bly
a
difficult
issue.
We
would
expect
that
this
rate
of
conversion
be
different
according
to
site
conditions
(water
regime).
In
this
case,
parameter ω
in
equation
[20]
could
vary
with
site,
resulting
in
different
linear
equations
for
different
sites.
Finally,
the
density
of
leaf
biomass
per
m
of
crown
length
fm(t)
/
cl(t) = &phis;
must
be
constant
with
stand
age
and
site.
This
fact
does
not
seem
very
intuitive:
total
stand
leaf
area
(or
biomass)
remains
approximately
constant
after
canopy
closure
and
crown
length
increases
slowly
on
the
long
term
as
a
result
of
self
thinning
or
silviculture.
So
we
would
expect
this
ratio
to
decrease.
Maybe
the
leaf
biomass
and
crown
length
to
be
considered
in
equation
[17]
are
not
the
actual,
measurable
ones,
but
those
figures
concerning
the
most
efficient
part
of
crowns
(topmost
parts).
DISCUSSION
AND
CONCLUSION
A
modeling
of
the
three
components
of
stand
productivity
(growth
rates
of
dominant
height,
basal
area
and
total
volume)
in
29
plots
of
common
beech
located
in
four
forests
of
northern
France
led
to
a
set
of
three
simple
differential
equations.
Local
parameters
had
to
be
considered
for
mod-
eling
dominant
height
growth.
They
char-
acterize
two
levels
of
structure
in
our
data
set:
the
forest
and
the
stand.
Basal
area
and
volume
growth
could
be
described
with
global
parameters
(common
for
the
whole
studied
area).
This
system
of
equations
pro-
vides
at
least
an
adequate
summary
of
the
data;
however,
the
method
based
on
mod-
eling
increments
could
be
applied
as
well
in
other
situations,
since
this
provides
a
framework
for
analyzing
the
joint
effect
of
site
and
silvicultural
treatment.
The
variability
of
the
local
parameters
needs
further
investigation.
Two
issues
are
to
be
distinguished.
i)
Is
the
stand-level
parameter
an
appropriate
measure
of
site
productivity,
how
is
it
related
to
traditional
measures
like
site
index
and
how
to
esti-
mate
it
from
simple
stand
measurements?
ii)
Is
the
forest-level
parameter
stable
inside
1
climatic
region?
An
experiment
to
address
these
problems
could
be
a
series
of
stem
analyses
in
even-aged
stands
at
two
lev-
els:
large
variations
in
climatic
conditions
(fortunately,
common
beech
is
present
from
the
British
Islands
to
central
Europe)
and
a
large
range
of
site
conditions
inside
each
region.
It
is
not
yet
clear
whether
the
set
of
equa-
tions
applies
as
well
for
a
large
range
of
site
conditions
and,
if
not,
whether
the
form
of
equations
and/or
parameterization
should
change
with
site.
The
solution
would
be
to
reanalyze
some
series
of
long-term
exper-
imental
plots
on
a
variety
of
sites
(such
plots
exist
in
other
European
countries).
How-
ever,
existing
data
do
not
cover
all
possi-
ble
climate-site
situations
and
we
think
that
having
a
process-based
interpretation
of
models
will
help
to
generalize
them.
Under
the
assumption
that
this
model
holds
as
well
for
different
site
conditions,
simulations
revealed
that
there
is
no
single
relationship
between
dominant
height
and
total
volume
yield,
even
within
a
particular
climatic
region.
This
is
a
contradiction
with
Eichhorn’s
rule
(Assmann,
1955).
But
if
there
is
no
other
effect
of
site
than
the
local
parameter
in
height
growth
(site
index),
the
yield
level
may
be
estimated
from
site
index.
Finally,
the
differences
in
yield
level
pre-
dicted
by
this
model
are
not
very
important
(less
than
those
reported
by
Kennel
[1973]
for
the
same
species).
In
an
attempt
to
justify
the
set
of
equa-
tions
from
physiological
considerations,
2
major
questions
have
been
underlined.
i)
The
carbon-balance
framework
can
provide
some
structures
of
equations
coherent
with
the
practical
experience
of
growth
and
yield
specialists;
in
this
regard,
the
problem
of
assimilate
allocation
to
different
plant
parts
(variations
with
site
and
stand
development)
is
central
(Mäkelä,
1990).
ii)
In
order
to
derive
the
attributes
of
stand
and
tree
geom-
etry
(heights,
diameters)
from
the
biomass
compartments
of
carbon-balance
models
(Sievänen,
1993),
a
promising
solution
is
to
incorporate
the
water
regime
and
some
associated
questions
(sapwood
geometry,
sapwood
dynamics,
relationships
between
sapwood
and
leaf
area).
Our
process-based
interpretation
of
the
productivity
model
has
some
weaknesses,
but
it
indicated
that,
at
least,
the
linear
relation
between
height
and
basal
area
growth
may
vary
with
site.
ACKNOWLEDGMENTS
I
wish
to
thank
an
anonymous
referee
for
his
very
helpful
comments
on
an
earlier
version
of
this
paper.
Many
thanks
too
are
due
to
F
Houllier,
JC
Hervé,
C
Deleuze
and
A
Franc
for
numerous,
inspiring
discussions
on
site,
growth
and
pro-
cess-based
models.
REFERENCES
Arbonnier
P
(1958)
Les
places d’expérience
de
Sainte-
Marie
en
forêt
domaniale
de
Darney-Martinvelle.
Bull
Soc
For
Franche-Comté
3,
3-15
Assmann
E
(1955)
Die
Bedeutung
des
"erweiterten
Eich-
horn’schen
Gesetzes"
für
die
Konstruktion
von
Ertragstafeln.
Forstw Centralblatt 74,
321-330
Assmann
E
(1970)
The principles
of
forest
yield
study.
Pergamon
Press,
New
York,
NY,
503
p
Aussenac
G,
Granier
A
(1988)
Effects
of
thinning
on
water
stress
and
growth
in
Douglas-fir.
Can
J
For
Res 18,
100-105
Bartet
JH,
Pleines
W
(1972)
Simulation
de
l’évolution
de
forêts
régulières
en
fonction
du
traitement
sylvi-
cole.
J
For
Suisse
72, 667-695
Bouchon
J
(1981)
Tarifs
de
cubage.
In:
Le
Hêtre.
INRA,
Paris,
France,
321-326
Brix
H,
Mitchell
AK
(1983)
Thinning
and
fertilization
effects
on
sapwood
development
and
relationships
of
foliage
quantity
to
sapwood
area
and
basal
area
in
Douglas-fir.
Can
J
For
Res
13,
384-389
Cannell
MGR
(1989)
Physiological
basis
of
wood
pro-
duction:
a
review.
Scand J For Res 4,
459-490
Christie
JM
(1988)
Levels
of
production
class
of
Dou-
glas
fir.
Scott
For 42,
21-32
Dean
TJ,
Long
JN
(1986)
Variation
in
sapwood
area-
leaf
area
relations
within
two
stands
of
Lodgepole
Pine.
For Sci 32,
749-758
Décourt
N
(1964)
Les
tables
de
production,
leurs
limites
et
leur
utilité.
Rev
For
Fr 8-9,
640-657
Dhôte
JF
(1990)
Modèles
de
la
dynamique
des
peuple-
ments
forestiers :
articulation
entre
les
niveaux
de
l’ar-
bre
et
du
peuplement.
Applications
à
la
sylviculture
des
hêtraies.
These,
Univ
C-Bernard
Lyon-I,
Lyon,
France,
256
p
Dhôte
JF
(1991)
Modélisation
de
la
croissance
des
peu-
plements
réguliers
de
hêtre :
dynamique
des
hiérar-
chies
sociales
et
facteurs
de
production.
Ann
Sci
For 48, 389-416
Dhôte
JF
(1992)
Validation
du
modèle
de
croissance
pour
le
hêtre :
réponse
de
l’arbre
et
du
peuplement
à
une
large
gamme
de
sylvicultures
et
dans
une
large
aire
géographique.
Compte
rendu
de
la
con-
vention
ONF-INRA
n°
91/102,
ENGREF,
Nancy,
France, 54
p
Dhôte
JF,
de
Hercé
E
(1994)
Un
modèle
hyperbolique
pour
l’ajustement
de
faisceaux
de
courbes
hau-
teur-diamètre.
Can J For Res 24,
1782-1790
Duplat
P
(1993)
Les
modèles
de
croissance
simples
ne
sont
pas
nuls
mais
ils
ne
répondent
pas
à tout.
In:
Les
modèles
de
croissance
forestière
et
leur
utilisa-
tion.
CH
UNG
Ressources
Nat
Canada,
Sainte
Foy,
Québec, Canada,
1-12
Eichhorn
F
(1904)
Beziehungen
zwischen
Bestandeshöhe
und
Bestandsmasse.
Allg
Forstund
J Ztg
80,
45-49
Frossard
JS,
Lacointe
A
(1991)
La
gestion
du
carbone
et
de
l’énergie
dans
l’arbre.
Lecture
notes,
INRA
Cler-
mont-Ferrand,
France
Granier
A
(1981)
Étude
des
relations
entre
la
section
du
bois
d’aubier
et
la
masse
foliaire
chez
le
douglas
(Pseudotsuga
menziesii
Mirb
Franco).
Ann
Sci
For
38, 503-512
Grier CC,
Waring
RH
(1974)
Conifer
foliage
mass
related
to
sapwood
area.
For Sci 20,
205-206
Hatsch
E
(1993)
Géométrie
de
l’aubier
et
des
accroisse-
ments
ligneux
dans
les
tiges
de
jeunes
chênes
ses-
siles
(Quercus
petraea
(Matt)
Lieb).
DEA
de
biologie
forestière,
univ
Nancy-I,
France,
25
p
Hautot
A,
Dhôte
JF
(1994)
Modélisation
de
la
production
des
peuplements
forestiers
réguilers :
loi
de
Eich-
horn,
niveaux
de
production,
productivité
et
fertilité,
en
vue
de
la
modélisation
de
la
croissance
des
chê-
naies.
Rapport
bibliographique,
Convention
INRA-
CEMAGREF.
In:
Étude
des
relations
entre
le
milieu,
la
croissance
et
la
qualité
des
chênes
indigènes,
ENGREF,
Nancy,
France,
29
p
Houllier
F
(1990)
Densité
et
production
des
peuple-
ments.
À
propos
des
«Lois
de
Eichhorn».
Doc
int,
Lab de
Rech
en
Sci
For,
ENGREF,
Nancy,
France,
34
p
Kennel
R
(1972)
Die
Buchendurchforstungversuche
in
Bayern
von
1870
bis
1970.
Forstliche
Forschun-
sanstalt
München,
Forschunsbericht
n°
7,
1972,
265
p
Kennel
R
(1973)
Die
Bestimmung
des
Ertragsniveaus
bei
der
Buche.
Forstw
Centralblatt
92,
226-234
Le
Goff
N
(1981)
Tables
de
production.
In:
Le
Hêtre.
INRA,
Paris,
France,
326-338
Linder
S,
McMurtrie
RE,
Landsberg
JJ
(1985)
Growth
of
eucalyptus:
a
mathematical
model
applied
to
Euca-
lyptus
globulus.
In:
Crop
physiology
of
forest
trees.
Tigerstedt,
Puttonen,
Koski,
Univ
of
Helsinki, Helsinki,
Finland,
117-126
Maguire
DA,
Hann
DW
(1986)
Equations
for
predicting
sapwood
area
at
crown
base
in
southwestern
Oregon
Douglas-fir.
Can
J
For
Res
17,
236-241
Mäkelä
A
(1986)
Implications
of
the
pipe
model
theory
on
dry
matter
partitioning
and
height
growth
in
trees.
J Theor Biol 123,
103-120
Mäkelä
A
(1990)
Modeling
structural-functional
rela-
tionships
in
whole-tree
growth:
resource
allocation.
In:
Process
modeling
of
forest
growth
responses
to
environmental
stress
(RK
Dixon,
RS
Meldahl,
GA
Ruark,
WG
Warren,
eds),
Timber
Press,
Portland,
OR,
USA,
81-95
Møller
CM,
Müller
D,
Nielsen
J
(1954)
Graphic
repre-
sentation
of
dry
matter
production
of
European
beech.
Det
Forstl
Forsøgsvæsen
i
Danmark
21, 327-
335
Mitchell
KJ
(1975)
Dynamics
and
simulated
yield
of
Dou-
glas-fir.
For
Sci
Monogr
17,
39
p
Oswald
H,
Divoux
A
(1981)
Dispositif
experimental
d’éclaircie
du
hêtre
«Camp
Cusson»
en
forêt
doma-
niale
d’Eawy.
Doc
int,
INRA,
Nancy-Champenoux,
France,
9
p
+
annexes
Ottorini
JM
(1991)
Growth
and
development
of
individual
Douglas-fir
in
stands
for
applications
to
simulations
in
silviculture.
Ann
Sci
For 48,
651-666
Pardé
J
(1962)
Sylviculture
et
production
du
hêtre
en
forêt
de
Haye
(M
et
M)
et
de
Retz
(Aisne).
Notes
techniques
forestières,
INRA,
Nancy-Champenoux,
France, 9
p
Pardé
J
(1981)
De
1882
à
1976/1980 :
les
places
d’ex-
périence
de
sylviculture
du
hêtre
en
forêt
domaniale
de
Haye
(M
et
M).
Rev For Fr 33
(n°
sp
1981),
41-64
Pardé
J,
Bouchon
J
(1988)
Dendrométrie.
ENGREF,
Nancy, France, 328
p
Reineke
LH
(1933)
Perfecting
a
stand-density
index
for
even-aged
forests.
J
Agric
Res
46,
627-638
Reynolds
JF,
Thornley
JHM
(1982)
A
shootroot
parti-
tioning
model. Ann Bot 49, 585-597
Rogers
R,
Hinckley
TM
(1979)
Foliar
weight
and
area
related
to
current
sapwood
area
in
Oak.
For Sci 25,
298-303
Schober
R
(1972)
Die
Rotbuche.
JD
Sauerländer’s
Ver-
lag, 333
p
Shinozaki
K,
Yoda
K,
Hozumi
K,
Kira
T
(1964)
A
quan-
titative
analysis
of
plant
form —
The
Pipe
Model
the-
ory.
1.
Basic
analyses.
Jap
J
Ecol 14,
97-105
Sievänen
R
(1993)
A
process-based
model
for
the
dimensional
growth
of
even-aged
stands.
Scand
J
For
Res
8,
28-48
Valentine
HT
(1985)
Tree
growth
models:
derivations
employing
the
pipe-model
theory.
J
Theor Biol 117,
579-585
Waring
RH,
Schroeder
PE,
Oren
R
(1982)
Application
of
the
pipe
model
theory
to
predict
canopy
leaf
area.
Can
J
For
Res
12,
556-560
Yokoi
Y
et al (1978)
Quantitative
relationships
between
growth
and
respiration.
1.
Components
of
respira-
tory
loss
and
growth
efficiencies
of
etiolated
red
bean
seedlings.
Bot Mag
Tokyo 91, 31-41