Báo cáo lâm nghiệp: "Canonical correspondence analysis for forest site classification. A case study* " ppt
Bạn đang xem bản rút gọn của tài liệu. Xem và tải ngay bản đầy đủ của tài liệu tại đây (485.97 KB, 10 trang )
Original
article
Canonical
correspondence
analysis
for
forest
site
classification.
A
case
study*
JC Gégout
1
F
Houllier
2
1
Unité
écosystèmes
forestiers
et
dynamique
des
paysages;
2
Unité
dynamique
des
systèmes
forestiers
(associée
à
l’Inra),
laboratoire
de
recherches
en
sciences
forestières,
Engref,
14,
rue
Girardet,
54042
Nancy
cedex,
France
(Received
3
May
1994;
accepted
24
July
1995)
Summary -
Canonical
correspondence
analysis
(CCA)
is
an
exploratory
statistical
method
that
can
be
applied
to
the
investigation
of
vegetation-environment
relationships
and
to
forest
site
classification
studies.
This
paper
illustrates
with
a
case
study
some
of
its
advantages
over other widely
used
methods
-
ecological
profiles
and
correspondence
analysis
of
species
abundance
data:
i)
CCA
is
a
global
method
adapted
to
the
frequent
situation
characterized
by
many
species
and
several
ecological
variables;
ii)
it
makes
it
possible
to
underscore
the
influence
of
the
ecological
gradients
(eg,
water
and
nutrient
availability)
on
species
distribution
while
eliminating
undesirable
side
effects
(eg,
the
silvige-
netic
state
of
the
stands);
iii)
it
helps
in
selecting
the
ecological
variables
that
are
relevant
for
site
classification;
iv)
it
can
be
used
to
define
synthetic
indexes
of
the
ecological
optimum
and
amplitude
of
plant
species
and
thus
to
obtain
information
on
good
bioindicator
species.
site
classification
/
data
analysis
/
ecological
gradient
/ soil-vegetation
relationships
Résumé -
Analyse
canonique
des
correspondances
et
typologie
des
stations
forestières.
Une
étude
de
cas.
L’analyse
canonique
des
correspondances
(ACC)
est
une
méthode
exploratoire
d’a-
nalyse
des
données
qui
peut
être
appliquée
à
l’étude
des
relations
entre
le
milieu
et
la
végétation
ou
pour
élaborer
une
typologie
des
stations
forestières.
Cet
article
illustre,
sur
un
exemple,
quelques
avantages
de
l’ACC
sur
d’autres
méthodes
classiques -
l’analyse
factorielle
des
correspondances
d’un
tableau
phytosociologique,
les
profils
écologiques :
i) l’ACC
est
une
méthode
globale
adaptée
à
l’étude
des
relations
entre
un
grand
nombre
d’espèces
et
plusieurs
variables
écologiques ;
ii)
elle
permet
d’analyser
l’influence
des
gradients
écologiques
(exemple :
alimentation
en
eau
et
niveau
trophique)
sur
la
distribution
des
espèces
tout
en
éliminant
des
effets
parasites
(exemple :
degré
de
maturation
des
peuplements) ;
iii)
elle
permet
de
sélectionner
les
variables
écologiques
pertinentes
en
vue
de
la
typologie
des
stations ;
iv)
elle
fournit
des
indices
synthétiques
sur
l’optimum
et
l’amplitude
écologiques
des
espèces,
indices
qui
peuvent
ensuite
être
utilisés
pour
apprécier
leur
caractère
indicateur.
typologie
des
stations / analyse
des
données / gradients
écologiques / relations
sol-végétation
*Communication
at
the
meeting
of
IUFRO,
Group
S1.02.06
’Site
Classification
and
Evaluation’,
19-23
October
1993,
Clermont-Ferrand,
France
INTRODUCTION
The
analysis
of
the
vegetation-environ-
ment
relationships
constitutes
the
central
point
of
forest-site
classification
studies,
which
aim
at
i)
determining
the
ecological
gradients
that
influence
the
presence
and
abundance
of
plant
species,
and
ii)
assess-
ing
which
species
are
good
site
indicators.
These
studies
are
often
based
on
either
plant
ecological
profiles
(Daget
and
Go-
dron,
1982)
or
on
correspondence
analysis
(CA)
(Hill,
1974;
Brethes,
1989).
The
method
of
ecological
profiles
is
ana-
lytical
(one
profile
for
each
pair
of
species
and
of
ecological
variable),
it
does
not
ac-
count
for
the
redundancy
of
the
environ-
mental
variables,
nor
provide
a
global
over-
view
of
the
relationships
between
the
ecological
gradients
and
the
vegetation.
CA
is
a
global
method
that
is
generally
applied
to
plant
presence
or
abundance
data.
It
is
most
often
completed
by
hierar-
chical
classification
methods
which
aim
at
grouping
sites
and/or
species
(eg,
see
Buf-
fet,
1984;
Roux,
1985).
Its
main
drawback
is
that
it
does
not
lead
to
a
direct
analysis
of
the
ecological
gradients
(Chessel
and
Mercier,
1993):
for
example,
the
first
ordi-
nation
axes
sometimes
result
from
the
superposition
of
environmental
variables
(eg,
soil
properties)
and
of
forest
structure
and
dynamics
(McCune
and
Allen,
1985;
Becker
and
Le
Goff,
1988;
Mercier,
1988).
A
usual
way
to
cope
with
this
problem
is
to
study
a
posteriori
the
correlation
of
the
first
ordination
axes
with
some
external
ecologi-
cal
variables
(Prodon
and
Lebreton,
1981).
After
Rao
(1964)
developed
the
method
for
principal
component
analysis,
Ter
Braak
(1986, 1987)
and
Chessel
et
al
(1987)
pro-
posed
a
new
multivariate
method
that
ad-
dressed
directly
the
question
of
vegetation-
environment
relationships.
Ter
Braak
termed
it
’canonical
correspondence
ana-
lysis’ (CCA)
while
Lebreton
et
al
(1988a,
b)
prefered
to
name
it
’constrained
corre-
spondence
analysis’
or
analyse
factorielle
des
correspondances
sur
variables
in-
strumentales.
The
aim
of
this
paper
is
to
illustrate
with
a
simple
case
that
CCA
is
efficient
for
i)
per-
forming
a
direct
gradient
analysis,
ii)
help-
ing
the
ecologist
in
the
selection
of
environ-
mental
variables
that
have
a
strong
influence
on
the
vegetation,
and
iii)
assess-
ing
the
ecological
amplitude
of
plant
species.
MATERIALS
AND
METHODS
Study
area
The
Plaine
de
la
Lanterne
region
is
located
in
northeastern
France
near
Luxeuil.
Climatic
con-
ditions
are
homogeneous
with
an
average
an-
nual
temperature
of
9.3
°C
and
an
average
an-
nual
precipitation
of
960
mm.year
-1
.
Geological
substrata
consist
of
quaternary
siliceous
allu-
vium
or
fluvioglacial
deposits,
which
are
fre-
quently
covered
by
a
thin
loamy
deposit (30
to
70
cm).
The
topography
is
therefore
charac-
terized
by
gentle
slopes
(generally
<
10%).
Methods
One
hundred
and
six
forest
sites
were
sampled
in
this
region
(Gégout,
1992).
The
presence
of
plant
species
and
environmental
variables
such
as
topography,
soil
characteristics
and
stand
dy-
namics
were
observed
at
each
site.
The
data
analysed
here
are
presented
in
two
tables:
i)
the
phytosociological
presence/absence
table,
P,
with
n
rows
(n
=
106)
and
p
columns
(p
= 85:
only
species
present
at
two
or
more
sites
were
retained);
ii)
the
ecological
table,
E,
with
n
rows
and
q
columns:
the
ith
row
in
E
as
well
as
in
P
corresponds
to
the
same
site,
each
column
in
E
corresponds
either
to
a
quantitative
variable
(eg,
pH)
or
to
a
category
of
a
qualitative
variable
(eg,
the
humus
form
’mesomull’).
Three
environmental
variables
were
selected
from
a
previous
study
(Gégout
and
Houllier,
1993)
and
included
in
table
E:
’pH’,
’humus
form’
with
six
categories
(dysmoder
and
eumoder,
hemimoder
and
dysmull,
oligomull,
mesomull,
eumull,
peaty
horizon;
see
AFES,
1992;
Jabiol
et
al,
1994)
and
’hydromorphy’,
an
ordinal
vari-
able
with
five
categories
(absence
of
hydro-
morphy,
temporary
hydromorphy
at
>
50
cm,
temporary
hydromorphy
at
<
50
cm
with
chroma
>
2 at
20
cm,
temporary
hydromorphy
at
<
50
cm
with
chroma
≤
2 at
20
cm,
permanent
hydromorphy
near
the
soil
surface).
Data
analysis
(The
computations
were
carried
out
with
the
package
ADE
[Chessel
and
Dolédec,
1993]
on
an
Apple
Macintosh.)
Since
Benzecri
(1973),
CAhas
been
widely
de-
scribed
(Greenacre,
1984).
It
operates
on
a
single
table,
here
P,
and
yields
orthogonal
ordi-
nation
axes
that
maximize
the
projected
disper-
sion
of
either
the
sites
or
the
plants,
the
disper-
sion
being
defined
with
the
χ
2
metrics
(Saporta,
1990).
CA
generates
a
summary
of
P that
is
not
a
priori
constrained
by
external
environmental
variables.
The
ecological
interpretation
of
the
or-
dination
axes
requires,
therefore,
the
use
of
such
additional
variables,
which
are
either
plotted
on
the
factorial
graphs
or
correlated
with
the
coor-
dinates
of
the
sites
on
the
first
CA
ordination
axes.
On
the other
hand,
CCA deals
directly
with
two
tables,
here
P
and
E.
As
shown
by
Ter
Braak
(1986, 1987),
Chessel
et
al
(1987)
and
Lebreton
et
al
(1988a),
CCA
may
be
viewed:
i)
as
a
CA
of
P
where
the
ordination
axes
are
linearly
con-
strained
by
the
environmental
variables
in
E;
ii)
as a
discriminant
analysis
between
species;
iii)
or
as
a
CA
applied
to
P,
the
best
linear
estimator
of
P based
on
E.
As
a
consequence,
CCA
yields
a
summary
of
P
which
depends
directly
on
the
environmental
variables:
i)
the
intrinsic
quality
of
this
summary,
as
measured
by
the
dispersion
projected
on
the
first
ordination
axes,
is
necess-
arily
lower
or
equal
to
that
of
CA;
ii)
the
ordination
axes
can
be
directly
ecologically
interpreted.
A
usual
way
for
assessing
the
quality
of
CA
is
to
compute,
λ
CA,k
,
the
eigenvalue
associated
to
the
kth
ordination
axis:
λ
CA,1
≥ λ
CA,2
≥
≥ λ
CA,k
≥
λCA,k + 1
≥
The
same
quantities,
λ
CCA,k
,
may
be
computed
for
CCA
and
the
inequality
still
holds:
λ
CCA,1
≥ λ
CCA,2
≥
One
of
the
differences
be-
tween
CA
and
CCA
with
respect
to
this
approach
is
that
the
number
of
ordination
axes
is
Min
(n-
1,p -
1)
for
CA
while
it
is
Min
(n- 1,q-
r)
for
CCA,
with
r
being
the
number
of
qualitative
vari-
ables
in
E
(a
qualitative
variable
that
has
s
classes
gives
s
columns
in
E;
here
r =
2 and
s
=
6
for
’humus
form’).
Since
CA
provides
the
best
summary
of
P,
the
following
inequality
holds:
and,
as
a
special
case:
e1
=
λ
CCA,1
/λ
CA,1
<
1.
e1,
e2
, can
be
considered
as
empirical indexes that
measure
the
efficiency
of
the
ecological
vari-
ables
used
in
E
for
predicting
the
structure
of
the
vegetation.
RESULTS
AND
DISCUSSION
Analysis
of
the
dispersion
The
global
results
concerning
the
percent-
age
of
dispersion
are
presented
in
table
I.
It
is
limited
to
the
first
two
axes
since
the
other
CA
ordination
axes
had
no
clear
eco-
logical
interpretation
and
had
a
much
lower
projected
d
dispersion
(λ
CA,3
= 0.26,
λ
CA,4
=
0.22,
λ
CA,5
=
0.19 ).
The
results
have
already
been
presented
elsewhere
(Gégout
and
Houllier,
1993)
and
we
focus
here
on
the
comparison
of
CA
and
CCA
outputs.
CCA is
nearly as
efficient as
CAfor
predicting
the
structure
of
the
plant
com-
munity
(e
1
=
0.81
and e
2
=
0.68).
The
first
ordination
axis
is
fairly
similar
in
CA
and
CCA:
the
correlation
coefficient
between
species
(respectively
sites)
coordinates
is
0.98
(respectively
0.86).
This
axis
accounts
for
water
availability
and
opposes
wet
sites
to
well
drained
sites.
The
second
ordination
axis
is
more
interesting
for
our
methodo-
logical
purpose
here,
because
its
meaning
changes
from
CA
to
CCA:
the
correlation
coefficient
between
species
(respectively
sites)
coordinates
is
0.82
(respectively
0.57).
The
CA
second
axis
stems
from
the
superposition
of
a trophic
gradient
linked
to
soil
characteristics
and
a
sylvigenetic
gra-
dient
which
opposes
pioneer
stands
to
dense
mature
beech
and
oak
forests,
while
the
CCA
second
axis
accounts
only
for
the
trophic
gradient
and
eliminates
the
effect
of
the
sylvigenetic
stages.
This
shift
of
signification
of
the
second
or-
dination
axis
can
be
observed
by
different
means.
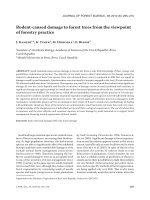
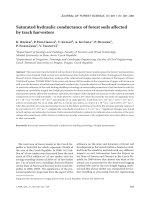
Figure
1
shows
that
the
correlation
of
the
coordinates
of
the
species
(on
the
CCA
and
CA
second
axis)
is
fairly
close
for
those
whose
presence
is
strongly
in-
fluenced
by
the
soil
trophic
gradient
(eg,
Leucobryum
glaucum)
but
that
it
is
poorer
for
some
species
(eg,
Ilex
aquifolium)
whose
presence
is
mostly
related
to
the
syl-
vigenetic
stage
of
the stand.
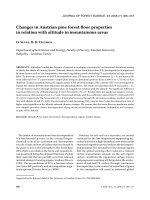
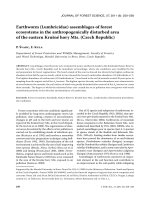
Figure
2
illus-
trates
the
discriminating
role
of
CCA:
humus
classes
are
much
better
distin-
guished
by
CCA
than
by
CA
in
the
plane
defined
by
the
first
two
ordination
axes.
For
site
classification,
CCA
is
shown
here
to
be
a
more
interesting
method
than
the
usual
CA
because
it
enables
us
to
predict
the
structure
of
the
plant
community
from
quite
simple
abiotic
environmental
gra-
dients
(water
and
nutrient
availability)
and
because
it
eliminates
a
biotic
environmen-
tal
gradient
(the
sylvigenetic
stage
of
the
stands)
that
is
mainly
a
consequence
of
past
forest
management.
Selection
of
a
set
of ecological
variables
In
order
to
investigate
the
pertinence
of
modifying
the
description
of
hydromorphy,
CCA
was
also
performed
on
a
second
pair
of tables
P
(unchanged)
and
E’,
where
hy-
dromorphy
was
classified
in
eight
ca-
tegories
which
account
for
the
intensity
of
hydromorphy
and
second
horizon
chroma
(permanent
hydromorphy
near
the
soil
sur-
face,
mottled
horizon
≤
40
cm,
40
cm
<
mottled horizon
<
70
cm,
mottled
horizon
at
>
70
cm
of
depth,
some
hydromorphic
patches
without
mottled
horizon,
absence
of
hydromorphy,
chroma
at
20
cm
≤
2 [grey
horizon],
chroma
at
20
cm
>
2).
It
was
not
a
priori
clear
whether
E
or
E’
would
be
best
for
predicting
the
structure
of
the
vegetation.
The
values
of
ek
in
table
I
that
E,
though
simpler,
has
a
better
correlation
with
the
vegetation
and
that
it
should
be
preferred
to
E’.
This
demon-
strates
how
CCA
can
be
used
for
detecting
which
environmental
variables
are
the
best
predictors
of
the
vegetation.
Since
there
are
no
statistical
tests
for
comparing
ek
from
a
CCA
to
another,
these
ratios
should
only
be
used
as
quantitative
indicators
of
the
efficiency
of
the
ecological
variables.
For
example,
they
can
help
in
investigating
whether
different
categories
of
the
same
ecological
variables
could
be
merged
with-
out
altering
the
discrimination
of
vegetation
types.
Ecological
amplitude
of
plant
species
Following
Chessel
et
al
(1982)
for
CA
and
Lebreton
et
al
(1988a)
for
CCA,
we
studied
the
ecological
amplitude
of
species
along
the
second
CCA
ordination
axis
(ie,
the
tro-
phic
gradient)
using:
i)
the
coordinates
of
the
species
as
an
index
of
their
ecological
optimum;
and ii)
the
coordinates
of
the
sites
on
the
ordination
axis
to
measure
their
eco-
logical
amplitude.
This
approach
is
based
on
the
fact
that
the
coordinates
of
a
species
are
obtained
by
weighted
averaging
of
the
coordinates
of
the
sites
where
this
species
is
present
(Ter
Braak,
1986).
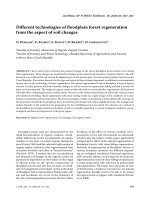
Precisely,
we
sorted
out
the
species
with
respect
to
their
coordinates
on
ordination
axis
and
com-
puted,
for
each
species,
the
1
and
9
quan-
tiles
of
the
coordinates
of
the
sites
where
it
was
present
(fig
3).
This
method
may
be
viewed
as
a
multivariate
generalization
of
the
analytical
technique
of
ecological
profiles
(Le
Tacon
and
Timbal,
1973;
Daget
and
Godron,
1982),
where
the
frequency
of
a
species
is
studied
as
a
function
of
one
environmental
variable.
The
advantages
of
the
CCA-based
ap-
proach
are
manifold.
i)
As
illustrated
earlier,
the
CCA
ordination
axes
are
explicitly
linked
to
environmental
gradients,
while
it
is
not
always
the
case
for
CA.
ii)
The
method
is
global:
there
are
only
a
few
inde-
pendent
ordination
axes
to
study
(two
in
this
case).
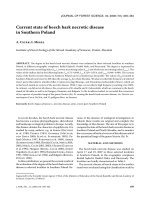
iii)
As
shown
for
Dicranum
sco-
parium
and
Scleropodium
purum,
it
pro-
vides
a
good
description
of
the
real
ampli-
tude
of
the
species
(fig
4).
iv)
It
can
detect
nonlinear
responses
of
species
to
environ-
mental
variations.
As
an
illustration,
let
us
take
the
case
of
Milium
effusum
and
Viola
riviniana
(fig
5).
Milium
effusum
is
present
on
dysmull-hemimoder,
oligomull
and
mesomull,
which
bear
approximately
the
same
species
(see
fig
2);
the
ecological
amplitude
of
Milium
effusum
is
therefore
limited.
Viola
riviniana
is
present
mostly
on
eumull
and
rarely
on
oligomull
and
meso-
mull.
Since
these
humus
classes
bear
very
different
vegetation,
the
estimated
ecologi-
cal
amplitude
of
Viola
riviniana
is
broader.
The
nonlinearity
of
the
vegetation
response
is
clear
in
figure
3
but
not
in
the
ecological
profiles
given
in
figure
5.
The
utilization
of
quantiles,
instead
of
standard
deviation,
provides
a
nonparame-
tric
description
of
ecological
amplitude
that
can
account
for
asymmetric
distributions
(eg,
Viola
riviniana
in
figs
3
and
5).
How-
ever,
since
the
quantiles
of
the
coordinates
are
poorly
estimated
for
rare
species,
the
estimated
ecological
amplitude
is
highly
sensitive
to
the
overall
frequency
of
the
various
species
and
thus
to
the
underlying
sampling
design
of
the
study:
this
is
cer-
tainly
the
major
drawback
of
this
method.
CONCLUSION
There
are
several
strategies
for
classifying
forest
sites
(see
Brethes,
1989;
Franc
and
Valadas,
1992).
In
the
context
of
the
phy-
toecological
approach,
which
is
based
on
the
joint
study
of
the
structure
of
the
vege-
tation
and
of
the
ecological
factors,
CCA
appears
to
be
a
powerful
tool
that
can
be
complemented
by
other
techniques
such
as
the
usual
hierarchical
classification
methods.
CCA
is
therefore
a
direct
method
for
ana-
lysing
ecological
gradients
and,
as
such,
it
is
a
good
substitute
to
the
usual
two-step
approach
based
on
CA
for
studying
the
vegetation-environment
relationships
(Ter
Braak,
1986).
It
may
be
especially
useful
for
site
classification
when
the
environmen-
tal
abiotic
gradients
are
superposed
to
other
ecological
factors
that
are
irrelevant
because
they
are
linked
to
stand
physiog-
nomy
which
is
heavily
dependent
on
past
forest
management.
CCA
can
be
applied
as
an
exploratory
method
for
selecting
which
ecological
fac-
tors
have
the
strongest
influence
on
the
vegetation
and
how
they
should
be
de-
scribed
(ie,
number
and
nature
of
the
classes
for
qualitative
variables).
CCA
can
also
be
viewed
as
a
generalization
of
the
one-species
versus
one-variable
approach
in
order to
estimate
the
relative
position
and
ecological
amplitude
of
the
species
along
environmental
gradients.
To
a
certain
extent,
CCA
is
related
to
the
method
proposed
by
Romane
(1972)
who
performed
CA
on
the
species
versus
eco-
logical
variables
table
built
by
counting
the
number
of
times
a
species
is
observed
for
a
given
class
of
an
environmental
variable.
Main
differences
of
Romane’s
approach
are
that
it
was
symmetric,
while
CCA
is
dis-
tinctly
asymmetric:
ecological
variables
are
used
to
predict
vegetation,
and
sites
were
not
explicitly
present,
while
they
appear
in
CCA.
ACKNOWLEDGMENTS
We
are
thankful
to
JL
Dupouey,
JC
Pierrat,
S
Darracq,
JC
Rameau,
M
Buffet
and
G
Vasanthy
for
their
comments
on
successive
versions
of
the
manuscript.
REFERENCES
Association
française
pour
l’étude
des
sols
(AFES)
(1992)
Référentiel
pédologique :
principaux
sols
d’Europe.
INRA,
Paris,
222
p
Becker
M,
Le
Goff
N
(1988)
Diagnostic
stationnel
et
potentiel
de
production.
Rev
For
Fr40,
29-43
Benzecri
JP
et
al
(1973)
L’analyse
des
données.
2.
L’ana-
lyse
des
correspondances.
Dunod,
Paris,
620
p
Brethes
A
(1989)
La
typologie
des
stations
forestières :
recommandations
méthodologiques.
Rev For Fr41,
7-26
Buffet
M
(1984)
La
description
du
milieu
pour
l’aménage-
ment
des
forêts;
application
d’un
algorithme
de
classi-
fication
à la
recherche
d’une
typologie
de
stations.
In:
IUFRO
Symposium
Aménagement
et
Gestion
(7-11
May
1984,
Nancy),
ENGREF,
Nancy,
France,
31-38
Chessel
D,
Doledec
S
(1993)
ADE
Version
3.6:
Hyper-
card
stacks
and
QuickBasic
Microsoft
programme
library
for
the
analysis
of environmental
data.
CN RS
URA
1451,
université
Lyon-I,
Lyon,
France
Chessel
D,
Mercier
P
(1993)
Couplage
de
triplets
stat-
istiques
et
liaisons
espèces-environnement.
In:
Biométrie
et
environnement (JD
Lebreton,
B
Asse-
lain,
eds),
Masson,
Paris,
15-43
Chessel
D,
Lebreton
JD,
Prodon
R
(1982)
Mesures
symétriques
d’amplitude
d’habitat
et
de
diversité
in-
traéchantillon
dans
un
tableau
espèces-relevés:
cas
d’un
gradient
simple.
CR
Acad
Sci
Paris
295,
Série III,
83-88
Chessel
D,
Lebreton
JD,
Yoccoz
N
(1987)
Propriétés
de
l’analyse canonique
des
correspondances.
Rev Stat
App
35,
55-72
Daget
P,
Godron
M
(1982)
Analyse
de
l’écologie
des
espèces
dans
les
communautés.
Masson,
Paris,
163
p
Franc
A,
Valadas
B
(1992)
Stations
forestières
et
pays-
ages :
les
granites
du
Massif
central.
Rev
For
Fr44,
403-416
Gegout
JC
(1992)
Typologie
des
stations
forestières
de
la
plaine
de
la
Lanterne
(Haute-Saône).
ENGREF,
Nancy,
France, 117
p
Gegout
JC,
Houllier
F
(1993)
Apports
de
I’analyse
fac-
torielle
des
correspondances
sur
variables
in-
strumentales
en
typologie
des
stations :
illustration
sur
la
plaine
de
la
Lanterne.
Rev For Fr45,
539-547
Greenacre
MJ
(1984)
Theory
and
Application
of
Corre-
spondence
Analysis.
Academic
Press,
London,
364
p
Hill
MO
(1974)
Correspondence
analysis:
a
neglected
multivariate
method.
J
R
Stat
Soc
[C]
23,
340-354
Jabiol B,
Brethes
A,
Brun
JJ,
Ponge
JF,
Toutain
F
(1994)
Une
classification
morphologique
et
fonctionnelle
des
formes
d’humus.
Propositions
du
Référentiel
pédologique
1992.
Rev For Fr 46,
152-166
Lebreton
JD,
Chessel
D,
Prodon
R,
Yoccoz
N
(1988a)
L’analyse
des
relations
espèces-milieu
par
l’ana-
lyse
canonique
des
correspondances.
I.
Variables
de
milieu
quantitatives.
Acta
Oecol
(Oecol
Gen)
9,
53-67
Lebreton
JD,
Chessel
D,
Richardot-Coulet
M,
Yoccoz
N
(1988b)
L’analyse
des
relations
espèces-milieu
par
I’analyse
canonique
des
correspondances.
II.
Vari-
ables
de
milieu
qualitatives.
Acta
Oecol
(Oecol
Gen)
9, 137-151
Le
Tacon
F,
Timbal
J
(1973)
Valeurs
indicatrices
des
principales
espèces
végétales
des
hêtraies
du
nord-
est
de
la
France
vis-à-vis
du
type
d’humus.
Rev
For
Fr
25,
269-282
McCune
B,
Allen
TFH
(1985)
Will
similar
forests
develop
on
similar
sites?
Can
J
Bot
63, 367-376
Mercier
P
(1988)
Approche
méthodologique
de
l’étude
des
relations
entre
la
structure
spatiale
du
peuple-
ment
ligneux
et
la
vegetation
du
sous-bois.
Ann
Sci
For 45, 275-290
Prodon
R,
Lebreton
JD
(1981)
Breeding
avifauna
of
a
Mediterranean
succession:
the
olm
oak and
cork
oak
series
in
the
eastern
Pyrenees.
I.
Analysis
and
modelling
of
the
structure
gradient.
Oikos 37,
21-28
Rao
CR
(1964)
The
use
and
interpretation
of
principal
component
analysis
in
applied
research.
Sankhya
A
26, 329-359
Romane
F
(1972)
Application
à
la
phytoécologie
de
quelques
méthodes
d’analyse
multivariable.
Dis-
cussion
sur
des
exemples
pris
dans
les
basses
Cévennes
et
les
garrigues
occidentales.
Thèse
de
3e
cycle,
université
de
Montpellier, Montpellier,
France, 184
p
Roux
M
(1985)
Algorithmes
de
classification.
Masson,
Paris, 152
p
Saporta
G
(1990)
Probalités,
analyse
des
données
et
statistiques.
Technip,
Paris,
493
p
Ter
Braak
CJF
(1986)
Canonical
correspondence
ana-
lysis:
a
new
eingenvector
technique
for
multivariate
direct
gradient
analysis.
Ecology 67,
1167-1179
Ter
Braak
CJF
(1987)
The
analysis
of
vegetation-envi-
ronment
relationships
by
canonical
correspondence
analysis.
Vegetatio
69,
69-77