Báo cáo khoa học: "Genetic variation of the pilodyn-girth relationship in Norway spruce (Picea abies L [Karst])*" doc
Bạn đang xem bản rút gọn của tài liệu. Xem và tải ngay bản đầy đủ của tài liệu tại đây (657.99 KB, 14 trang )
Original
article
Genetic
variation
of
the
pilodyn-girth
relationship
in
Norway
spruce
(Picea
abies
L
[Karst])*
P
Rozenberg,
H
Van
de
Sype
Station
d’amélioration
des
arbres
forestiers,
Inra-Orléans,
45160
Ardon,
France
(Received
3
October
1994;
accepted
6
May
1996)
Summary - Genetic
variability
in
the
relationship
between
pilodyn
pin
penetration
(an
indirect
measure
of
wood
density)
and
stem
girth
of
individual
trees
was
assessed
at
three
levels
(provenance,
family
[half-sib]
and
clone)
in
15-year-old
Norway
spruce.
The
relationship
between
pilodyn
and
girth
was
found
to
be
linear
at
all
three
levels,
but
estimated
parameters
of
the
linear
regression
differed
among
genetic
entities
at
the
three
genetic
levels:
provenance,
family
and
clone.
Hence,
accuracy
of
models
relating
wood
density
to
stem
growth
is
increased
when
using
parameters
specific
to
the
genetic
entity
of
interest.
Nevertheless,
model
parameters
for
specific
genetic
entities
were
moderately
correlated
with
mean
values
for
pilodyn
and
girth.
Therefore,
and
at
least
at
clone
level,
selecting
for
high
girth
is
a
way
to
select
for
low
intra-clone
variability
for
wood
density.
spruce
/
pilodyn-girth
relationship
/
genetic
variation
/
wood
/
growth
Résumé -
Variabilité
génétique
de
la
relation
pilodyn-circonférence
chez
l’épicéa
commun
(Picea
abies
L
[Karst]).
La
variabilité
génétique
de
la
relation
entre
la
profondeur
de
pénétration
de
l’aiguille
du
pilodyn
(une
méthode
indirecte
de
mesure
de
la
densité
du
bois)
et
la
circonférence
de
la
tige
a
été
étudiée
aux
niveaux
provenance,
famille
(demi-frères)
et
clone
chez
des
épicéas
communs
âgés
de
15
ans.
Cette
relation
peut
être
décrite
de
façon
satisfaisante
pour
tous
les
génotypes
à
tous
les
niveaux
par
un
modèle
linéaire
simple.
Mais
il
existe
des
différences
significatives
entre
génotypes
pour
les
paramètres
de
cette
relation
linéaire
aux
trois
niveaux
génétiques
provenance,
famille
et
clone.
Donc
la
précision
d’un
modèle
décrivant
la
relation
entre
densité
du
bois
et
croissance
en
grosseur
de
la
tige
est
accrue
quand
on
utilise
les
paramètres
calculés
au
niveau
du
génotype
plutôt
que
ceux
calculés
au
niveau
général.
La
forte
relation
entre
paramètres
des
modèles
et
moyennes
des
génotypes
pour
les
variables
étudiées
suggère
l’idée
que
les
modèles
génotypiques
peuvent
se
déduire
d’un
modèle
général.
Cette
relation
signifie
également
qu’en
sélectionnant
pour
une
circon-
férence
élevée
on
sélectionne
des
génotypes
ayant
une
plus
faible
variabilité
intraclone
pour la
densité
du
bois.
épicea
/
relation
pilodyn-circonférence
/
variabilité
génétique
/
bois
/
croissance
*Paper
presented
at
the
IUFRO
Workshop
S5.01.04,
Hook,
Sweden,
13-17
June
1994.
INTRODUCTION
Modeling
wood
quality
using
a
low
number
of
easy-to-measure
forest
tree
traits
has
been
applied
to
several
forest
tree
species.
Objectives
may
vary
from
simulation
(Leban
and
Duchanois,
1990)
to
prediction
(Colin
and
Houillier,
1991, 1992;
Owoundi,
1992).
Variation
between
stands
in
model
shape
or
in
model
parameters
is
known
and
sometimes
taken
into
consideration
(Nep-
veu,
1991;
Zhang et al,
1993).
Genetic
variation
at
different
levels
within
species
for
wood
quality,
growth,
form
and
adaptation
traits
is
well
known.
This
vari-
ation
is
used
in
forest
tree
breeding
pro-
grams
to
select
and
create
new
genotypes
(Kremer,
1986;
Cornelius,
1994).
For
Nor-
way
spruce
(Picea
abies
L
[Karst])
in
France,
improved
genotypes
must
com-
bine
adaptability,
fast
growth
and
straight
stems
with
good
or
at
least
acceptable
wood
quality
(Ferrand,
1986).
The
presence
of
genetic
variation
in
wood
quality
raises
a
number
of
questions
with
regards
to
its
modeling:
Is
there
genetic
variation
in
the
shape
of
models
(eg,
in
the
analytical
expression)
or
their
parameters
(eg,
regression
coefficients)
when
relating
wood
quality
to
other
traits?
What
is
the
range
of
this
variation
at
different
genetic
levels?
What
happens
if
this
variation
is
not
taken
into
account
in
models?
Few
attempts
have
been
made
to
answer
these
questions.
Colin
et
al
(1993)
and
De-
deckel
(1994)
tried,
and
they
found
no
clear
evidence
of
differences,
respectively,
be-
tween
provenances
and
families
for
model
parameters;
however,
few
provenances
and
families
were
investigated.
On
21
Nor-
way
spruce
clones,
Chantre
and
Gouma
(1994)
found
a
significant
clonal
effect
on
the
residuals
of
a
general
basic
density-
ring
width
relationship.
In
our
study,
three
genetic
levels
within
Norway
spruce
were
investigated,
with
a
large
number
of
entities
within
each
genetic
level.
Wood
quality
was
assessed
through
depth
of
pilodyn
pin
penetration,
an
indirect
way
to
measure
wood
density.
The
pilodyn
is
widely
used
in
forestry
(Cown,
1981)
and
in
forest
tree
breeding
programs
(Villeneuve
et
al,
1987;
Chantre
et
al,
1992;
Adams
et
al,
1993).
Tree
growth
was
assessed
through
girth
measurements.
The
strong
negative
rela-
tionship
between
wood
density
and
radial
growth
in
Norway
spruce
is
often
reported,
and
is
believed
to
be
a
major
question
for
Norway
spruce
breeding
(Zobel
and
Jett,
1995).
A
detailed
study
of
this
unfavorable
relationship
could
help
the
breeder to
better
understand
it
and,
consequently,
better
deal
with
it.
MATERIALS
AND
METHODS
The
material
was
composed
of
991
clones
(from
central
Poland)
representing
321
families
and
25
provenances.
Trees
were
planted
in
spring
1981
in
Reix,
Creuse
(central
France,
alt
530
m),
at
a
spacing
of
2
x
3
m
and
using
a
single-tree
plot
incomplete
block
design
(33
blocks
x
200
trees
=
6
600
trees,
completely
random
assign-
ment
of
ramets).
The
objectives
of
these
plant-
ings
were
to
select
about
50
fast-growing
clones,
taking
wood
quality
and
shape
of
stems
into
ac-
count.
Results
of
the
first
analysis
(Van
de
Sype,
1994)
demonstrated
that
provenances,
families
and
clones
(within
families)
are
significantly
dif-
ferent
for
growth
and
wood
density,
and
that
these
differences
can
be used
to
select
families
or
clones
with
high
performance
in
both
traits.
Stem
height
and
girth
and
pilodyn
pin
penetra-
tion
at
breast
height
were
measured
in
1992,
11
growing
seasons
after
planting
(when
trees
were
15
years
old).
The
Pilodyn
penetrometer
is
an
indirect
tool
for
measuring
wood
density.
Origin-
ally
developed
to
test
soundness
of
wood
poles
in
Switzerland,
it
is
a
hand-held
instrument
which
propels
a
spring-loaded
needle
into
the
wood.
Depth
of
needle
penetration
is
read
directly
from
the
instrument,
and
is
assumed
to
be
well
corre-
lated
with
wood
density
(Hoffmeyer,
1978, 1979;
Cown,
1981).
Because
wood
density
can
be
measured
at
low
cost,
it
is
often
used
in
tree
breeding
studies
(Loblolly
pine,
Sprague
et
al,
1983;
Jack
pine,
Villeneuve
et
al,
1987;
Norway
spruce,
Van
de
Sype,
1991;
Chantre
et
al,
1992;
Douglas
fir,
Adams
et
al, 1993;
Schermann
1994,
etc).
The
instrument
used
was
6
joules,
with
a
pin
size
of
2.5
mm
diameter
and
60
mm
length.
Pin
penetration
was
recorded
through
the
bark
on
two
opposite
sides
of
the
bole,
perpendicular
to
the
direction
of
the
prevailing
wind
(to
avoid
com-
pression
wood).
The
mean
of
the
two
readings
on
each
tree
was
used
in
all
subsequent
analysis.
The
following
steps
were
taken
in
analyzing
the
data
(in
the
following,
pilodyn,
as
a
trait,
means
depth
of pilodyn
pin
penetration).
First,
data
for
individual
trees
were
adjusted
to
environmental
(block)
effects
through
analysis
of
variance
(model: X
ij
=
p
+ C
i
+
Bj
+
ϵ
ij
,
with
clone
effect
(C
i)
having
a
random
effect
and
the block
effect
(B
j)
a
fixed
effect,
and
ϵ
ij
,
a
residual
error).
Inbalances
were
taken
into
account
by
conduct-
ing
analysis
using
the
type
I sum
of
squares
ana-
lysis
of
variance
(ANOVA)
procedure
of
the
MODLI
software,
an
INRA
procedure
developed
using
S-plus
statistical
software
(Anonymous,
1990).
Type
I
sum
of
squares
was
chosen
be-
cause
of
a
strong
genetic
effect
on
the
high
mor-
tality
rate
(dead
trees
were
not
randomly
dis-
tributed
on
the
field;
Van
de
Sype,
1994).
Next,
the
shape
and
strength
of
relationships
between
the
three
measured
traits
were
studied
at
each
genetic
level.
We
calculated
linear
corre-
lation
coefficients
among
individuals
within
each
provenance,
family
and
clone
(phenotypic
corre-
lations),
and
the
associated
probability
(Pvalue)
of
the
correlation
coefficient
given
the
actual
coefficient
is
zero,
and
we
drew
x-y
plots
of
the
relationships.
Due
to
the
unbalanced
design
and
the
high
mortality
rate,
the
number
of
trees
within
genetic
entities
was
very
different
from
one
genetic
entity
to
another;
for
example,
at
the
clone
level,
this
number
varied
from
1
to
12;
less
than
3,
calcu-
lation
of
correlation
is
not
possible,
and
greater
than
3,
the
sample
size
influences
the
precision
of
the
estimated
linear
correlation
coefficient
(r)
and
of
the
estimated
means
for
the
study
traits.
Thus,
for
some
genetic
entities,
sample
size
was
not
sufficient
to
reliably
estimate
corre-
lations
and
means.
Selecting
genetic
entities
only
on
the
basis
of
the
probability
value
(P)
of
the
correlation
between
pilodyn
and
girth
did
not
seem
reasonable,
as
it
was
easy
to
find
genetic
entities
with
very
few
trees,
low
P value
and
high
negative
rvalue
(obviously
nonrealistic),
and
as
there
is
no
evident
link
between
P
and
the
pre-
cision
of
estimation
of
the
mean,
a
size-of-
genetic-entity
criterion
(N)
seemed
necessary.
That
is
why
we
selected
genetic
entities
not
only
on
the
Pvalue
basis,
but
also
on
this
N
criterion.
We
tried
to
estimate
N,
the
minimum
number
of
trees
required
to
correctly
estimate
the
pilodyn-
girth
correlation
and
the
mean
values
for.pilodyn
(pi)
and
girth
(gi),
assuming
that
it
was
not
necessarily
the
same
at
each
genetic
level.
At
each
genetic
level,
and
for
the
genetic
entities
with
the
maximum
number
of
individuals
(ie,
22
provenances
with
at
least
30
trees,
32
families
with
at
least
20
trees
and
29
clones
with
at
least
12
trees),
N
was
estimated:
r,
P,
pi
and
gi
were
calculated
for,
at
first
step,
a
randomly
selected
subsample
of
three
trees.
Then
one
randomly
selected
new
observation
was
added
at
each
sample,
and
r,
P,
pi
and
gi
were
re-estimated.
The
computation
was
reiterated
until
the
sample
size
reached,
respectively,
12,
20
and
30
at
clone,
family
and
provenance
level.
The
proce-
dure
was
repeated
30
times,
enough
to
observe
a
general
trend.
Mean
Pand
variance
of
r,
pi
and
gi
where
calculated
for
each
sample
size.
Graphs
of
the
evolution
of
mean
Pand
variances
of
r,
pi
and
gi
against
N
where
drawn.
We
as-
sumed
that
N
was
the
same
from
one
genetic
entity
to
another
within
each
genetic
level.
N,
then
the
Pvalue,
were
used
to
select
the
genetic
entities
composing
the
sample
(sample
1)
used
to
calculate
the
models and
the
pilodyn
and
girth
means.
Then,
four
linear
models
were
considered
with
girth
or
a
transformation
of
this
variate:
pilodyn
=
a
+
b
x
girth
pilodyn
=
a
+
b
x
(1/girth)
pilodyn
=
a
+
b
x
log
(girth)
pilodyn
=
a
+
b
x
(1/girth
2)
These
models
were
chosen
as
they
seemed
able
to
accurately
describe
the
shape
of
the
pi-
lodyn-girth
plots.
It
did
not
seem
helpful
to
inves-
tigate
possible
use
of
a
nonlinear
model.
Improving
the
first
of
these
models
by
adding
height
as
an
independent
variable
was
also
con-
sidered
(pilodyn
=
a
+
b
x
girth
+
c
x
height).
The
single
linear
model
type
which
best
fit
the
obser-
vations for all
genetic entities,
whatever the
level,
was
chosen.
The
correctness
of
the
models
for
describing
the
pilodyn-girth
relationship
was
evaluated
by
calculating
the
model R
2
and
the
associated
P
value,
the
P
value
of
models
parameters,
and
plots
of
residuals
(residuals
vs
girth
and
resid-
uals
vs
adjusted
pilodyn).
At
each
genetic
level,
regressions
were
based
on
measurements
of
in-
dividual
trees.
In
other words,
at
provenance
and
family
level,
we
did
not
use
family
or
clone
means
in
the
regressions.
Why?
First,
whatever
the
genetic
level,
we
wanted
to
consider
each
genetic
entity
as
an
independent
population,
as
was
done
by
researchers
building
models
relat-
ing
wood
quality
and
growth
(eg,
Leban
and
Du-
chanois,
1990;
Colin
and
Houillier,
1991,
1992;
Nepveu,
1991;
Owoundi,
1992;
Zhang
et
al,
1993).
Second,
due
to
the
high
mortality
rate,
the
number
of
families
within
provenances
and
of
clones
within
families
was
very
different
from
one
genetic
unit
to
another,
and
often
very
low:
it
was
not
possible
to
study
the
pilodyn-girth
relation-
ship
at
provenance
level
using
family
means,
nor
at
family
level
using
clone
means.
We
selected
a
second
sample
(sample
2)
to
conduct
a
covariance
analysis
to test
differences
between
the
genetic
entities
for
the
slope
coeffi-
cient
of
the
previously
calculated
models
at
each
genetic
level.
This
sample
was
selected
using
the
following
criteria:
clones
with
more
than
four
trees,
and
families
with
more
than
three
clones
per
site
(at
least
12
trees
per
family).
Hence,
inbalances
are
reduced
and
the
sample
better
matches
the
linear
model
conditions:
conclu-
sions
from
the
ANOVA
can
be
drawn
with
better
confidence.
Because
of
this
selection,
sample
2
is
not
a
random
sample,
and
covariance
analysis
was
conducted
using
a
fixed
effect
ANOVA.
Analysis
of
variance
on
pilodyn
trait
was
con-
ducted
with
the
sample
2,
using
least
square
es-
timation
and
various
combinations
of
covariates:
1:
girth;
2:
1
+
girth
at
provenance
level;
3:
2
+
girth
at
family
level;
and
4:
3
+ girth
at
clone
level.
The
models
are
as
follows:
Y
ijkl
= m +
α
( X
ijkl
+ ϵ
ijkl
)[1
]
Y
ijkl
=
m
+
(α
+
β
i)
(
X
ijkl
+
ϵ
ijkl
)
[2]
Y
ijkl
=
m
+
(a
+
β
i
+ γ
ij
)
(
X
ijkl
+
ϵ
ijkl
)
[3]
Y
ijkl
=
m
+
(a
+
β
i
+ γ
ij
+
δ
ijk
)
(
X
ijkl
+
ϵ
ijkl
)
[4]
where
Y
ijkl and
X
ijkl are
the
pilodyn
and
girth
meas-
urements,
respectively,
on
the
lth
tree
of
the
kth
clone
(C)
of
the
jth
family
(F) j
of
the
ith
proven-
ance
(P),
m
is
the
general
pilodyn
mean;
a,
β
i,
γ
ij
and
δ
ijk
are,
respectively,
pilodyn-girth
covari-
ation
coefficients
at
the
site,
provenance,
family
and
clone
levels;
and
ϵ
ijkl
is
residual
error.
According
to
Azais
et
al
(1991),
slope
dif-
ferences
among
genetic
entities
can
be
tested
by
successively
comparing
the
models
[1]
to
[3]
to
the
model
[4]
using
the
F statistic:
where
RSS
n
and
RSS
g
are,
respectively,
the
re-
sidual
sum
of
square
of
the
model
(n)
and
of
the
general
model
[4],
and
p
and
q
are
the
degrees
of
freedom
of
these
model
residuals.
For
example,
comparison
of
the
model
[4]
and
[5],
the
null
hypothesis
is:
δ
ij1
=
δ
ij2
=
= δ
ijk
.
We
computed
then
we
computed
the
P
value
associated
with
F,
and
according
to
the
result,
we
accepted
or
rejected
the
null
hypothesis.
is
the
model
used
to test
the
existence
of
a
re-
maining
genetic
effect
on
pilodyn
when
data
are
adjusted
for
the
girth
at
all
genetic
levels.
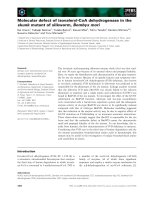
RESULTS
Sampling
of genetic
entities
The
study
of
the
influence
of
the
sample
size
(number
of
trees
within
genetic
entity)
on
the
strength
of
the
relationship
between
girth
and
pilodyn
and
on
the
estimation
of
mean
pilodyn
and
girth
showed
evidence
that
there
exists
a
limit
where
the
P
value
becomes
higher
than
the
usual
5%
limit
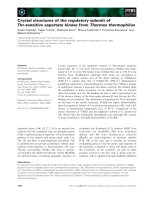
(fig
1)
and
where
mean
linear
correlation
coef-
ficient,
pilodyn
and
girth
becomes
very
un-
steady (that
is
when
variance
of
estimation
of
the
coefficient
of
correlation
and
of
the
mean
is
high;
fig
2).
Results
from
figures
1
and
2
are
summarized
in
table
I.
This
limit
was
chosen
to
decide
what
should
be
the
minimum
number of
trees
in the genetic en-
tities
applied
in
this
study.
N
was
chosen
equal
to
20
for
proven-
ances,
12
for
families.
According
to
table
I,
N
should
be
equal
to
eight
or
ten
for
clones;
however,
too
few
clones
had
ten,
or
even
eight,
and
more
trees.
One
hundred
ten
clones
have
six
and
more
trees.
Thus,
N
was
chosen
equal
to
six
for
clones,
a
com-
promise
between
the
number
of
trees
per
clone and the
number
of
clones.
N
was
used
to
select
all
genetic
entities
in
sample
1.
Table
I shows
the
number
of
genetic
en-
tities
selected
within
each
genetic
level
(sample
1).
There
were
248
different
genetic
entities
studied.
Sample
2
was
used
for
the
covariance
analysis.
There
were
more
clones,
but
less
families
in
sample
2
than
in
sample
1: 337
clones
(vs
110
in
sample
1),
79
families
(vs
114
in
sample
1)
and
21
proven-
ances
(vs
24
in
sample
1).
Choice
of
the
model
(sample 1)
Observation
of
R2
and
residuals
of
calcu-
lated
models
demonstrated
that
’pilo-
dyn
=
a
+
b
x
girth’
was
the
most
general
model,
and
was
usually
as
good
as
or
bet-
ter
than
models
with
more
independant
variables.
Introduction
of
height
improved
R2
significantly
in
only
five
of
248
cases,
and
transformation
did
not
significantly
in-
crease
the
fit
of
the
model
in
any
case.
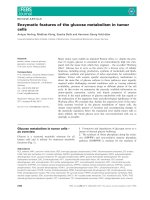
Table
II
shows
a
summary
of
values
of
R2
for
chosen
model
at
all
levels,
and
the
re-
sults
are
illustrated
in
figures
3-5.
Covariance
analysis
(sample
2)
Genetic
variation
for
the
slope
of
the
pilo-
dyn-girth
relationship
and
ANOVAof
pilodyn
with
girth
as
a
covariate
(tables
III
and
IV):
Model
[1]:
girth
as
a
covariate.
The
R2
of
this
model
is
0.521.
Model
[2]:
girth
and
girth
at
provenance
level
as
a
covariate.
The
R2
increase
from
model
[1]
to
[2]
is
only
0.017.
Model
[3]:
girth,
girth
at
provenance
level
and
girth
at
family
level
as
a
covariate.
The
R2
increase
from
model
[2]
to
[3]
is
0.027.
Model
[4]:
girth,
girth
at
provenance
level,
girth
at
family
level
and
girth
at
clone
level
as
a
covariate:
complete
model
to
test
dif-
ferences
among
genetic
entities
for
the
slope
of
the
pilodyn-girth
relationship.
The
R2
increase
from
model
[3]
to
[4]
is
0.086.
The
results
in
table
III
demonstrate
that
the
slope
of
the
pilodyn-girth
relationship
sig-
nificantly
differs
among
provenances,
families
and
clones
(successively
adding
terms
in
the
models
[1],
[2]
and
[3]
signifi-
cantly
improved
them,
even
if
the
R2
in-
crease
from
one
model
to
another
was
sometimes
low).
Model
[5]:
general
model.
The
results
from
table
IV
show
that
there
are
still
differences
among
provenances
for
pilodyn,
but
no
longer
among
families
and
clones.
In
this
sample
(sample
2),
therefore,
most
differences
families
and
clones
for
pilodyn
are
in
fact
differences
for
diameter
growth.
A
test
was
conducted
to
tell
if
leaving
the
terms
’family’
and
’clone’
in
the
model
im-
proved
its
fit
significantly:
Fstatistic
=
1.16,
P value
=
0.0252,
hence
the
fit
increase
is
significant.
Relationships
between
model
parameters
(sample 1)
Whatever
the
genetic
level
and
the
site,
there
are
strong
or
very
strong
linear
rela-
tionships
between
model
parameters:
slope
is
high
when
intercept
is
low
(fig
6
and
table
V
at
all
levels).
Intercept
does
not
have
a
biological
meaning.
This
strong
re-
lationship
between
slope
and
intercept
re-
flects
the
fact
that
regression
lines
all
inter-
sect
each
other
in
a
restricted
zone.
This
zone
is
within
the
range
of
the
two
variates,
around
200-250
mm
girth
and
20
mm
pilodyn.
In
addition,
slope
alone
explains
nearly
all
the
variability
of
the
pilodyn-girth
relation-
ship.
There
is
also
a
significant
moderate
rela-
tionship
between
pilodyn
and
girth
and
model
parameters
(table
V
and
fig
7) -
in
particular,
slope
is
moderately
and
nega-
tively
correlated
with
girth.
DISCUSSION
AND
CONCLUSION
There
is
a
general
relationship
between
growth
and
wood
density
assessed
by
the
pilodyn.
Globally,
a
satisfactory
linear
model
to
represent
the
pilodyn-girth
rela-
tionship
was
found
within
the
range
of
pilo-
dyn-girth
observations
in
this
study.
How-
ever,
with
data
from
a
wider
range,
we
believe
that
this
model
might
be
less
satis-
factory
than
a
model
allowing
a
curvilinear
trend,
slightly
perceptible
in
figures
3
and
6.
Chantre
and
Gouma
(1994)
found
that
a
good
description
of
the
relationship
between
basic
density
(d)
and
ring
width
(w)
in
Norway
spruce
was
d
=
a.log
(w)+b
(where
a
and
b
>
0),
while
Chantre
et
al
(1992)
found
that,
in
the
same
species,
pi-
lodyn
(p)
and
basic
density
relationship
could
be
described
by
d
=
c.p
+
d
(where
c
<
0
and
d
> 0).
Combining
both
ex-
pressions,
it
can
be
written
p
=
α.log
(w)
+
p
(where
α
and
β
> 0);
this
could
be
the
ana-
lytical
expression
of
the
curvilinear
model
mentioned
earlier.
Unlike
Colin
et
al
(1993)
and
Dedeckel
(1994),
and
like
Chantre
and
Gouma
(1994),
genetic
entities
were
significantly
different
for
at
least
one
parameter
of
the
linear
model
between
girth
and
pilodyn
at
the
provenance,
family
and
clone
level
(in
our
case,
slope,
as
demonstrated
by
the
covariance
analysis,
table
III).
Most
differences
among
genetic
entities
for
pilodyn
values
are
explained
by
the
pi-
lodyn-girth
relationship
(table
IV).
When
the
pilodyn
data
is
adjusted
for
girth,
and
girth
at
all
genetic
levels,
there
are
still
provenance
differences,
but
no
family
nor
clone
effect.
For
some
different
trees
with
the
same
girth,
pilodyn
partly
depends
on
genetic
identity.
The
absence
of
family
and
clone
effect
may
be
related
with
the
selec-
tion
of
sample
2;
further
studies
on
better
structured
samples
could
help
decide.
A
general
relationship
between
intercept
and
slope
and
structure
of
the
regression
lines
suggest
that
error
of
estimation
of
wood
density
occurs
when
a
model
is
used
to
predict
wood
density
of
individual
trees
or
genetic
entities.
The
accuracy
of
the
model
is
increased
when
using
a
genetic
entity
model
rather
than
a
general
model.
The
precision
increase
is
13%
on
average
(0.651
for
model
[4] -
0.521
for
model
[1
];
table
IV).
The
relationship
between
the
intercept
and
the
slope
of
the
models
is
very
strong
(fig
7).
This
relationship
seems
to
be
the
same
at
each
genetic
level.
There
is
also
a
significant
relationship
between
par-
ameters
of
models
and
mean
values
of
the
studied
traits
at
genetic
entity
level;
thus,
specific
model
parameters
for
individual
genetic
entities
could
be
deduced
from
a
general
model
(genetic-entity-slope
=
f
(genetic-entity-mean-girth)).
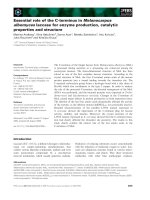
This
trend
can
be
seen
in
figure
6.
At
the
clone
level,
all
trees
representing
a
clone
are
genetically
alike.
Considering
that
girth
is
a
microsite
fertility
index
and
that
trees
of
the
same
clones
are
different
for
girth
and
pilodyn
(even
after
adjustment
of
block
effect),
these
remaining
dif-
ferences
are
small-scale
environmental
dif-
ferences.
Thus,
the
within-clone
relation-
ship
between
girth
and
pilodyn
is
an
environmental
relationship.
The
same
rela-
tionship
calculated
using
mean
girth
and
mean
pilodyn
at
clone
level
is
quite
strong
(table
V):
fast-growing
clones
will
always
have,
in
the
same
site
conditions,
wood
with
lower
density
than
slow-growing
clones.
At
a
given
level
for
girth,
however,
there
is
some
variability
for
mean
pilodyn,
and
thus
possibilities
for
selection.
The
range
of
this
variation
is
between
less
than
1
(provenances)
and
more
than
4
(clones)
mm
of
pilodyn
pin
depth
of
pene-
tration
in
our
study
(fig
6).
Chantre
et
al
(1992)
found
that
the
relationship
between
the
pilodyn
pin
depth
of
penetration
and
the
wood
basic
density
was
a
simple
linear
one
(Norway
spruce).
According
to
this
relation-
ship,
the
range
of
the
variation
is
between
12
to
48
g/dm
3
in
terms
of
basic
density:
this
is
not
negligible,
and
the
breeder
can
use
the
value
of
the
pilodyn
as
a
selection
criteria,
before
or
after
selecting
for
girth.
Nevertheless,
there
is
also
a
low,
nega-
tive
and
highly
significant
genetic
relation-
ship
between
slope
of
the
within-clone
re-
lationship
and
clone
mean
girth
(table
V).
The
range
of
this
relationship
is
quite
high:
for
example,
slope
ranges
from
0.08
for
slow-
growing
families
(mean
girth
=
180
mm)
to
0.02
for
fast-growing
families
(mean
girth
=
240
mm)
(fig
8).
Thus,
as
the
fertility
of
a
site
increases
by
1
cm
in
terms
of
girth,
basic
density
will
decrease
on
an
average
of
0.6
to
0.8
g/dm
3
for
a
slow-growing
fam-
ily,
according
to
Chantre
et
al
(1992).
On
the
other
hand,
a
fast-growing
family
will
only
loose
0.3
to
0.4
g/dm
3
for
the
same
site
fertility
increase.
This
trend
is
still
higher for
clones:
the
basic
density
decrease
may
range
from
1.0
to
only
0.2
g/dm
3.
In
others
words,
clones
with
high
produc-
tion
and
low
density
have
a
less
unfavor-
able
environmental
relationship
between
girth
and
pilodyn,
and
thus
a
lower
intra-
clone
variability
for
wood
density,
than
clones
with
low
production
and
high
den-
sity.
In
the
same
environment,
wood
den-
sity
of
the
trees
of
such
a
clone
will
be
more
homogeneous
among
individuals;
this
is
a
constant
request
from
the
wood
industry
(Zobel
and
Jett,
1995).
The
slope
of
the
pilodyn-girth
relationship
can
be
used
as
a
secondary
selection
criteria,
behind
girth
and
pilodyn.
There
is
no
significant
relationship
be-
tween
pilodyn
and
slope
at
clone
level
(table
V);
thus,
selecting
for
a
low
slope
at
a
given
level of
girth
will
have
no
effect
on
wood
density.
Concurrently,
this
im-
plies
that
selecting
for
a
low
slope
at
a
given
level
of
density
will
cause
a
small
girth
increase.
ACKNOWLEDGMENTS
Thanks
to
N
Schermann
for
reviewing
earlier
drafts
of
this
paper.
Thanks
also
to
the
two
anonymous
reviewers
for
their
very
complete,
interesting
and
relevant
commentaries.
REFERENCES
Anonymous
(1990)
S
Modli.
BAO/Document
N°09/90,
NCY/GL,
Département
d’informatique,
Inra,
Paris,
France, 21
Adams
T,
Aitken
S,
Balduman
L,
Schermann
N
(1993)
Pilodyn
repeatability
study.
In:
Pacific
Northwest
Tree
Improvement
Research
Cooperative
Annual
Report
1992-93.
Oregon
State
University,
Corvallis,
OR,
USA,
29-35
Azais
JM,
Bastien
C,
Berthier
G,
Chabanet
C,
Durier
C,
Gasqui
P,
Goyeau
H,
Griveau
Y,
Hébert
Y,
Hommet
G,
Hulmel
M,
Lefort-Buson
M,
Membre JM,
Moisan
A,
Pellerin
S,
Pinochet
X,
Solari
A,
Volaire
F,
Turk-
heim
E,
Lavergne
JC
(1991)
Modèle
linéaire,
Ma-
nuel du
formateur,
Module
2-3,
Inra,
Formation
per-
manente,
Paris,
France
Chantre
G,
Sutter-Barrot
E,
Gouma
R,
Bouvet A (1992)
De
l’intérêt
de
l’utilisation
du
pilodyn
dans
l’étude
de
la
qualité
du
bois:
application
à l’épicéa
commun
et
à
l’épicéa
de
Sitka.
Ann
Afocel 1992,
145-177
Chantre
G,
Gouma
R
(1994)
Influence
du
genotype,
de
l’âge
et
de
la
station
sur
la
relation
entre
l’infraden-
sité
du
bois
et
la
vigueur
chez
l’épicéa
commun
(Picea
abies
Karst).
Ann
Rech
Sylv 61-89
Colin
F,
Houillier
F
(1991)
Branchiness
of
Norway
spruce
in
north-eastern
France:
modeling
vertical
trends
in
maximum
nodal
branch
size.
Ann
Sci
For
48, 679-693
Colin
F,
Houillier
F
(1992)
Branchiness
of
Norway
spruce
in
north-eastern
France:
predicting
the
main
crown
characteristics
from
usual
tree
measure-
ments.
Ann Sci For 49,
511-538
Colin
F,
Houillier
F,
Joannes
H,
Haddaoui
A (1993)
Mo-
délisation
du
profil
vertical
des
diamètres,
angles
et
nombres
de
branches
pour
trois
provenances
d’épi-
céa
commun.
Silvae
Genet 42,
206-222
Cornelius
J
(1994)
Heritabilities
and
additive
genetic
coefficient
of
variation
in
forestry.
Can
J
For
Res
24,
372-379
Cown
DJ
(1981)
Use
of
the
pilodyn
wood
tester
for
es-
timating
wood
density
in
standing
trees-influence
of
site
and
tree
age.
Forest
Research
Institute,
New
Zealand
Forest
Service,
bulletin
n°
13
Dedeckel
A (1994)
La
densité
du
bois
de
douglas
(Pseu-
dotsuga
menziesii Mirb
[Franco]):
la
variabilité
des
facteurs
microdensitométriques
et
l’effet
génétique.
DEA
sciences
du
bois,
Inra-Nancy,
Engref,
France,
24
Eyono Owoundi
R
(1992)
Modélisation
de
la
rétractibilité
du
bois,
en
relation
avec
des
paramètres
de
la
struc-
ture
de
l’accroissement
annuel
et
de
la
position
dans
l’arbre
chez
Quercus
robur
L
et
Quercus
petraea
Liebl.
Thesis,
École
nationale
du
genie
rural
des
eaux
et
forêts,
Nancy,
France
Ferrand
JC
(1986)
Le
programme
d’amélioration
de
l’épicéa
commun.
Amél
Génét
Arbres
For
125-129
Hoffmeyer
P
(1978)
The
pilodyn
instrument
as a
non-
destructive
tester
of
the
shock
resistance
of
wood.
Non-destructive
testing
meeting,
Vancouver,
WA,
USA,
August
1978
Kremer
A
(1986)
Méthodes
et
strategies
de
selection.
Amél
Génét Arbres
For 89-101
Leban JM,
Duchanois
G
(1990)
SIMQUA:
un
logiciel
de
simulation
de
la
qualité
des
bois.
Ann
Sci
For
47,
483-493
Nepveu
G (1991),
La
variabilité
du
bois.
In:
Le
matériau
bois.
Arbolor,
Nancy,
France,
56
Schermann
N
(1994)
Étude
des
paramètres
génétiques
de
trois
populations
de
douglas
vert
(Pseudotsuga
menziesii [Mirb]
Franco),
analyse
d’un
diallèle
16
x
16,
conséquences
pour
la
stratégie
d’amélioration
génétique
de
l’espèce.
Thesis,
INA-PG-INRA
Or-
léans,
France, 117
Sprague
JR,
Talbert
JT,
Jett
JB,
Bryant
RL
(1983)
Utility
of
the
pilodyn
in
selection
for
mature
wood
specific
gravity
in
Loblolly
pine.
For Sci 29,
696-701
Van
de
Sype
H
(1994)
Clones
(Compte
rendu
des
pre-
miers
résultats
des
tests
INRA
6.352.1,
6.352.2
et
6.351,
Document
Interne),
INRA-Orléans,
France
Villeneuve
M,
Morgenstern
EK,
Sebastian
LP
(1987)
Estimation
of
wood
density
in
family
tests
of
jack
pine
and
black
spruce
using
the
pilodyn
tester.
Can
J
For
Res
17,
1147-1149
Zhang
SY,
Eyono
Owoundi
R,
Nepveu
G,
Mothe
F,
Dhôte
JF
(1993)
Modelling
wood
density
in
Euro-
pean
oak
(Quercus petraea
and
Quercus
robur)
and
simulating
the
silvicultural
influence.
Can
J
For
Res
23,
2587-2593
Zobel
B,
Jett
J
(1995)
Genetics
of
Wood
Production.
Springer-Verlag
(Springer
series
in
wood
science),
Berlin,
337