Báo cáo khoa học: "Allometric relationships for biomass and leaf area of beech (Fagus sylvatica L)" pdf
Bạn đang xem bản rút gọn của tài liệu. Xem và tải ngay bản đầy đủ của tài liệu tại đây (664.08 KB, 12 trang )
Original
article
Allometric
relationships
for
biomass
and
leaf
area
of
beech
(Fagus
sylvatica
L)
HH
Bartelink
Wageningen
Agricultural
University,
Department
of Forestry,
PO
Box
342,
6700
AH
Wageningen,
the
Netherlands
(Received
13
September
1995;
accepted
26
February
1996)
Summary -
The
objectives
of
this
study
were
i)
to
establish
allometric
relationships
among
stem
and
crown
dimensions,
biomass,
and
leaf area, ii)
to determine
the
relative
aboveground
biomass
distribution,
iii)
to quantify
the
relationship
between
leaf
area
and
the
water-conducting
cross-sectional
stem
area,
iv)
to
determine
the
vertical
gradient
of
the
specific
leaf
area
(SLA)
and
v)
to
estimate
aboveground
stand
biomass
and
leaf
area
index
(LAI).
Thirty-eight
trees
were
sampled,
ranging
in
age
from
8-59
years.
Tree
biomass
amounts
increased
with
increasing
diameter
at
breast
height
(dbh).
Nonlinear
models
on
dbh
explained
more
than
90%
of
the
biomass
variance;
regressions
improved
when
tree
height
was
used
as
well.
Crown
dimensions
increased
with
stem
size.
A
linear
relationship
was
found
between
basal
area
and
crown
length.
Crown
projection
area
was
nonlinearly
related
to
leaf
area
and
crown
biomass.
The
fraction
of
dry
matter
present
in
the
stem
generally
increased
with
tree
biomass,
but
differently
for
trees
from
different
diameter
classes.
The
ratio
between
leaf
and
branch
biomass
decreased
significantly
with
increasing
tree
size.
The
ratio
between
leaf
biomass
and
leaf
area
(SLA)
was
relatively
constant
for
whole
trees,
amounting
on
average
to
172
cm
2
g
-1
.
SLA
generally
increased
from
the
tree
top
down
to
the
crown
base;
this
pattern
did
not
significantly
differ
among
trees
within
a
stand.
The
rate
of
change
decreased
with
decreasing
canopy
closure.
A
strong
linear
relationship
existed
between
leaf
area
and
sapwood
area:
the
ratio
was
affected
by
the
height
of
the
crown
base.
Aboveground
stand
biomass
ranged
from
6
to
167
ton
ha-1
,
and
increased
linearly
with
stand
age.
LAI
reached
a
maximum
of
seven;
the
leveling
off
was
ascribed
to
self-thinning.
Fagus
sylvatica
/
allometry
/
sapwood
/
biomass
/
self-thinning
Résumé -
Relations
allométriques
entre
la
biomasse
et
la
surface
foliaire
du
hêtre
(Fagus
sylvatica
L).
Les
objectifs
de
l’étude
étaient
i)
l’établissement
de
relations
allométriques
entre
la
dimension
du
tronc,
la
dimension
de
la
couronne,
la
biomasse,
et
la
surface
foliaire,
ii)
le
calcul
de
la
distribution
de
la
biomasse
aérienne
entre
différents
organes,
iii)
la
quantification
des
relations
entre
la
surface
foliaire
et
la
section
du
tronc,
iv)
l’établis-
sement
du
gradient
vertical
de
la
surface
foliaire
spécifique
(SLA),
et
v)
l’estimation
du
biomasse
aérienne
et
de
l’indice
foliaire
(LAI).
Au
total,
38
individus
ont
été
échantillonnés,
dont
l’âge
variait
entre
8
et
59
ans.
En
général,
la
biomasse
augmente
avec
le
diamètre
du
tronc
à
1,30
m.
Des
modèles
non-linéaires
du
diamètre
expliquent
plus
de
90
%
de
la
variation
de
la
biomasse.
Les
régressions
étaient
améliorées
dans
les
cas
où
le
diamètre
et
la
hauteur
étaient tout
deux
inclus.
La
dimension
de
la
couronne
augmente
avec
le
diamètre
du
tronc.
Tel:
(31)
317 482 849;
fax: (31) 317
483
542;
e-mail:
La
surface
et la
hauteur
de
la
couronne
augmentent
avec
le
diamètre
du
tronc.
La
surface
de
la
projection
de
la
couronne
est liée
de
façon
non-linéaire
avec
la
surface
foliaire
et la
masse
de
la
couronne.
Les
proportions
des
matériaux
secs
des
branches
augmente
avec
la
biomasse.
La
proportion
entre
la
biomasse
des
feuilles
et
la
biomasse
des
branches
diminue
avec
l’augmentation
de
la
hauteur
de
l’arbre.
La
relation
entre
la
biomasse
des
feuilles
et la
SLA est
constante
et
a
une
moyenne
de
172
cm
2
g
-1
.
SLA
croît
du
sommet
de
la
couronne
vers
la
base
de
la
couronne.
Cette
relation
ne
changeait
pas
entre
les
arbres
dans
la
parcelle
étudiée.
La
vitesse
de
variation
de
SLA
diminue
dans
des
conditions
plus
ouvertes.
La
relation
linéaire
entre
la
surface
des
feuilles
et
la
surface
d’aubier
est influencée
par la
hauteur
de
la
base
de
la
couronne.
La
biomasse
aérienne
varie
entre
6
et
167
t
ha-1
,
et
croît
de
façon
linéaire
avec
l’âge
de
la
parcelle.
LAI
était
entre
3
et
7 :
maximum
LAI
était
liée
avec
mortalité
naturelle.
Fagus
sylvatica
/
allometry
/
aubier
/
biomasse
/
mortalité
naturelle
INTRODUCTION
Allometric
relationships
among
tree
dimen-
sions,
biomass
amounts
and
foliage
area
form
useful
tools
when
developing
mechanistic
mo-
dels
of
forest
growth
(see
Jarvis
and
Leverenz,
1983;
Causton,
1985).
Leaf
area
is
generally
considered
to
play
a key
role
as
it
is
the
main
variable
controlling
radiation
interception.
The
amount
of leaf
area
is
functionally
related
to
the
water-conducting
sapwood
area
(Shinozaki
et
al,
1964;
Jarvis
and
Leverenz,
1983),
and
to the
branch
biomass,
which
mechanically
supports
the
foliage.
The
stem
provides
the
physiological
and
phy-
sical
support
of
the
crown.
Sapwood
area
is
re-
lated
to
the
amount
of
water-transpiring
foliage
(Jarvis
and
Leverenz,
1983),
stem
diameter
in-
dicates
the
amount
of
biomass
that is
supported
(Causton,
1985),
whereas
the
relationship
be-
tween
stem
diameter
and
tree
height
and/or
crown
dimensions
will
be
determined
by
the
need
for
mechanical
stability
(Niklas,
1992).
Stem
dimensions
therefore
form
important
in-
dicators
of
crown
size.
Not
enough
data
are
available
yet
to
build
re-
liable mechanistic
models
(Cannell,
1989).
The
present
study
therefore
focused
on
tree
dimen-
sions,
biomass and
leaf
area
interrelationships
of beech
(Fagus
sylvatica
L),
as
part
of
the
de-
velopment
of
a
mechanistic
model
of
forest
growth.
The
aims
of the
study
were: i)
to
estab-
lish
allometric
relationships
among
stem
and
crown
dimensions,
biomass
amounts,
and
leaf
area, ii)
to
determine
the
aboveground
dry
mat-
ter
distribution,
iii)
to
quantify
the
relationship
between
sapwood
area
and
leaf
area,
iv)
to
de-
termine
the
vertical
gradient
of
the
specific
leaf
area
(SLA)
within
the
crown
and
v)
to
estimate
aboveground
stand
biomass
and
leaf area
index
(LAI).
The
results
of
this
study
will
be
used
to
simulate
growth
and
yield
of
forest stands.
METHODS
Data
collection
Thirty-eight
trees
were
selected
from
six
even-
aged
beech
stands, located
in
a
forest
area
in
the
centre
of
the
Netherlands.
To
obtain
a
range
of
tree
sizes,
stands
of different
ages
were
chosen.
All
stands
were
growing
on
acid
brown
podso-
lic
soils
in
ice-pushed
preglacial
deposits
with
deep
groundwater
tables
(>
5
m
below
surface).
Stand
characteristics
were
derived
from
measu-
ring
the
diameter
at
breast
height
(dbh)
of
all
trees
in
a
certain
sample
area,
and
from
the
heights
of
the
selected
trees
(table
I).
The
sizes
of
the
sample
areas
varied
between
250
and
1 000
m2,
including
at
least
36
trees:
the
largest
sample
consisted
of
81
trees.
Within
the
sample
areas
the
trees
were
divided
into
two
diameter
classes
(’small
trees’
versus
’large
trees’)
of
equal
tree
number:
from
each
class
one
to
three
sample
trees
were
chosen
which
had
dbhs
equal
or
close
to
the
average
dbh
of
that
class.
Accor-
ding
to
the
criteria
of
Kraft
(1884),
all
small
trees
could
be
classified
as
suppressed
indivi-
duals,
whereas
the
large
trees
were
classified
as
(co-)dominants.
Sampling
took
place
in
the
second
half of July
and
the
first
half
of
August,
in
1990,
1992 and
1993
(table
I).
Before
felling,
vertical
crown
projection
area
was
determined.
Horizontal
crown
extension
was
estimated
visually
from
the
ground
in
eight
different
azimuthal
direc-
tions:
crown
projection
area
was
estimated
from
the
average
crown
radius.
After
felling,
tree
length
was
measured.
From
a
subsample
of
20
trees,
height
of
the
crown
base
(height
of
the
lowest
living
foliage,
excluding
epicormics)
was
measured
as
well.
Random
leaf
samples
were
collected
from
each
crown
to
determine
average
SLA (cm
2
fresh
area/gram
dry
weight).
The
crowns
of
the
1993
sample
trees
were
divi-
ded
into
ten
horizontal layers
of
approximately
uniform
depth,
and
at
each
boundary
a
subs-
ample
of
20-25
leaves
was
taken
to
determine
height-related
SLA
differences.
Next,
all
living
branches
and
leaves
were
collected: for
each
tree
the
leaf-bearing
branches
were
cut
into
smaller
pieces
(with
a
maximum
length
of
1.5
m)
and
put
into
plastic
bags,
whereas
the
lea-
fless
branch
parts
were
sawn
into
4
m
pieces.
All
biomass
samples
were
taken
to
the
labora-
tory.
Stem
volume followed
from
stem
diameter
measurements
at
regular
distances
along
the
stem.
From
each
tree
a
stem
disk
was
removed
at
breast
height
and
taken
to
the
laboratory.
In
the
laboratory,
projected
leaf
areas
of
the
fresh
leaf
samples
were
determined
using
the
Delta-T
Image
analyses
system.
The
leaf-bea-
ring
branches
were
dried
for
2
days
at
22-25 °C
in
a
drying
chamber
(relative
air
humidity
de-
creased
to
approximately
30%),
to
simplify
the
separation
of foliage
and
woody
parts.
After
the
leaves
had
been
removed
physically,
samples
were
oven-dried
to
determine dry
weights
of the
leaf (24
h;
70
°C)
and
of the
defoliated
branches
(48
h;
105
°C),
and
to
estimate
total
dry
weights.
The
leafless
branch
parts
were
chipped
and
weighed;
dry
weight
was
determined
based
on
the
ratio
between
fresh
weight
and
oven-dry
weight
of
a
sample
of
chipped
branch
parts.
To-
tal
branch
dry
weight
followed
from
summing
the
dry
weights
of
the
defoliated
branches
and
the
leafless
branch
parts.
Stem
dry
weight
was
determined
by
multiplying
stem
volume
with
a
wood
basic
density
of 550
kg
dry
weight
per
m3
fresh
volume
(Burger,
1950).
As
the
boundary
between
sapwood
and
heart-
wood
can
be
difficult
to
recognize
in
beech
(Zimmermann,
1983;
Hillis,
1987),
the
visual
check
was
accompanied
with
the
application
of
several
chemical
solutions
which
work
on
dif-
ferences
in
chemical
composition
between
sapwood
and
heartwood
(Bamber
and
Fukaza-
wa,
1985; Hillis,
1987):
we
applied
ferric
chlo-
ride,
floroglucinol,
fuchsine,
safranine
and fast-
green,
respectively.
The
cross-sectional
area
of
each
sapwood
ring
was
determined
using
a
di-
gital
stem
disk
analysis
system.
Data
analysis
Relationships
between
stem
and
crown
dimen-
sions,
biomass
amounts
and
leaf
area
were
ana-
lyzed.
Crown
silhouette
area
(horizontal
projec-
tion)
was
derived
from
crown
length
and
vertical
projection
area,
assuming
that
the
crown
can
be
described
by
an
ellipsoid.
Apart
from
the
total
sapwood
area
at
breast
height
(sa
bh),
also
the
cumulative
area
of
the
most
re-
cent
growth
rings
was
determined.
The
area
of
only
the
most
recent
rings
might
be
closer
rela-
ted
to
total
leaf
area
because,
in
general,
the
contribution
of
a
growth
ring
to
the
vertical
wa-
ter
transport
declines
with
ring
aging
(Zimmer-
mann,
1983).
In
order
to
be
able
to
include
data
from
younger
trees
as
well,
only
up
to
six
growth
rings
were
taken
into
account.
Biomass
distribution
was
described
as
a
func-
tion
of
total
aboveground
biomass.
In
this
ap-
proach,
first
the
ratios
of
foliage
to
stem
dry
weight
and
branch
to
stem
dry
weight
are
cal-
culated
and
related
to
the
total
biomass,
after
a
two-sided
logarithmic
transformation.
The
fol-
lowing
relationships
were
analyzed:
were
wl
=
tree
leaf
biomass
(kg);
wb
=
tree
branch
biomass
(kg);
ws
=
tree
stem
biomass
(kg);
wt
=
total
tree
biomass
(kg);
c1
-c
4
=
re-
gres-sion
constants.
From
these
equations,
the
mathematical
des-
criptions
of, respectively,
wl
/w
t,
wb
/w
t
and
ws
/w
t
were
solved
as
functions
of
wt.
Regression
analyses
were
carried
out
using
the
GENSTAT
statistical
package.
All
regres-
sion
estimates
presented
were
significant
(at
least)
at
the
5%
level.
The
fraction
of
variance
accounted
for
(R
2)
has
been
adjusted
for
the
number
of
degrees
of
freedom.
Both
linear
and
nonlinear
models
were
tested.
In
the
case
of linear
regression
analysis
the
mo-
del
was
fitted
by
linear
least
squares.
Linear
re-
gression
analysis
is
commonly
used
in
biomass
research
after
carrying
out
a
so-called
two-si-
ded
log
transformation:
a
log
transformation
(natural
logarithm)
of both
the
dependent
and
the
independent
variables
(Causton,
1985).
In
the
case
of
nonlinear
regression
analysis
the
model
was
fitted
directly
by
nonlinear
least
squares.
The
presentation
of
the
fitted
models
is
in
accordance
with
the
statistical
approach
applied.
In
the
case
of
linear
regression
after
a
log-log
transformation,
the
power
model
deri-
ved
from
the
log
model
is
presented
as
well
to
facilitate
comparison
with
other
models.
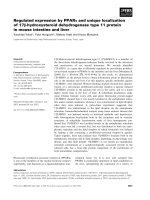
RESULTS
Allometric
relationships
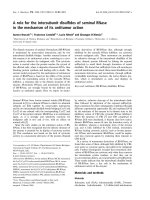
Stem
biomass,
branch
biomass,
leaf
biomass,
crown
biomass
(branches
and
leaves)
and
leaf
area
were
nonlinearly
related
to
dbh
(fig
1),
which,
in
all
cases,
explained
over
90%
of
the
variance
(table
II).
The relationships
did
not dif-
fer
between
trees
from
different
size
classes
or
stands.
Adding
tree
height
as
a
predicting
para-
meter
resulted
in
a
slight increase
of
the
regres-
sion
coefficients
R2
(table
III).
Leaf
area
and
leaf biomass
were
strongly
linearly
interrelated
(R
2
= 0.987); the
average
ratio
(SLA)
amounted
to
172
cm
2
g
-1
.
Stem
and
crown
dimensions
generally
increa-
sed
with
increasing
dbh,
but
large
variability
occurred.
The
relationship
between
dbh
and
tree
height
was
best
described
after
a
log-log
transformation
of
both
variables:
In(h)
=
0.549
+
0.769*ln
(dbh)
R2
=
0.934
[1a]
Transformed
to
a
power
function
it
reads
as
follows:
where
h
=
tree
height
(m)
and
dbh
=
stem
dia-
meter
at
breast
height (cm).
Crown
base
height
(subsample
of
20
trees
from
four
different
stands)
was
rather
constant
within
a
stand,
but
differed
significantly
be-
tween
the
stands.
Crown
length
appeared
to
be
strongly
correlated
with
stem
basal
area.
where
cl
=
crown
length
(m)
and
ba
=
stem
ba-
sal
area
at
breast
height
(dm
2
).
Crown
silhouette
area
and
tree
height
were
clearly
correlated
with
dbh.
Following
Niklas
(1992),
the
product
of
silhouette
area
and
tree
height
was
related
to
dbh,
after
a
two-sided
log
transformation
(see
eq
[3a]).
Exchanging
the
dependent
and
independent
variables
revealed
that
dbh
was
proportional
to
the
0.50
power
of
the
product
of
tree
height
and
crown
silhouette
area.
Transformed
to
a
power
function
it
reads
as
follows:
where
c
sa
= crown
silhouette
area
(m
2
).
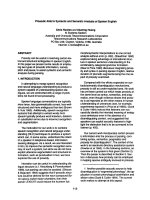
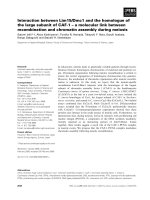
Tree
leaf
area
and
crown
biomass
were
both
correlated
with
crown
projection
area
(fig
2).
The
relationships
were
best
described
by
nonli-
near
regression
equations:
where
la
=
tree
leaf
area
(m
2
);
c
pa
=
crown
pro-
jection
area
(m
2
);
and
w
cb
=
crown
biomass
(kg).
Biomass
distribution
The
biomass
amounts
of
the
tree
components
were
expressed
as
fractions
of
the
total
above-
ground
tree
biomass.
One
tree
had
many
stem
forks;
because
the
boundary
between
’stem’ and
’branch’
was
difficult
to
define,
this
tree
was
excluded
from
the
calculation
of
the
distribu-
tion
curves.
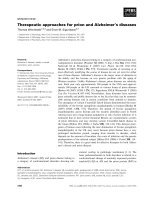
In
general,
the
fraction
stem
bio-
mass
increased
with
increasing
tree
size,
whe-
reas
the
fraction
leaf
biomass
decreased.
However,
the
regression
constants
differed
si-
gnificantly
between
trees
from
different
diame-
ter
classes.
Figure
3
presents
the
relative
bio-
mass
distributions
for
each
diameter
class
separately.
Larger
trees
in
a
stand
appeared
to
have
relatively
more
crown
biomass
than
smal-
ler trees.
The
amount
of
leaf
biomass
decreased
with
increasing
branch
biomass;
no
significant
dif-
ference
between
diameter
classes
occurred.
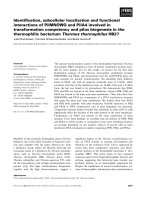
The
ratio
between
leaf
biomass and
branch
biomass
(L/B
ratio)
decreased
with
increasing
tree
size.
The
most
significant
relationships
appeared
when
the
L/B
ratio
was
related
to
dbh,
tree
height
or
crown
biomass
(fig
4).
Specific
leaf
area
Strong
variation
in
SLA
was
found.
SLA
of
leaf
samples
varied
between
80
and
340
cm
2
g
-1
,
but
overall
SLA
was
remarkably
consistent
among
the
trees
(weighted
average
SLA
was
172
cm
2
g
-1
,
with
a
standard
deviation
of
16
cm
2
g
-1).
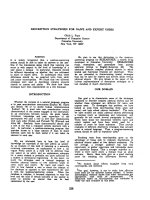
Figure
5
presents
the
pattern
of
change
of
average
SLA
within
the
crown,
derived
from
data
of
the
1993
sample
trees.
In
the
tree
top
SLA
was
80-
120
cm
2
g
-1
,
increasing
to
300-340
cm
2
g
-1
at
the
crown
base.
The
pattern
was
consistent
among
the
stands,
though
in
the
youngest
stand
height-related
differences
were
less
pronoun-
ced.
To
investigate
the
role
of
canopy
closure,
SLA
measurements
were
also
carried
out
on
a
small
solitary
tree
(height
=
2
m).
In
this
tree
SLA
showed
the
same
trend,
but
differences
were
less
pronounced
than
in
the
forest-grown
trees:
SLA
decreased
from
on
average
of
180
cm
2
g
-1
at
the
crown
base
to
100
cm
2
g
-1
at
the
tree
top.
Sapwood-leaf
area
relationships
None
of
the
chemical
indicators
applied
indica-
ted
any
presence
of
heartwood;
thus,
hence
sapwood
area
was
considered
to
be
equal
to
ba-
sal
area
(without
bark)
in
all
sample
trees.
Tree
leaf
area
appeared
to
be
strongly
correlated
with
this
sapwood
area
(sa
bh).
Ignoring
the
nonsigni-
ficant
intercept
resulted
in
a
leaf
area-sapwood
area
ratio
of
0.331
m2
cm-2
(R
2
= 0.926);
how-
ever,
the
relationship
differed
significantly
be-
tween
stands.
Stand
differences
disappeared
when
crown
dimensions,
especially
the
height
of
the
crown
base,
were
used
as
covariables.
Crown
length
data
were
available
for
the subs-
ample
(20
trees).
In
this
subsample
sabh
explai-
ned
96.2%
of the
variance
in
leaf area.
This
per-
centage
was
increased
to
98.2
when
the
height
of
the
crown
base
was
applied
as
a
co-variable.
Equation
[6]
implies
that
in
case
of
identical
sabh
amounts,
trees
having
the
lowest
crown
base
will
have
the
highest
amount
of
leaf
area.
where
la
=
tree
leaf
area
(m
2
);
sabh
= tree
sapwood
area
at
breast
height
(cm
2
);
and
h
cb
=
height
of
the
crown
base
(m).
Total leaf
area
also
appeared
to
be
correlated
with
the
area
of
the
most
recent
growth
rings.
Best
correlation
was
with
the
cross-sectional
area
of
the
three
youngest
rings
(R
2
=
83.6%).
Stand
biomass
and
leaf
area
index
Stand
biomass
and
LAI
(table
IV)
were
derived
by
applying
the
equations
from
table
II.
In
fig-
ure
6
some
stand
totals
are
compared
with
data
from
the
literature,
as
collected
by
Cannell
(1982):
all
data
on
beech
are
included
here,
co-
vering
different
sites
and
management
regimes.
Present
data
showed
an
almost
linear
increase
of
the
total
aboveground
stand
biomass
with
stand
age
(fig
6a).
LAI
in
the
closed-canopy
stands
generally
varied
between
5.5
and
7.2
(fig
6b): the
low
value
of
stand
2
can
be
ascribed
to
the
large
contribution
to
the
canopy
of
the
birches.
DISCUSSION
AND
CONCLUSION
Allometric
relationships
The
amounts
of
biomass
presently
found
are
comparable
with
data
from
Burger
(1950)
and
Pellinen
(1986).
Dbh
explained
a
large
part
of
the
variation
in
tree
biomass, in
accordance
with
results
of others
(Burger,
1950; Kakubari,
1983;
Pellinen,
1986).
The
relationship
between
dbh
and
stem
biomass
was
stand-independent,
which
can
be
expected
as
both
are
cumulative
parameters.
The
relationship
between
dbh
and
leaf and
branch
biomass, in
contrast,
can
be
ex-
pected
to
differ
between
stands,
as
stand
density
will
affect
crown
form
and
size
(Burger,
1950).
Adding
parameters
accounting
for
stand
struc-
ture
will
reduce
such
variability,
as
was
presen-
tly
indicated
by
the
increased
R2
when
tree
height
was
added
to
the
allometric
rela-
tionships.
In
the
present
data
set,
however,
though
some
stand
effects
were
visible,
the
re-
lationships
between
dbh
and
foliage,
respecti-
vely,
branch
biomass
did
not
significantly
differ
between
stands.
The
presently
established
mo-
dels
fitted
well.
However,
because
the
leaf
and
branch
biomass
of
the
two
largest
trees
had
a
relatively
strong
effect
on
the
parameter
estima-
tions,
care
should
be
taken
when
the
models
are
used
for
extrapolation.
The
well-known
relationship
between
dbh
and
tree
height
was
confirmed
by
the
present
data
set
(eq
[1]).
This
relationship
can
be
regar-
ded
indicative
for
the
mechanical
support
func-
tion
of
the
stem.
According
to
Niklas
(1992),
dbh
is
expected
to
be
proportional to
the
1.5-2.0
power
of
tree
height
when
primarily
biomass
(static
loads)
determines
stem
diameter.
Inver-
ting
dependent
and
independent
variables
in
equation
[1]
results
in
an
exponent
of
1.22,
which
is
clearly
lower.
An
explanation
for
this
might
be
that
crown
size
is
ignored.
In
the
case
where
wind
stress
is
most
important,
dbh
will
be
proportional
to
the
0.33-0.50
power
of
the
product
of
crown
silhouette
area
and
the
tree
height,
depending
on
the
freedom
of the
base of
the
tree
to
move
(Niklas,
1992):
the
presently
found
exponent
of
0.50
supports
this
so-called
constant
stress
model,
implying
that
especially
wind
force
will
determine
the
relative
incre-
ments
in
height
and
diameter.
Biomass
distribution
The
dry
matter
distribution
pattern
presented
in
figure
3
is
comparable
with
the
general
pattern
found
in
many
tree
species
(see
data
Cannell,
1982).
Presently,
relatively
large
stand
mem-
bers
had
a
higher
fraction
of
leaf
and
branch
biomass than
smaller neighbors.
Regarding dia-
meter
class
as
an
indicator
of
dominance
posi-
tion, this
means
that dominance
position
affects
the
amount
of
crown
biomass.
Cannell
(1989)
concludes
that
in
the
case
of increased
inter-tree
competition,
a
lower
fraction
of the
dry
matter
will
be
allocated
towards
the
branches,
and
probably
towards
the
foliage
as
well.
This
coincides
with
the
presently
found
effect
of
dominance
position.
Dominant trees
therefore
invest
more
in
the
cano-
py,
and
are
thus able
to
maintain
a
relatively
large
crown.
Including
an
indicator
of
a
tree’s
domi-
nance
position
would
hence
improve
dry
matter
allocation
keys.
Because
foliage
is
concentrated
at
the
end
of
the
branches
(the
crown
mantle)
in
order
to
op-
timize
radiation
interception
(Kellomaki
and
Oker-Blom,
1981), relatively
more
branch
bio-
mass
will
be
needed
to
physically
support
a
unit
leaf
biomass
when
crown
size
increases.
The
decreasing
L/B
ratio
(fig
4)
can
thus
be
ascribed
to
crown
expansion.
The
ratio
between
leaf
biomass
and
branch
biomass
was
independent
of
diameter
class.
A
certain
amount
of
leaf
biomass
apparently
needs
a
certain
amount
of
supporting
branch
biomass,
independent
of
a
tree’s
dominance
po-
sition,
but
dependent
on
its
size.
Specific
leaf
area
SLA
varied
strongly,
both
in
the
vertical
and
in
the
horizontal
plane
(results
not shown):
values
between
80 and
340
cm
2
g
-1
were
found.
SLA
generally
increased
when
going
from
the
tree
top
downwards
(fig
5).
Comparable
results
have
been
reported
by
Decei
(1983),
Pellinen
( 1986)
and
Gratani
et
al (1987) in
Fagus
sylva-
tica,
and
by
Tadaki
(1970)
in
Fagus
crenata.
The
variation
in
SLA
is
due
to
morphological
differences
between
sun
and
shade
leaves
(Gra-
tani
et
al,
1987),
caused
by
differences
in
light
conditions
within
the
canopy
(Kellomaki
and
Oker-Blom,
1981; Gratani
et al,
1987). The pre-
sently
found
trend
of
SLA
increasing
towards
the
crown
base
can
hence
be
explained
by
the
decrease
in
radiation
availability.
This
is
sup-
ported
by
the
fact that the
rate
of
SLA
increase
was
lower in
the
youngest
stand
and
far lowest
in
the
solitary
tree:
the
light
extinction
rates
here
will
be
less
pronounced
due
to,
respectively,
the
relative
open canopy
(compare
the
basal
areas
in
table I)
and
the
absence
of neighboring
trees.
Thus, stand
density
affects the
rate
of
change
of
SLA
with
depth
in
the
canopy.
Part
of
the
variability
in
SLA
might
also
be
at-
tributed
to
seasonal
effects,
as
data
collection
was
spread
over
3
years.
However,
despite
the
large
variation
in
SLA, overall
SLAat the
tree level
was
consistent
among
the
trees.
Tree
leaf
biomass
and
tree
leaf
area
were
strongly
interrelated
(R
2
=
0.987),
implying
that
at the
tree
level
SLA
is
rather independent
of stand
density.
Sapwood-leaf
area
relationships
Presently, sapwood
area
explained
92.6%
of the
variance
in
leaf
area
(la).
However,
sapwood
area
(sa
bh
)
equaled
basal
area
(without
bark):
no
heartwood
was
found,
which
agrees
with
re-
marks
from
Hillis
(1987)
that
in
beech,
heart-
wood
is
generally
formed
only
after
80-100
years.
Thus,
the
la/sa
bh
ratio
may
as
well
point
to
the
mechanical
as
to
the
functional
support
function
of the
stem.
The
significant role
of the
height
of the
crown
base
in
the
relationship
be-
tween
sabh
and
la
(eq
[6])
is
in
agreement
with
the
pipe
model
theory
(Shinozaki
et
al,
1964):
when
leaf
area
is
related
to
total
cross-sectional
stem
area
(ba),
the
la/ba
ratio
will
decrease
when
going
downward
from
the
crown
base
to
breast
height,
because
transpiring
tissue
is
lack-
ing
here.
The
length
of the
branch-free
bole
thus
affects
the
la/sa
bh
ratio,
as
is
predicted
by
equa-
tion
[6]:
the
higher
the
crown
base,
the
lower
the
leaf
area
per
unit
sapwood
area
measured
at
breast
height.
It
also
implies
that
the
water
con-
ductivity
below
the
crown
is
not
constant
within
the
cross-sectional
stem
area.
This
can
be
ex-
plained
by
the
fact
that
water
conductivity
de-
creases
with
ring
aging,
in
conifers,
in
ring-po-
rous,
as
well
as
in
diffuse-porous
species
like
beech
(Zimmermann,
1983;
Bamber
and
Fuka-
zawa,
1985).
However,
due
to
the
smaller
ves-
sels
in
diffuse-porous
species
when
compared
with
ring-porous
species,
more
growth
rings
can
be
expected
to
contribute
to
the
vertical
wa-
ter
transport
in
beech
than,
for
example,
only
the
recent
one
to
three
rings
as
in
oak
(Rogers
and Hinckley,
1979).
Since
in
this
study
no
water
transport
was
measured,
the
estimation
of the
number
of con-
tributing
rings
was
based
on
the
regression
ana-
lysis.
The
area
of
the
three
most
recent
growth
rings
gave
the
best
result
statistically,
but
ex-
plained
clearly
less
of
the
variation
in
leaf
area
than
did
total
sapwood
area.
Another
reason
for
the
correlation
between
leaf
area
and
area
of the
recent rings
might be
that this reflects
a different
mechanism,
for
example
assimilate
transloca-
tion.
Nevertheless,
regarding
the
aging
of
growth
rings,
tree
leaf
area
can
be
expected
to
be
closer
related
to
the
area
of
a
restricted
num-
ber
of
growth
rings
than
to
the
total
basal
area.
Additional
research
on
the
contribution
of
sepa-
rate
growth
rings
to
vertical
water
transport
is
ne-
cessary
to
determine
whether
a
restricted
number
of (sapwood)
growth
rings
contribute
to
the
water
transport,
as
has
been
found
in
some
ring-porous
species
(Rogers
and
Hinckley,
1979).
Maximum
LAI
and
natural
thinning
The
presently
found
biomass
amounts
are
ra-
ther
low,
which
is
apparently
due
to
the
relative
young
age
of
the
sample
stands
(fig
6a).
Bio-
mass
is
hence
expected
to
further
increase
with
stand
age.
LAI,
in
contrast,
can
be
expected
to
reach
a
site-dependent
maximum
value
(fig
6b).
According
to
the
data
in
figure
6b,
it
seems
that
for
the
present
site
type
a
maximum
LAI
of
seven
is
reasonable,
which
is
reached
as
soon
as
canopy-closure
is
complete.
Note
the
large
variability
in
LAI
values
in
the
literature
data
(Cannell,
1982),
which
is
probably
due
to
site
differences.
LAI
depends
on
the
tree
number
and
the
amount
of leaf
area
per tree,
and
is
not
expected
to
exceed
LAImax
(Jarvis
and
Leverenz,
1983;
Landsberg,
1986).
Thus,
the
following
rela-
tionship
appears:
where
LAImax
= site-specific
maximum
LAI
(ha
ha-1);
N
max
= maximum
number
of
living
trees
(ha
-1);
and
laav
=
average
tree
leaf area
(m-2).
Referring
to
the
presently
found
linear
rela-
tionship
between
leaf area
and
basal
area,
equa-
tion
[7]
can
also
be
described
as:
where
r
is
equal
to
0.331
m2
leaf
per
cm
2
basal
area.
Assuming
a
maximum
LAI
implies
that
self-
thinning
among
the
stand
members
will
occur
(see
Harper,
1977;
Landsberg,
1986).
The
ac-
tual
tree
number
(N)
is
thus
dependent
on
the
maximum
LAI
that
can
be
maintained.
Replacing
N
max
by
N
and
rewriting
equation
[8]
results
in:
where
k
=
(40
000*LAI
max
/
(π*r))
0.5
.
When
expressed
in
terms
of
stem
biomass
(see
table
II)
this
becomes:
where
k2
=
0.0762*k
2.523
.
The
power
represents
the
slope
of
the
self-
thinning
line.
The
value -1.262
is
a
little
lower
than
the
generally
expected -1.5
(Harper,
1977;
White,
1981),
which
probably
is
due
to
the
fact
that
stem
biomass
instead
of total
plant
weight
was
used.
Another
reason
might
be
that
in
the
case
of
increasing
competition,
some
trees
ini-
tially
show
decreasing
leaf
amounts,
so
maxi-
mum
LAI
will
be
reached
just
before
the
onset
of
self-thinning.
Equation
[9]
states
that
as
the
trees
grow
(the
average
diameter
increases),
the
number
of
trees
will
decline:
the
amount
of
biomass
that
can
be
maintained
on
a
certain
site
depends
on
the
site-specific
maximum
LAI.
This
depend-
ency
makes
LAI
a
causal
factor
when
simula-
ting
natural
mortality
in
forest
stands.
A
com-
parable
theoretical
analysis
of
the
role
of
maximum
LAI
was
carried
out
by
Landsberg
(1986).
Applying
equation
[9]
with
the
current
para-
meter
values
also
implies
that
stand
basal
area
remains
constant
as
long
as
LAI
is
at
its
maxi-
mum
value.
From
G
=
N*
(π/40
000)*dbh
2
and
equation
[9]
it
follows
that:
Based
on
the
present
data
and
assuming
LAImax
=
7,
G
is
estimated
at
21
m2
/ha
from
equation [11].
Note,
however,
that
although
presently
no
heartwood
was
detected,
leaf
area
can
be
expec-
ted
to
be
proportional
to
the
water-transporting
cross-sectional
area
rather
than
to
the
basal
area
(Shinozaki
et
al,
1964;
Cannell,
1989).
As
a
re-
sult,
the
term
dbh
-2
in
equation
[11]
should
ac-
tually
be
(water-transporting-area)
-1
.
Because
this
area
is
generally
lower
than
the
tree’s
basal
area,
G
can
be
expected
to
gradually
increase
with
average
tree
diameter,
ie,
with
stand
age.
ACKNOWLEDGMENTS
This
research
was
carried
out
as
part
of
the
EG-
ENVIRONMENT
II
programme
(contract
no
EV5V-CT94-0468/
LTEEF).
The
author
wishes
to
thank
J
Goudriaan,
GMJ
Mohren,
AFM
van
Hees,
the
PhD
students
from
the
Department
of
Theoretical
Production-Ecology
and
two
ano-
nymous
reviewers
for
their
useful
comments
on
earlier
drafts.
REFERENCES
Bamber
RK,
Fukazawa
K
(1985)
Sapwood
and
heartwood.
A
review.
For Abstr 46,
567-580
Burger
H
(1950)
Holz
Blattmenge
und
Zuwachs
X:
die
buche.
Mitt
Schweiz
Anst
Forst
Versuchsw
26,
419-468
Cannell
MGR
(1982)
World
Forest
Biomass
and
Pri-
mary
Production
Data.
Academic
Press,
New
York, NY, USA, 391
p
Cannell
MGR
(1989)
Physiological
basis
of
wood
production:
a
review.
Scand
J
For
Res
4, 459-490
Causton
DR
(1985)
Biometrical,
structural
and
phy-
siological
relationships
among
tree
parts.
In:
At-
tributes
of
Trees
as
Crop
Plants
(MGR
Cannell,
JE
Jackson,
eds),
Inst
Terrestrial
Ecology,
Hun-
tingdon,
UK,
137-159
Decei
I
(1983)
Étude
de
la
phytomasse
du
feuillage
dans
les
peuplements
de
Fagus
sylvatica
L.
In:
Mesures
des
biomasses
et
des
accroissements fo-
restiers
(D
Auclair,
ed),
Proceedings,
IUFRO
S4.01.00
Meeting,
Orléans,
France
Gratani
L,
Fida
C,
Fiorentino
E
( 1987)
Ecophysiologi-
cal
features
in
leaves
of
a
beech
ecosystem
during
the
growing
period.
Bull
Soc
R
Bot
Belg
120,
81-88
Harper
JL
(1977)
Population
Biology
of Plants.
Aca-
demic
Press,
London,
UK,
174-189
Hillis
WE
(1987)
Heartwood
and
Tree
Exudates.
Springer
series
in
wood
science,
Springer-Verlag,
Berlin,
Germany
Jarvis
PG,
Leverenz
JW
(1983)
Productivity
of
tem-
perate,
deciduous
and
evergreen
forests.
In.
Phy-
siological
Plant
Ecology.
IV.
Encyclopedia
of
Plant
Physiology,
New
Series,
Vol 2D
(OL
Lange,
PS
Nobel,
CB
Osmond,
H
Ziegler,
eds),
Springer-
Verlag,
New
York,
NY,
USA,
233-280
Kakubari
Y
(1983)
Vergleiche
Untersuchung
über
die
Biomasse-unterschied
zwischen
europäischen
und japanischen
Buchenwald.
Bull
Tokyo
Univ
For
33,
Faculty
of
Agriculture,
University
of Shi-
zuoka, Japan
Kellomaki
S,
Oker-Blom
P
( 1981 )
Specific
needle
area
of Scots
pine
and
its
dependence
on
light
conditions
inside
the
canopy.
Silva
Fenn
15,
190-198
Kraft
G
(1884)
Beitraege
zur
Lehre
von
den
Dur-
chforstungen,
Schlagstellungen
und
Lichtungstrieben.
Klindworth,
Hannover,
Germa-
ny, 147
p
Landsberg JJ
(1986)
Physiological
Ecology
of Forest
Pro-
duction.
Academic
Press,
New
York,
NY,
USA
Niklas
KJ
(1992)
Plant
Biomechanics:
an
Enginee-
ring
Approach
to
Plant
Form
and
Function.
The
Univ
of Chicago
Press
Ltd,
London,
UK,
410-415
Pellinen
P
(1986)
Biomasseuntersuchungen
im
Kalkbuchenwald.
Dissertation,
Universität
Göttingen,
Germany,
134
p
Rogers
R,
Hinckley
TM
(1979)
Foliar
weight
and
area
related
to
current sapwood
area in
oak.
For
Sci
25,
298-303
Shinozaki
K,
Yoda
K,
Hozumi
K,
Kira
T
(1964)
A
quantitative
analysis
of plant form.
The
pipe
mo-
del theory
II.
Further
evidence
of the
theory
and
its
application
in
forest
ecology.
Jpn
Ecol
14,
133-139
Tadaki
Y
(1970)
Studies
on
the
production
struc-
ture
of
forest.
XVII.
Vertical
change
of
speci-
fic
leaf
area
in
forest
canopy.
J
Jpn
For
Soc
52, 263-268
White
J
(1981)
The
allometric
interpretation
of
the
self-thinning
rule.
J
Theor Biol
89, 475-500
Zimmermann
MH
(1983)
Xylem
Structure
and
the
Ascent
of Sap.
Springer-Verlag,
Berlin,
Germany,
139
p