Báo cáo khoa học: "Linear and non-linear functions of volume index to estimate woody biomass in high density young poplar stands" docx
Bạn đang xem bản rút gọn của tài liệu. Xem và tải ngay bản đầy đủ của tài liệu tại đây (576.47 KB, 11 trang )
Original
article
Linear
and
non-linear
functions
of
volume
index
to
estimate
woody
biomass
in
high
density
young
poplar
stands
JY
Pontailler
R
Ceulemans
J
Guittet
F Mau
1
Laboratoire
d’écophysiologie
végétale
(CNRS
Ura
2154),
bâtiment
362,
université
Paris-XI,
91405
Orsay
cedex,
France
2
Department
of Biology,
University
of Antwerpen
(UIA),
Universiteitsplein
I,
B-2610
Wilrijk,
Belgium
(Received
3
April
1996;
accepted
9
January
1997)
Summary -
Biomass
estimations
are
very
important
in
short
rotation
high
density
stands,
but
usu-
ally
require
some
destructive
sampling.
This
paper
discusses
the
potential
use
of
allometric
rela-
tionships
based
on
volume
index
(height
x
diameter
squared)
for
accurate
and
non-destructive
esti-
mations
of
stem
biomass.
When
using
this
approach,
one
implicitly
assumes
a
constant
conversion
factor
from
stem
volume
index
to
real
stem
volume
as
well
as
a
constant
wood
infradensity
(stem
dry
mass
versus
fresh
volume),
both
assumptions
being
questionable.
Our
results
on
five
different
poplar
clones
grown
at
two
different
sites
(Afsnee,
near
Gent,
Belgium
and
Orsay,
near
Paris,
France)
and
under
two
different
cultural
management
regimes
underscore
the
following
points:
i)
stem
diameter
measured
at
22
cm
aboveground
and
in
two
perpendicular
directions
is
a
relevant
parameter
to
com-
pute
volume
index
in
high
density
poplar
stands;
ii)
power
function
regression
equations
fit
the
stem
volume
index
versus
stem
dry
mass
relationship
better
than
simple
linear
regressions;
iii)
attention
should
be
paid
to
variation
in
wood
infradensity,
which
ranged
from
0.35
to
0.44
kg
dm-3
in
our
study.
short
rotation
forestry
/
high
density
plantations
/
Populus
/
volume
index
/
allometric
relationships
Résumé -
Fonctions
linéaires
et
non
linéaires
de
l’indice
de
volume
pour
l’estimation
de
la
biomasse
sèche
de jeunes
plantations
de
peupliers.
L’estimation
de
la
biomasse
sur
pied
de
parcelles
denses
cultivées
en
courtes
rotations
est
généralement
indispensable
mais
requiert
le
plus
souvent
des
techniques
destructives
lourdes.
Cet
article
discute
de
l’utilisation
potentielle
des
relations
allométriques
utilisant
l’indice
de
volume
(hauteur
du
brin
x
carré
de
son
diamètre
à
la
base)
pour
l’estimation
précise
de
la
biomasse
sèche
de jeunes
tiges
de
peuplier.
Par
ce
type
d’approche,
on
suppose
impli-
*
Correspondence
and
reprints
Tel:
(33)
01 69 15 71 37;
fax:
(33)
01 69 15 72
38;
courriel:
citement
qu’il
existe
un
facteur
de
conversion
constant
entre
volume
vrai
et
indice
de
volume,
et
que
l’infradensité
du
bois
est
constante.
Ces
deux
hypothèses
sont
loin
d’être
rigoureusement
véri-
fiées.
Les
résultats
présentés
ici
portent
sur
cinq
clones
de
peupliers
cultivés
sur
deux
sites
(Afsnee,
près
de
Gand
en
Belgique
et
Orsay,
près
de
Paris)
selon
deux
techniques
culturales
différentes.
Ils
met-
tent
en
évidence
les
points
suivants :
i)
le
diamètre
de
la
tige,
mesuré
à
la
hauteur
de
22
cm
selon
deux
directions
perpendiculaires,
est
un
paramètre
pertinent
pour
le
calcul
de
l’indice
de
volume
de jeunes
brins
de
peupliers ;
ii)
les
tarifs utilisant
une
fonction
puissance
de
l’indice
de
volume
fournissent
des
estimations
plus
précises
de
la
masse
sèche
des
brins
que
ne
le
font
les tarifs
linéaires ;
iii)
les
varia-
tions
de
l’infradensité
du
bois
(ici
de
0,35
à
0,44
kg
dm-3
)
peuvent
réduire
considérablement
la
pré-
cision
de
ces
estimations.
indice
de
volume
/
allométrie
/
Populus
/
sylviculture
en
courte
rotation
INTRODUCTION
Within
the
frame
work
of
the
search
for
alternative,
renewable
energy
sources,
short
rotation
woody
crops
play
an
important
role.
Moreover,
a
renewed
interest
in
these
biomass
production
systems
has
recently
arisen
since
they
do
not
consume
fossil
energy
sources,
and
thus
are
neutral
with
regard
to
the
atmospheric
CO
2
balance
(Ran-
ney et al, 1991
).
Within
the
interest
of
land
set
aside
pro-
grammes
in
industrialized
countries,
a
joint
European
research
program
was
initiated
as
a
collaborative
study
between
the
Univer-
sities
of
Antwerpen,
Edinburgh
and
Paris-
Sud.
The
overall
aim
of
this
project
was
to
explain
the
production
differences
observed
among
different
poplar
clones
in
terms
of
physiological
processes
to
identify
early
selection
criteria.
This
work
supplies
a
use-
ful
tool
to
these
types
of
studies.
The
field
observations
were
made
over
3
years
on
five
poplar
clones
grown
at
two
experimental
sites
(Afsnee,
Belgium
and
Orsay,
France).
More
than
other
genera,
Populus
has
proved
to
be
extremely
well
suited
for
biomass
production,
because
of
its
high
pho-
tosynthetic
capacity
and
its
superior
growth
performance
(Barigah
et
al,
1994). Much
variation
exists
among
different
poplar
clones
in
growth
and
production
aspects
(Heilman
and
Stettler,
1985;
Ceulemans,
1990).
To
date,
many
experimental
trials
with
various
poplar
materials
have
investi-
gated
the
potentials
to
better
capture
the
clonal
differences
in
the
production
perfor-
mance.
These
trials
frequently
use
non-
destructive
methods
to
estimate
biomass
production.
Forest
managers
are
often
faced
with
sev-
eral
estimates
of
plantation
productivity.
Not
only
are
there
different
measures
of pro-
ductivity,
such
as
site
index,
annual
volume
increment
or
standing
volume
at
some
fixed
age,
but
all
of
them
may
be
obtained
from
different
sources.
A
rather
cumbersome
technique
of
assessing
alternative
estimates
of
volume
increment
in
the
absence
of
true
observations
has
been
proposed
by
Reed
and
Jones (1989).
Most
biomass
studies
at
stand
level
utilize
one
of
the
frequently
used
methods:
the
’mean
tree’,
regression
analysis
or
unit
area,
with
the
regression
techniques
being
the
most
commonly
used
(Verwijst,
199 1). The
dependent
variable
(dry
weight
or
biomass)
is
expressed
as
a
function
of
an
indepen-
dent,
easily
measurable
variable
such
as
diameter
at
breast
height
(DBH),
or
height
or
a
combination
of
both
(H·D
2
).
In
young
stands,
DBH
(at
1.30
m)
is
not
a
pertinent
parameter
because
of
the
small
tree
size.
On
the
other
hand,
problems
arise
when
mea-
suring
diameter
close
to
the
ground
because
stems
often
widen
at
that
level.
In
most
cases,
one
assumes
that
wood
biomass
is
proportional
to
H·D
2
in
a
sim-
ple
linear
model
passing
through
the
origin.
When
taking
a
destructive
subsample
and
performing
an
allometric
regression
analy-
sis,
the
result
is
a
linear
regression
that
does
not
pass
through
the
origin
and
that
is
only
valid
for
a
narrow
range
of
tree
sizes
(Ver-
wijst,
1991).
The
objectives
of
this
paper
are
i)
to
illus-
trate
the
limits
of
the
linear
model,
ii)
to
evaluate
power
function
equations
for
pre-
dicting
biomass,
iii)
to
examine
their
respec-
tive
predictive
power
for
large
and
small
tree
sizes
and
iv)
to
underscore
the
role
of
the
variation
in
wood
infradensity
(wood
dry
mass
versus
wood
fresh
volume),
which
is
frequently
neglected
but
might
introduce
another
substantial
uncertainty.
MATERIALS
AND
METHODS
Plant
materials
Five
poplar
(Populus)
clones
were
used
in
this
study.
These
included
two
fast
growing,
inter-
specific
(Populus
trichocarpa
× P
deltoides)
hybrid
clones
(Beaupré
and
Raspalje),
two
native
American
P
trichocarpa
clones
(Columbia
River
and
Fritzi
Pauley)
and
one
Euramerican
refer-
ence
clone
(P
deltoides
x
P
nigra,
cultivar
Robusta).
These
five
clones
differ
in
growth
rate,
in
foliage
structure,
in
gas
exchange
metabolism
and
in
phenology
(Mau
and
Impens,
1989;
Ceule-
mans
et
al,
1993;
Barigah
et
al,
1994).
Details
about
origin,
parentage,
sex
and
productivity
of
these
clones
have been
described
elsewhere
(Ceulemans,
1990).
All
plants
at
both
sites
were
grown
from
homogeneous,
hardwood
cuttings
obtained
from
the
Belgian
Government
Poplar
Research
Station
(Geraardsbergen,
Belgium).
Plantation
design
Cuttings
of
the
five
clones
were
planted
in
April
I
1987
in
clonal
blocks
of
a 0.8
m
x
0.8
m
pattern
(ie,
a
density
of
15
625
trees
per
ha)
in
Afsnee
(near
Gent,
Belgium;
51°03’
N,
03°39’E)
and
in
Orsay
(near
Paris,
France;
48°50’
N,
02°20’
E).
Each
homogeneous
block
(9 x
9 trees
in
Afsnee
and
5 x
5 trees
in
Orsay)
was
surrounded
by
an
unplanted
row
of
1.6
m
width,
and
only
a weak
border
effect
on
height
and
volume
growth
was
observed
(Van
Hecke
et
al,
1995).
A
drip
irriga-
tion
system
was
installed
and
irrigation
was
applied
during
the
entire
duration
of
the
experi-
ment.
Mechanical
weed
control
was
only
neces-
sary
during
the
establishment
year;
in
Afsnee
also
some
herbicides
were
applied.
In
Afsnee,
5
tonnes
of
manure
were
applied
during
the
first
year
(1987)
and
two
additional
(total)
fertilizer
applications
were
given
in
May
and
July
1988.
In
Orsay,
100
kg·ha
of total
fertilizer
(N,
P,
K)
were
applied
twice
every
year,
in
April
and
July.
In
Afsnee,
an
additional
27
cuttings
per
clone
were
planted
at
the
same
density
next
to
the
experimental
plots
to
allow
destructive
sampling
after
the
first
growing
season.
The
experimen-
tal
plots
were
only
harvested
after
the
third
year.
In
contrast,
a
coppice
system
was
applied
in
Orsay:
at
the
end
of
the
first
growing
season
(1987),
all
stems
were
harvested
for
measure-
ments
of biomass
production
(stem
+
branches).
In
early
1988,
cut
stumps
resprouted
(yielding
between
three
and
eight
stems
per
stump)
and
grew
for 2 more
consecutive
years
until
harvest
at
the
end
of
1989.
Measurements
Destructive
measurements
were
performed
at
both
sites
after
the
first
year
(winter
1987-1988).
Ten
center
trees
were
harvested
in
Afsnee
com-
pared
with
all
25
in
Orsay.
At
the
end
of
the
fol-
lowing
year
(1988)
five
trees
per
clone
were
har-
vested
in
Afsnee.
Finally,
after
the
third
year,
all
trees
were
harvested
at
both
sites
(coppiced
in
Orsay
and
final
harvest
in
Afsnee).
Stem
dry
mass
(DM)
was
determined
after
drying
at
80
°C
until
constant
mass
(branches
are
not
con-
sidered
in
the
present
study).
At
the
end
of
the
first
growing
season,
stem
diameter
(D)
was
measured
at
22
cm
above
ground
in
two
perpendicular
directions
with
a
dial
caliper
(at
0.1
mm
resolution).
In
Orsay,
D
was
also
measured
at
10
cm
and
at
mid-height,
and
at
20-cm
intervals
on
a
subsample
of
four
trees
to
examine
taper.
Total
plant
height
(H)
was
measured
to
the
nearest
0.5
cm
with
an
alu-
minium
levelling
rod.
At
the
end
of the
second
year
(in
Afsnee
only),
stem
diameters
were
measured
(in
two
direc-
tions)
at
0.5
m
intervals
on
all
harvested
plants
(five
per
clone).
For
each
individual
0.5
m
stem
segment,
the
volume
was
calculated
using
the
formula
for
a
truncated
cone
(see
later).
Stem
real
volume
(V)
per
plant
was
then
obtained
by
summing
volumes
of
all
individual
stem
seg-
ments
(Causton,
1985;
Kozak,
1988).
At
the
end
of
the
third
year
(in
Orsay
only),
all
these
measurements
were
performed
on
all
trees.
In
addition,
wood
infradensity
(ie,
DM/V
ratio)
was
determined
from
real
stem
volume
data
using
the
water
displacement
technique.
Stem
volume
index
was
calculated
as
H·D
2,
with
H
=
stem
height
and
D
=
stem
diameter
at
22
cm
aboveground,
unless
indicated
otherwise.
A
general
model
was
tested,
where
DM
is
dry
mass
and
VI
is
volume
index
together
with
two
reduced
forms,
a
linear
model
(γ=1)
and
a
power
model
(α
=
0).
The
regression
parameters
were
estimated
by
using
an
iterative
method
(SigmaPlot
software).
The
two
reduced
forms
were
compared
to
the
general
model
by
using
F-tests.
To
test
statistical
differences
among
clones,
F-tests
have
also
been
used.
RESULTS
AND
DISCUSSION
Basic
considerations
As
a
first
approximation,
a
stem
can
be
con-
sidered
as
a
geometrical
cone,
while
H·D
2
is
a
larger
rectangular
parallelepiped:
where
0.2618
is
a
constant
factor
and
V
and
H·D
2
are
expressed
in
dm
3.
More
precisely,
the
stem
shape
is
closer
to
a
truncated
cone
with
volume:
where
D
is
the
diameter
at
the
base,
and
d
is
the
diameter
at
the
top
of
the
truncated
cone.
Assuming
a
constant
top
stem
diameter
(d)
of
about
5
mm,
the
volume
of
the
trun-
cated
cone
exceeds
that
of
a
cone
of
similar
height
and
base,
the
difference
between
the
two
being
smaller
when
tree
size
increases.
In
our
young
plots,
for
that
very
reason,
small
stems
exhibit
a
rather
cylindrical
shape
while
bigger
ones
are
more
conical.
This
makes
the
regression
coefficient
larger
for
small
stems
than
for
large
ones.
In
these
conditions,
dry
mass
versus
volume
index
curves
exhibit
a
gentle
curvature,
this
fact
being
in
favour
of
a
non-linear
model.
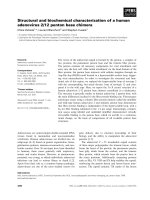
The
stem
volume
estimation
is
very
dependent
on
the
choice
of
the
height
at
which
stem
basal
diameter
is
measured.
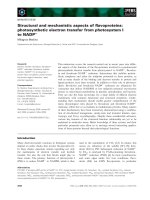
Fig-
ure
1 shows
that
the
stem
diameter
largely
increases
when
approaching
the
ground
level.
It
is
of
course
necessary
to
take
these
low
plant
parts
into
account
when
estimating
the
stem
volume.
However,
putting
the
stem
diameter
measurement
too
low
will result
in
a
significant
overestimation.
As
can
be
seen
from
figure
1,
the
stem
diameter
mea-
surement
at
22
cm,
which
was
arbitrarily
chosen
for
convenience
in
this
study
(see
Ceulemans
et
al,
1993),
seems
to
be
a
good
compromise
for
assessing
the
volume
of
these
young
poplar
stands.
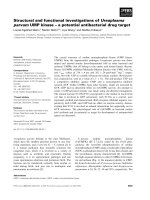
Volume
index
versus
real
volume
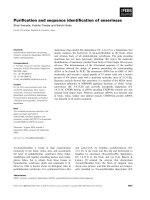
It
follows
from
the
previous
considerations
on
stem
shape
that
there
is
an
important
dif-
ference
between
the
real
volume
and
the
volume
index.
This
is
obvious
from
the
dif-
ference
between
the
1/1
line
(dotted
line)
and
the
relationship
obtained
for
1-
and
2-
year-old
stems
shown
in
figure
2
(clone
Ras-
palje).
The
relationship
between
real
stem
volume
and
stem
volume
index
is
linear
and
highly
significant
(r
2
=
0.992),
but
the
exper-
imentally
observed
regression
coefficient
(0.2893)
differs
slightly
from
the
theoreti-
cally
calculated
one
(0.2618).
Other
clones
(not
shown)
show
a
similar
trend.
However,
the
positioning
of
the
data
points
suggests
that
there
is
a
slight
deviation
from
linearity
towards
high
values,
which
is
due
to
the
shift
from
a
cylindrical
shape
to
a
rather
conical
one
when
stem
size
increases.
Wood
infradensity
In
a
direct
stem
volume
index
to
dry
mass
conversion,
the
wood
infradensity
(stem
dry
mass
versus
fresh
volume)
is
implicitly
taken
into
account
as
a
constant
factor.
However,
important
variations
among
clones
and
within
trees
of
the
same
clone
have
been
shown
(Schalck
et
al,
1978).
After
the
first
growing
season
(1987)
stem
wood
infradensity
ranged
from
0.441
kg
dm-3
for
clone
Beaupré
to
0.482
kg
dm-3
for
clone
Raspalje.
Except
for
the
differences
between
these
two
clones,
clonal
differences
in
density
of
the
first
year
stem
wood
were
not
significant
(P =
0.05).
After
the
second
growing
season,
no
sig-
nificant
difference
in
stem
wood
density
was
observed
among
the
five
clones,
nor
between
the
two
sites
(table
I).
However,
wood
density
did
significantly
differ
between
different
height
growth
increments
(HGI)
on
trees
of
the
same
age.
According
to
Bormann
(1990),
the
relative
proportion
of
sapwood
and
heartwood
has
to
be
con-
sidered
in
models
predicting
biomass
(see
also
Snell
and
Brown,
1978).
In
the
present
study,
all
young
stems
are
sapwood
only
but
differences
are
observed
between
the
1-
and
2-year-old
density
values
(table
I).
Attention
must
be
paid
to
this
when
extrap-
olating
allometric
relationships
as
soon
as
the
age
of
the
stems
differs.
Volume
index
versus
dry
mass
The
estimation
of stem
dry
mass
by
means
of
volume
index
data
integrates
incertain-
ties
due
to
both
real
volume
estimation
and
assumptions
on
wood
density.
Stem
volume
index
estimations
based
on
diameter
mea-
surements
at
10
cm
aboveground,
at
22
cm
aboveground
and
at
mid-height
were
com-
pared
for the
five
clones
in
Orsay
( 1987).
Except
for
one
clone
(Robusta),
the
best
fit
between
volume
index
and
dry
mass
was
obtained
with
stem
diameter
measured
at
22
cm
(table
II).
This
might
be
explained
by
the
fact
that
stem
diameter
at
10
cm
aboveground
is
strongly
influenced
by
the
basal
swelling
(see
fig
1),
which
varies
from
one
stem
to
another.
Measurements
at
mid-
plant
height
are
less
accurate
since
the
diam-
eter
is
much
smaller,
thus
causing
a
rela-
tively
larger
measuring
error.
In
addition,
little
information
is
given
on
the
lower
por-
tion
of
the
stem
where
most
of
the
biomass
is
concentrated.
Therefore,
all
estimations
used
further
in
this
text
are
based
on
stem
diameters
measured
at
22
cm
aboveground.
In
other
respects,
all
stem
diameters
were
measured
in
two
perpendicular
directions
(d1
and
d2)
since
a
stem
cross-section
is
not
always
perfectly
circular.
Then,
volume
index
calculation
is
more
accurate
when
using
the
product
d1·d2
rather
than
[(d1
+
d2)
/
2]
2
(ellipse
versus
circle),
but
the
difference
is
often
negligible
in
practice:
when
comparing
these
two
approaches
on
a
sample
of
73
2-year-old
stems
of
all
clones,
only
two
stems
showed
a
discrep-
ancy
superior
to
1%
on
volume
index
esti-
mates.
One-year-old
stems
(1987)
Very
significant
correlations
(P
=
0.001)
were
observed
between
stem
volume
index
and
stem
dry
mass
for
all
five
clones
at
both
sites.
As
an
example,
this
relation
is
shown
for
clone
Columbia
River
in
figure
3.
Table
III
shows
the
global,
linear
and
power
regression
equations
with
their
respective
determination
coefficients.
In
all
cases,
the
general
model
gives
the
best
fit,
but
the
power
model shows
quasi-similar
perfor-
mance.
However,
F-tests
performed
between
the
global
model
and
the
two
reduced
forms
were
not
significant
(P
>
0.05).
It
can
be
noted
that,
in
the
linear
model,
the
order
of
magnitude
of
the
intercept
is
8
to
46
g.
This
results
in
a
poor
estimation
of
the
mass
of
small
stems.
The
global
model
shows
quite
moderate
intercepts
(-27
to
22
g)
except
clone
Raspalje
in
Afsnee.
The
reduced
num-
ber
and
range
of
the
data
from
Afsnee
causes
a
large
variation
in
the
regression
coeffi-
cients
of
the
global
model,
leading
to
unre-
alistic
functions,
valid
over
a
narrow
size
range
only.
The
fact
that
a
power
function
has
to
pass
through
the
origin
largely
reduces
this
variability
and
probably
insures
a
better
accuracy
of
the
power
model
in
the
estima-
tion
of
the
biomass
of
small
stems.
This
is
relatively
important
in
coppices
where
small
stems
are
numerous
and
represent
a
non-
negligible
part
of
the
total
biomass.
In
spite
of
the
fact
that
in
1987
all
clones
were
managed
in
the
same
way
at
both
sites,
differences
in
their
regression
coefficients
were
observed.
It
is
therefore
important
to
pay
attention
to
this
between-clone
vari-
ability
when
extrapolating
general
allomet-
ric
relations.
Differences
in
regression
coef-
ficients
between
the
two
sites
were
rather
small.
Two-year-old
stems
Data
from
Afsnee
(1988)
are
compared
to
those
of Orsay
(1989)
as
the
stand
in
Orsay
was
coppiced
during
the
winter
1987-1988
(both
plots
being
2-year-old
aboveground).
Since
there
was
little
difference
between
the
allometric
relationships
from
Afsnee
and
Orsay
in
the
first
year,
we
established
the
relationship
between
volume
index
and
stem
dry
mass
on
the
combined
data
of
Afsnee
(1988)
and
Orsay
(1989).
For
all
clones,
the
data
points
from
Afsnee
fell
right
within
the
range
of
those
of
Orsay
(see
fig
4,
example
clone
Fritzi
Pauley).
Although
all
regres-
sion
equations
yielded
highly
significant
correlations
(P
=
0.001),
the
best
fit
was
obtained
using
either
global
or
power
mod-
els
(table
IV).
F-tests
on
the
sums
of
squares
of
residu-
als
were
used
for
model
comparison
(table
V).
When
comparing
the
best
fit
global
model
to
the
linear
model,
it
appeared
that
they
differed
significantly
for
two
of
five
clones.
When
the
power
model
was
compared
to
the
global
one,
no
difference
was
observed.
Therefore,
we
can
first
reject
the
linear
model.
This
was
confirmed
by
observing
the
residuals
(an
example
is
shown
fig
5
for
clone
Fritzi-Pauley):
their
distribution,
biased
in
the
linear
model,
was
more
satisfactory
in
the
two
other
models.
A
choice
must
still
be
made
between
the
two
other
models
(global
and
power)
that
do
not
significantly
differ.
Our
preference
goes
to
the
power
function since
it
has
fewer
parameters,
but
also
because
it
passes
through
the
origin.
This
implicitly
supplies
additional
information
that
should
be
taken
into
account,
especially
when
the
sample
has
a
narrow
range.
Among-clone
variation
in
regression
coefficients
was
lower
for
the
2-year-old
stems
than
for
the
1-year-old
stems,
which
might
be
explained
by
the
much
larger
sam-
ple
size
and
by
their
wider
range.
In
Orsay,
the
coppice
regime
resulted
in
a
wide
vari-
ation
of
stem
sizes,
as
can
be
seen
in
fig-
ure
4.
To
test
the
significance
of
the
differ-
ences
observed
between
clones,
we
computed
a
power
regression
on
the
data
of
all
clones
pooled
together.
We
tested
the
fit
of
each
clone
separately
to
this
general
equa-
tion
and
compared
this
fit
with
the
previ-
ously
calculated
fit
to
the
equation
from
each
respective
clone,
using
F-tests.
Three
clones
appeared
distinct
from
the
common
pool:
Columbia
River,
Fritzi
Pauley
and
Raspalje.
In
conclusion,
in
the
framework
of
the
present
study,
the
power
model
gave
better
estimates
of
the
biomass
of
the
stems
than
the
linear
model.
The
linear
model
overes-
timated
biomass
on
both
ends
of
the
regres-
sion
line
(ie,
small
and
large
stems)
and
underestimated
the
biomass
of all
stems
of
average
size.
It
appears
well
adapted
at
plot
level
when
considering
a
wide
tree-size
range
only.
Allometric
relationships
may
vary
according
to
tree
size
and
species.
A
variable
allometric
ratio
model
fitted
to
Populus
tremuloides
biomass
data
for
bolewood,
bolebark
and
current
twig
stem
components
found
to
be
superior
to
a
power
function
or
to
a
constant
allometric
ratio
model
(Ruark et al,
1987).
Observations
made
on
rather
small
plots
must
be
interpreted
with
caution
because
they
may
not
always
be
extrapolated
to
larger
acreages.
For
example,
small
plots
may
allow
more
side
light
penetration
than
would
normally
be
expected.
This
may
result
in
greater
leaf
retention,
although
this
did
not
appear
to
be
the
case
in
our
plots
as
most
of
the
leaf
area
was
in
the
uppermost
portion
of
the
crown
where
light
was
read-
ily
available
(Ceulemans
et
al,
1993).
ACKNOWLEDGEMENTS
This
research
was
financially
supported
by
EC
research
contract
EN3B-0114-B/GDF
within
the
Biomass
R
&
TD
programme
(second
frame-
work
programme
1987-1989).
The
scientific
exchange
programme
between
the
French
CNRS
and
the
Flemish
Community
(Themes
92.4,
92.7
and
93.1)
greatly
facilitated
the
fruitful
collabo-
ration
between
our
two
laboratories.
Thanks
to
the
reviewers
who
contributed
to
improve
the
treatment
of
our
data.
We
acknowledge
B
Legay,
F
Kockelbergh
and
TS
Barigah
for
help
with
col-
lecting
the
data,
I
Impens,
M
Mousseau,
B
Saugier,
I
Planchais
and
P
Van
Hecke
for
help-
ful
discussions.
REFERENCES
Barigah
TS,
Saugier
B,
Mousseau
M,
Guittet
J,
Ceule-
mans
R
(1994)
Photosynthesis,
leaf
area
and
pro-
ductivity
of
five
poplar
clones
during
their
estab-
lishment
year.
Ann
Sci
For
51,
613-625
Bormann
BT
(1990)
Diameter-based
biomass
regres-
sion
models
ignore
large
sapwood-related
varia-
tion
in
Sitka
spruce.
Can
J
For
Res
20,
1098-1104
Causton
DR
(1985)
Biometrical,
structural
and
physi-
ological
relationships
among
tree
parts.
In:
Attributes
of
Trees
as
Crop
Plants
(MGR
Cannell,
JE
Jackson,
eds),
Titus
Wilson
&
Son,
Hunting-
son,
UK,
137-159
Ceulemans
R
(1990)
Genetic
Variation
in
Functional
and
Structural
Productivity
Determinants
in
Poplar.
Thesis
Publishers,
Amsterdam,
the
Netherlands,
100
p
Ceulemans
R,
Pontailler
JY,
Mau
F,
Guittet
J
(1993).
Leaf
allometry
in
young
poplar
stands:
reliability
of
leaf
area
index
estimation,
site
and
clone
effects.
Biomass
Bioenergy
4, 315-321
Heilman
PE,
Stettler
RF
(1985)
Genetic
variation
and
productivity
of
Populus
trichocarpa
T
&
G.
and
its
hybrids.
II.
Biomass
production
in
a
4-year
plan-
tation.
Can
J
For
Res
15,
384-388
Kozak
A
(1988)
A
variable-exponent
taper
equation.
Can
J
For
Res
18,
1363-1368
Madgwick
HAI
( 1971 )
The
accuracy
and
precision
of
estimates
of the
dry
matter
in
stems,
branches,
and
foliage
in
an
old-field
Pinus
virginiana
stand.
In:
Forest
Biomass
Studies,
Univ
Main
Press,
Orono,
ME,
USA,
105-112
Madgwick
HAI
(1983)
Above-ground
weight
of forest
plots —
comparison
of
seven
methods
of
estima-
tion.
NZ
J For
Sci
13,
100-107
Mau
F,
Impens
I (1989)
Comparative
growth
analy-
sis
of
five
first
year
establishment
poplar
clones
(Populus
sp)
grown
under
a
short-rotation
inten-
sive
culture
system.
Ann
Sci
For 46,
250s-255s
Ranney
JW,
Wright
LL,
Mitchell
CP
(1991)
Carbon
storage
and
recycling
in
short-rotetion
energy
crops.
In:
Bioenergy
and
the
Greenhouse
Effect
(CP
Mitchell,
ed),
Nutek,
Stockholm,
39-44
Reed
DD,
Jones
EA
(1989)
Assessing
multiple
esti-
mates
of
plantation
productivity.
Can
J
For
Res
19, 948-954
Ruark
GA,
Martin
GL,
Bockheim
JG
(1987)
Compar-
ison
of constant
and
variable
allometric
ratios
for
estimating
Populus
tremuloides
biomass.
For Sci
33, 294-300
Schalck
J,
Lejeune
J,
Stevens
M
(1978)
Density
and
Lignification
of
Woody
Tissue from
New
Hybrids
in
a
Poplar
Ecosystem.
FKFO
report
no
6,
Univer-
sity
of Gent,
Belgium,
38
p
Snell
JAK,
Brown
JK
(1978)
Comparison
of
tree
biomass
estimators -
DBH
and
sapwood
area.
For
Sci
24, 455-457
Van
Hecke
P,
Moermans
R,
Mau
F,
Guittet
J
(1995)
Border
effects
and
size
inequality
in
experimental
even-aged
stands
of
poplar
clones
(Populus).
Ann
Sci For 52,
193-200
Verwijst
T
(1991)
Logarithmic
transformations
in
biomass
estimation
procedures:
violation
of
the
lin-
earity
assumption
in
regression
analysis.
Biomass
Bioenergy
1,
175-180