Data Warehousing Fundamentals A Comprehensive Guide for IT Professionals phần 7 ppt
Bạn đang xem bản rút gọn của tài liệu. Xem và tải ngay bản đầy đủ của tài liệu tại đây (695.33 KB, 53 trang )
System conversions. Trace the evolution of order processing in any company. The
company must have started with a file-oriented order entry system in the early
1970s; orders were entered into flat files or indexed files. There was not much stock
verification or customer credit verification during the entry of the order. Reports
and hard-copy printouts were used to continue with the process of executing the or-
ders. Then this system must have been converted into an online order entry system
with VSAM files and IBM’s CICS as the online processing monitor. The next con-
version must have been to a hierarchical database system. Perhaps that is where
your order processing system still remains—as a legacy application. Many compa-
nies have moved the system forward to a relational database application. In any
case, what has happened to the order data through all these conversions? System
conversions and migrations are prominent reasons for data pollution. Try to under-
stand the conversions gone through by each of your source systems.
Data aging. We have already dealt with data aging when we reviewed how over the
course of many years the values in the product code fields could have decayed. The
older values lose their meaning and significance. If many of your source systems
are old legacy systems, pay special attention to the possibility of aged data in those
systems.
Heterogeneous system integration. The more heterogeneous and disparate your
source systems are, the stronger is the possibility of corrupted data. In such a sce-
nario, data inconsistency is a common problem. Consider the sources for each of
your dimension tables and the fact table. If the sources for one table are several het-
erogeneous systems, be cautious about the quality of data coming into the data
warehouse from these systems.
Poor database design. Good database design based on sound principles reduces the
introduction of errors. DBMSs provide for field editing. RDBMSs enable verifica-
tion of the conformance to business rules through triggers and stored procedures.
Adhering to entity integrity and referential integrity rules prevents some kinds of
data pollution.
Incomplete information at data entry. At the time of the initial data entry about an
entity, if all the information is not available, two types of data pollution usually oc-
cur. First, some of the input fields are not completed at the time of initial data entry.
The result is missing values. Second, if the unavailable data is mandatory at the time
of the initial data entry, then the person entering the data tries to force generic val-
ues into the mandatory fields. Entering N/A for not available in the field for city is
an example of this kind of data pollution. Similarly, entry of all nines in the Social
Security number field is data pollution.
Input errors. In olden days when data entry clerks entered data into computer sys-
tems, there was a second step of data verification. After the data entry clerk finished
a batch, the entries from the batch were independently verified by another person.
Now, users who are also responsible for the business processes enter the data. Data
entry is not their primary vocation. Data accuracy is supposed to be ensured by
sight verification and data edits planted on the input screens. Erroneous entry of
data is a major source of data corruption.
Internationalization/localization. Because of changing business conditions, the
structure of the business gets expanded into the international arena. The company
moves into wider geographic areas and newer cultures. As a company is internation-
300
DATA QUALITY: A KEY TO SUCCESS
alized, what happens to the data in the source systems? The existing data elements
must adapt to newer and different values. Similarly, when a company wants to con-
centrate on a smaller area and localize its operations, some of the values for the data
elements get discarded. This change in the company structure and the resulting revi-
sions in the source systems are sources of data pollution.
Fraud. Do not be surprised to learn that deliberate attempts to enter incorrect data are
not uncommon. Here, the incorrect data entries are actually falsifications to commit
fraud. Look out for monetary fields and fields containing units of products. Make
sure that the source systems are fortified with tight edits for such fields.
Lack of policies. In any enterprise, data quality does not just materialize by itself. Pre-
vention of entry of corrupt data and preservation of data quality in the source sys-
tems are deliberate activities. An enterprise without explicit policies on data quality
cannot be expected to have adequate levels of data quality.
Validation of Names and Addresses
Almost every company suffers from the problem of duplication of names and addresses.
For a single person, multiple records can exist among the various source systems. Even
within a single source system, multiple records can exist for one person. But in the data
warehouse, you need to consolidate all the activities of each person from the various du-
plicate records that exist for that person in the multiple source systems. This type of prob-
lem occurs whenever you deal with people, whether they are customers, employees,
physicians, or suppliers.
Take the specific example of an auction company. Consider the different types of cus-
tomers and the different purposes for which the customers seek the services of the auction
company. Customers bring property items for sale, buy at auctions, subscribe to the cata-
logs for the various categories of auctions, and bring articles to be appraised by experts
for insurance purposes and for estate dissolution. It is likely that there are different legacy
systems at an auction house to service the customers in these different areas. One cus-
tomer may come for all of these services and a record gets created for the customer in
each of the different systems. A customer usually comes for the same service many times.
On some of these occasions, it is likely that duplicate records are created for the same cus-
tomer in one system. Entry of customer data happens at different points of contact of the
customer with the auction company. If it is an international auction company, entry of cus-
tomer data happens at many auction sites worldwide. Can you imagine the possibility for
duplication of customer records and the extent of this form of data corruption?
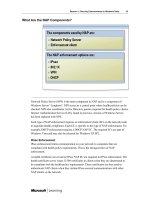
Name and address data is captured in two ways (see Figure 13-3). If the data entry is in
the multiple field format, then it is easier to check for duplicates at the time of data entry.
Here are a few inherent problems with entering names and addresses:
ț No unique key
ț Many names on one line
ț One name on two lines
ț Name and the address in a single line
ț Personal and company names mixed
ț Different addresses for the same person
ț Different names and spellings for the same customer
DATA QUALITY CHALLENGES
301
Before attempting to deduplicate the customer records, you need to go through a pre-
liminary step. First, you have to recast the name and address data into the multiple field
format. This is not easy, considering the numerous variations in the way name and address
are entered in free-form textual format. After this first step, you have to devise matching
algorithms to match the customer records and find the duplicates. Fortunately, many good
tools are available to assist you in the deduplication process.
Costs of Poor Data Quality
Cleansing the data and improving the quality of data takes money and effort. Although
data cleansing is extremely important, you could justify the expenditure of money and ef-
fort by counting the costs of not having or using quality data. You can produce estimates
with the help of the users. They are the ones who can really do estimates because the esti-
mates are based on forecasts of lost opportunities and possible bad decisions.
The following is a list of categories for which cost estimates can be made. These are
broad categories. You will have to get into the details for estimating the risks and costs for
each category.
ț Bad decisions based on routine analysis
ț Lost business opportunities because of unavailable or “dirty” data
ț Strain and overhead on source systems because of corrupt data causing reruns
ț Fines from governmental agencies for noncompliance or violation of regulations
ț Resolution of audit problems
302
DATA QUALITY: A KEY TO SUCCESS
Name & Address: Dr. Jay A. Harreld, P.O. Box 999,
100 Main Street,
Anytown, NX 12345, U.S.A.
Title: Dr.
First Name: Jay
Middle Initial: A.
Last Name: Harreld
Street Address-1: P.O. Box 999
Street Address-2: 100 Main Street
City: Anytown
State: NX
Zip: 12345
Country Code: U.S.A.
SINGLE FIELD FORMAT
MULTIPLE FIELD FORMAT
Figure 13-3 Data entry: name and address formats.
ț Redundant data unnecessarily using up resources
ț Inconsistent reports
ț Time and effort for correcting data every time data corruption is discovered
DATA QUALITY TOOLS
Based on our discussions in this chapter so far, you are at a point where you are convinced
about the seriousness of data quality in the data warehouse. Companies have begun to rec-
ognize dirty data as one of the most challenging problems in a data warehouse.
You would, therefore, imagine that companies must be investing heavily in data clean-
up operations. But according to experts, data cleansing is still not a very high priority for
companies. This attitude is changing as useful data quality tools arrive on the market. You
may choose to apply these tools to the source systems, in the staging area before the load
images are created, or to the load images themselves.
Categories of Data Cleansing Tools
Generally, data cleansing tools assist the project team in two ways. Data error discovery
tools work on the source data to identify inaccuracies and inconsistencies. Data correction
tools help fix the corrupt data. These correction tools use a series of algorithms to parse,
transform, match, consolidate, and correct the data.
Although data error discovery and data correction are two distinct parts of the data
cleansing process, most of the tools on the market do a bit of both. The tools have features
and functions that identify and discover errors. The same tools can also perform the clean-
ing up and correction of polluted data. In the following sections, we will examine the fea-
tures of the two aspects of data cleansing as found in the available tools.
Error Discovery Features
Please study the following list of error discovery functions that data cleansing tools are
capable of performing.
ț Quickly and easily identify duplicate records
ț Identify data items whose values are outside the range of legal domain values
ț Find inconsistent data
ț Check for range of allowable values
ț Detect inconsistencies among data items from different sources
ț Allow users to identify and quantify data quality problems
ț Monitor trends in data quality over time
ț Report to users on the quality of data used for analysis
ț Reconcile problems of RDBMS referential integrity
Data Correction Features
The following list describes the typical error correction functions that data cleansing tools
are capable of performing.
DATA QUALITY TOOLS
303
ț Normalize inconsistent data
ț Improve merging of data from dissimilar data sources
ț Group and relate customer records belonging to the same household
ț Provide measurements of data quality
ț Validate for allowable values
The DBMS for Quality Control
The database management system itself is used as a tool for data qualtiy control in many
ways. Relational database management systems have many features beyond the database
engine (see list below). Later versions of RDBMS can easily prevent several types of er-
rors creeping into the data warehouse.
Domain integrity. Provide domain value edits. Prevent entry of data if the entered data
value is outside the defined limits of value. You can define the edit checks while set-
ting up the data dictionary entries.
Update security. Prevent unauthorized updates to the databases. This feature will stop
unauthorized users from updating data in an incorrect way. Casual and untrained
users can introduce inaccurate or incorrect data if they are given authorization to
update.
Entity integrity checking. Ensure that duplicate records with the same primary key
values are not entered. Also prevent duplicates based on values of other attributes.
Minimize missing values. Ensure that nulls are not allowed in mandatory fields.
Referential integrity checking. Ensure that relationships based on foreign keys are
preserved. Prevent deletion of related parent rows.
Conformance to business rules. Use trigger programs and stored procedures to en-
force business rules. These are special scripts compiled and stored in the database
itself. Trigger programs are automatically fired when the designated data items are
about to be updated or deleted. Stored procedures may be coded to ensure that the
entered data conforms to specific business rules. Stored procedures may be called
from application programs.
DATA QUALITY INITIATIVE
In spite of the enormous importance of data quality, it seems as though many companies
still ask the question whether to pay special attention to it and cleanse the data or not. In
many instances, the data for the missing values of attributes cannot be recreated. In quite a
number of cases, the data values are so convoluted that the data cannot really be cleansed.
A few other questions arise. Should the data be cleansed? If so, how much of it can really
be cleansed? Which parts of the data deserve higher priority for applying data cleansing
techniques? The indifference and the resistance to data cleansing emerge from a few valid
factors:
ț Data cleansing is tedious and time-consuming. The cleansing activity demands a
combination of the usage of vendor tools, writing of in-house code, and arduous
304
DATA QUALITY: A KEY TO SUCCESS
manual tasks of verification and examination. Many companies are unable to sus-
tain the effort. This is not the kind of work many IT professionals enjoy.
ț The metadata on many source systems may be missing or nonexistent. It will be dif-
ficult or even impossible to probe into dirty data without the documentation.
ț The users who are asked to ensure data quality have many other business responsi-
bilities. Data quality probably receives the least attention.
ț Sometimes, the data cleansing activity appears to be so gigantic and overwhelming
that companies are terrified of launching a data cleansing initiative.
Once your enterprise decides to institute a data cleansing initiative, you may consider
one of two approaches. You may opt to let only clean data into your data warehouse. This
means only data with a 100% quality can be loaded into the data warehouse. Data that is
in any way polluted must be cleansed before it can be loaded. This is an ideal approach,
but it takes a while to detect incorrect data and even longer to fix it. This approach is ide-
al from the point of view of data quality, but it will take a very long time before all data is
cleaned up for data loading.
The second approach is a “clean as you go” method. In this method, you load all the
data “as is” into the data warehouse and perform data cleansing operations in the data
warehouse at a later time. Although you do not withhold data loads, the results of any
query are suspect until the data gets cleansed. Questionable data quality at any time leads
to losing user confidence that is extremely important for data warehouse success.
Data Cleansing Decisions
Before embarking on a data cleansing initiative, the project team, including the users,
have to make a number of basic decisions. Data cleansing is not as simple as deciding to
cleanse all data and to cleanse it now. Realize that absolute data quality is unrealistic in
the real world. Be practical and realistic. Go for the fitness-for-purpose principle. Deter-
mine what the data is being used for and find the purpose. If the data from the warehouse
has to provide exact sales dollars of the top twenty-five customers, then the quality of this
data must be very high. If customer demographics are to be used to select prospects for
the next marketing campaign, the quality of this data may be at a lower level.
In the final analysis, when it comes to data cleansing, you are faced with a few funda-
mental questions. You have to make some basic decisions. In the following subsections,
we present the basic questions that need to be asked and the basic decisions that need to
be made.
Which Data to Cleanse. This is the root decision. First of all, you and your users
must jointly work out the answer to this question. It must primarily be the users’ deci-
sion. IT will help the users make the decision. Decide on the types of questions the data
warehouse is expected to answer. Find the source data needed for getting answers.
Weigh the benefits of cleansing each piece of data. Determine how cleansing will help
and how leaving the dirty data in will affect any analysis made by the users in the data
warehouse.
The cost of cleaning up all data in the data warehouse is enormous. Users usually un-
derstand this. They do not expect to see 100% data quality and will usually settle for ig-
noring the cleansing of unimportant data as long as all the important data is cleaned up.
DATA QUALITY INITIATIVE
305
But be sure of getting the definitions of what is important or unimportant from the users
themselves.
Where to Cleanse. Data for your warehouse originates in the source operational sys-
tems, so does the data corruption. Then the extracted data moves into the staging area.
From the staging area load images are loaded into the data warehouse. Therefore, theoret-
ically, you may cleanse the data in any one of these areas. You may apply data cleansing
techniques in the source systems, in the staging area, or perhaps even in the data ware-
house. You may also adopt a method that splits the overall data cleansing effort into parts
that can be applied in two of the areas, or even in all three areas.
You will find that cleansing the data after it has arrived in the data warehouse reposito-
ry is impractical and results in undoing the effects of many of the processes for moving
and loading the data. Typically, data is cleansed before it is stored in the data warehouse.
So that leaves you with two areas where you can cleanse the data.
Cleansing the data in the staging area is comparatively easy. You have already resolved
all the data extraction problems. By the time data is received in the staging area, you are
fully aware of the structure, content, and nature of the data. Although this seems to be the
best approach, there are a few drawbacks. Data pollution will keep flowing into the stag-
ing area from the source systems. The source systems will continue to suffer from the
consequences of the data corruption. The costs of bad data in the source systems do not
get reduced. Any reports produced from the same data from the source systems and from
the data warehouse may not match and will cause confusion.
On the other hand, if you attempt to cleanse the data in the source systems, you are tak-
ing on a complex, expensive, and difficult task. Many legacy source systems do not have
proper documentation. Some may not even have the source code for the production pro-
grams available for applying the corrections.
How to Cleanse. Here the question is about the usage of vendor tools. Do you use
vendor tools by themselves for all of the data cleansing effort? If not, how much of in-
house programming is needed for your environment? Many tools are available in the mar-
ket for several types of data cleansing functions.
If you decide to cleanse the data in the source systems, then you have to find the ap-
propriate tools that can be applied to source system files and formats. This may not be
easy if most of your source systems are fairly old. In that case, you have to fall back on in-
house programs.
How to Discover the Extent of Data Pollution. Before you can apply data cleans-
ing techniques, you have to assess the extent of data pollution. This is a joint responsibili-
ty shared among the users of operational systems, the potential users of the data ware-
house, and IT. IT staff, supporting both the source systems and the data warehouse, have a
special role in the discovery of the extent of data pollution. IT is responsible for installing
the data cleansing tools and training the users in using those tools. IT must augment the
effort with in-house programs.
In an earlier section, we discussed the sources of data pollution. Reexamine these
sources. Make a list that reflects the sources of pollution found in your environment, then
determine the extent of the data pollution with regard to each source of pollution. For ex-
ample, in your case, data aging could be a source of pollution. If so, make a list of all the
old legacy systems that serve as sources of data for your data warehouse. For the data at-
306
DATA QUALITY: A KEY TO SUCCESS
tributes that are extracted, examine the sets of values. Check if any of these values do not
make sense and have decayed. Similarly, perform detailed analysis for each type of data
pollution source.
Please look at Figure 13-4. In this figure, you find a few typical ways you can detect
the possible presence and extent of data pollution. Use the list as a guide for your environ-
ment.
Setting Up a Data Quality Framework. You have to contend with so many types
of data pollution. You need to make various decisions to embark on the cleansing of data.
You must dig into the sources of possible data corruption and determine the pollution.
Most companies serious about data quality pull all these factors together and establish a
data quality framework. Essentially, the framework provides a basis for launching data
quality initiatives. It embodies a systematic plan for action. The framework identifies the
players, their roles, and responsibilities. In short, the framework guides the data quality
improvement effort. Please refer to Figure 13-5. Notice the major functions carried out
within the framework.
Who Should be Responsible?
Data quality or data corruption originate in the source systems. Therefore, should not the
owners of the data in the source systems alone be responsible for data quality? If these
data owners are responsible for the data, should they also be bear the responsibility for
any data pollution that happens in the source systems? If data quality in the source sys-
DATA QUALITY INITIATIVE
307
q Operational systems converted
from older versions are prone to the
perpetuation of errors.
q Operational systems brought in
house from outsourcing companies
converted from their proprietary
software may have missing data.
q Data from outside sources that is
not verified and audited may have
potential problems.
q When applications are
consolidated because of corporate
mergers and acquisitions, these may
be error-prone because of time
pressures.
q When reports from old legacy
systems are no longer used, that
could be because of erroneous data
reported.
q If users do not trust certain reports
fully, there may be room for
suspicion because of bad data.
q Whenever certain data elements
or definitions are confusing to the
users, these may be suspect.
q If each department has its own
copies of standard data such as
Customer or Product, it is likely
corrupt data exists in these files.
q If reports containing the same
data reformatted differently do not
match, data quality is suspect.
q Wherever users perform too
much manual reconciliation, it may
because of poor data quality.
q If production programs
frequently fail on data exceptions,
large parts of the data in those
systems are likely to be corrupt.
q Wherever users are not able to
get consolidated reports, it is
possible that data is not integrated.
Figure 13-4 Discovering the extent of data pollution.
➨
➨
➨
➨
➨
➨
➨
➨
➨
➨
➨
➨
be because of poor data quality.
tems is high, the data quality in the data warehouse will also be high. But, as you well
know, in operational systems, there are no clear roles and responsibilities for maintaining
data quality. This is a serious problem. Owners of data in the operational systems are gen-
erally not directly involved in the data warehouse. They have little interest in keeping the
data clean in the data warehouse.
Form a steering committee to establish the data quality framework discussed in the pre-
vious section. All the key players must be part of the steering committee. You must have
representatives of the data owners of source systems, users of the data warehouse, and IT
personnel responsible for the source systems and the data warehouse. The steering com-
mittee is charged with assignment of roles and responsibilities. Allocation of resources is
also the steering committee’s responsibility. The steering committee also arranges data
quality audits.
Figure 13-6 shows the participants in the data quality initiatives. These persons repre-
sent the user departments and IT. The participants serve on the data quality team in specif-
ic roles. Listed below are the suggested responsibilities for the roles:
Data Consumer. Uses the data warehouse for queries, reports, and analysis. Establish-
es the acceptable levels of data quality.
Data Producer. Responsible for the quality of data input into the source systems.
Data Expert. Expert in the subject matter and the data itself of the source systems. Re-
sponsible for identifying pollution in the source systems.
Data Policy Administrator. Ultimately responsible for resolving data corruption as
data is transformed and moved into the data warehouse.
308
DATA QUALITY: A KEY TO SUCCESS
Identify the
business functions
affected most by
bad data.
Establish Data
Quality Steering
Committee.
Agree on a suitable
data quality
framework.
Institute data
quality
policy and
standards.
Define quality
measurement
parameters and
benchmarks.
Select high impact
data elements and
determine
priorities.
Plan and execute
data cleansing for
high impact data
elements.
Plan and execute
data cleansing for
other less severe
elements.
INITIAL
DATA
CLEANSING
EFFORTS
ONGOING
DATA
CLEANSING
EFFORTS
IT Professionals
User Representatives
Figure 13-5 Data quality framework.
Data Integrity Specialist. Responsible for ensuring that the data in the source systems
conforms to the business rules.
Data Correction Authority. Responsible for actually applying the data cleansing tech-
niques through the use of tools or in-house programs.
Data Consistency Expert. Responsible for ensuring that all data within the data ware-
house (various data marts) are fully synchronized.
The Purification Process
We all know that it is unrealistic to hold up the loading of the data warehouse unless the
quality of all data is at the 100% level. That level of data quality is extremely rare. If so,
how much of the data should you attempt to cleanse? When do you stop the purification
process?
Again, we come to the issues of who will use the data and for what purpose. Estimate
the costs and risks of each piece of incorrect data. Users usually settle for some extent of
errors, provided these errors result in no serious consequences. But the users need to be
kept informed of the extent of possible data corruption and exactly which parts of the data
could be suspect.
How then could you proceed with the purification process? With the complete partici-
pation of your users, divide the data elements into priorities for the purpose of data
cleansing. You may adopt a simple categorization by grouping the data elements into three
priority categories: high, medium, and low. Achieving 100% data quality is critical for the
high category. The medium-priority data requires as much cleansing as possible. Some er-
rors may be tolerated when you strike a balance between the cost of correction and poten-
tial effect of bad data. The low-priority data may be cleansed if you have any time and re-
DATA QUALITY INITIATIVE
309
DATA
QUALITY
INITIATIVES
DATA
CONSUMER
(User Dept.)
DATA
EXPERT
(User Dept.)
DATA
PRODUCER
(User Dept.)
DATA POLICY
ADMINISTRATOR
(IT Dept.)
DATA INTEGRITY
SPECIALIST
(IT Dept.)
DATA CORRECTION
AUTHORITY
(IT Dept.)
DATA CONSISTENCY
EXPERT
(IT Dept.)
Figure 13-6 Data quality: participants and roles.
sources still available. Begin your data cleansing efforts with the high-priority data. Then
move on to the medium-priority data.
A universal data corruption problem relates to duplicate records. As we have seen ear-
lier, for the same customer, there could be multiple records in the source systems. Activity
records are related to each of these duplicate records in the source systems. Make sure
your overall data purification process includes techniques for correcting the duplication
problem. The techniques must be able to identify the duplicate records and then relate all
the activities to this single customer. Duplication normally occurs in records relating to
persons such as customers, employees, and business partners.
So far, we have not discussed data quality with regard to data obtained from external
sources. Pollution can also be introduced into the data warehouse through errors in exter-
nal data. Surely, if you pay for the external data and do not capture it from the public do-
main, then you have every right to demand a warranty on data quality. In spite of what the
vendor might profess about the quality of the data, for each set of external data, set up
some kind of data quality audit. If the external data fails the audit, be prepared to reject
the corrupt data and demand a cleaner version.
Figure 13-7 illustrates the overall data purification process. Please observe the process
as shown in the figure and go through the following summary:
ț Establish the importance of data quality.
ț Form data quality steering committee.
ț Institute a data quality framework.
ț Assign roles and responsibilities.
ț Select tools to assist in the data purification process.
ț Prepare in-house programs as needed.
310
DATA QUALITY: A KEY TO SUCCESS
SOURCE
SYSTEMS
DATA
WAREHOUSE
DATA STAGING AREA
Cleansed
Data
Polluted
Data
DATA CLEANSING
FUNCTIONS
Vendor
Tools
In-house
Programs
DATA QUALITY
FRAMEWORK
IT Professionals / User Representatives
Figure 13-7 Overall data purification process.
ț Train the participants in data cleansing techniques.
ț Review and confirm data standards.
ț Prioritize data into high, medium, and low categories.
ț Prepare schedule for data purification beginning with the high priority data.
ț Ensure that techniques are available to correct duplicate records and to audit exter-
nal data.
ț Proceed with the purification process according to the defined schedule.
Practical Tips on Data Quality
Before you run away to implement a comprehensive data quality framework and expend
time and resources on data quality, let us pause to go over a few practical suggestions.
Remember, ensuring data quality is a balancing act. You already know that 100% data
quality is an unrealistic expectation. At the same time, overlooking errors that could po-
tentially ruin the business is also not an option. You have to find the right balance be-
tween the data purification effort and the available time and resources. Here are a few
practical tips:
ț Identify high-impact pollution sources and begin your purification process with
these.
ț Do not try to do everything with in-house programs.
ț Tools are good and are useful. Select proper tools.
ț Agree on standards and reconfirm these.
ț Link data quality with specific business objectives. By itself, data quality work is
not attractive.
ț Get the senior executive sponsor of your data warehouse project to be actively in-
volved in backing the data cleansing initiative.
ț Get users totally involved and keep them constantly informed of the developments.
ț Wherever needed, bring in outside experts for specific assignments.
CHAPTER SUMMARY
ț Data quality is critical because it boosts confidence, enables better customer ser-
vice, enhances strategic decision making, and reduces risks from disastrous deci-
sions.
ț Data quality dimensions include accuracy, domain integrity, consistency, complete-
ness, structural definiteness, clarity, and many more.
ț Data quality problems run the gamut of dummy values, missing values, cryptic val-
ues, contradicting values, business rule violations, inconsistent values, and so on.
ț Data pollution results from many sources in a data warehouse and this variety of
pollution sources intensifies the challenges faced when attempting to clean up the
data.
ț Poor data quality of names and addresses presents serious concerns to organiza-
tions. This area is one of the greatest challenges.
CHAPTER SUMMARY
311
ț Data cleansing tools contain useful error discovery and error correction features.
Learn about them and make use of the tools applicable to your environment.
ț The DBMS itself can be used for data cleansing.
ț Set up a sound data quality initiative in your organization. Within the framework,
make the data cleansing decisions.
REVIEW QUESTIONS
1. List five reasons why you think data quality is critical in a data warehouse.
2. Explain how data quality is much more than just data accuracy. Give an example.
3. Briefly list three benefits of quality data in a data warehouse.
4. Give examples of four types of data quality problems.
5. What is the problem related to the reuse of primary keys? When does it usually oc-
cur?
6. Describe the functions of data correction in data cleansing tools.
7. Name five common sources of data pollution. Give an example for each type of
source.
8. List six types of error discovery features found in data cleansing tools.
9. What is the “clean as you go” method? Is this a good approach for the data ware-
house environment?
10. Name any three types of participants on the data quality team. What are their func-
tions?
EXERCISES
1. Match the columns:
1. domain integrity A. detect inconsistencies
2. data aging B. better customer service
3. entity integrity C. synchronize all data
4. data consumer D. allowable values
5. poor quality data E. used to pass edits
6. data consistency expert F. uses warehouse data
7. error discovery G. heterogeneous systems integration
8. data pollution source H. lost business opportunities
9. dummy values I. prevents duplicate key values
10. data quality benefit J. decay of field values
2. Assume that you are the data quality expert on the data warehouse project team for
a large financial institution with many legacy systems dating back to the 1970s. Re-
view the types of data quality problems you are likely to have and make suggestions
on how to deal with those.
3. Discuss the common sources of data pollution and provide examples.
312
DATA QUALITY: A KEY TO SUCCESS
4. You are responsible for the selection of data cleansing tools for your data warehouse
environment. How will you define the criteria for selection? Prepare a checklist for
evaluation and selection of these tools.
5. As a data warehouse consultant, a large bank with statewide branches has hired you
to help the company set up a data quality initiative. List your major considerations.
Produce an outline for a document describing the initiative, the policies, and the
procedures.
EXERCISES
313
CHAPTER 14
MATCHING INFORMATION TO
THE CLASSES OF USERS
CHAPTER OBJECTIVES
ț Appreciate the enormous information potential of the data warehouse
ț Carefully note all the users who will use the data warehouse and devise a practical
way to classify them
ț Delve deeply into the types of information delivery mechanisms
ț Match each class of user to the appropriate information delivery method
ț Understand the overall information delivery framework and study the components
Let us assume that your data warehouse project team has successfully identified all the
pertinent source systems. You have extracted and transformed the source data. You have
the best data design for the data warehouse repository. You have applied the most effective
data cleansing methods and gotten rid of most of the pollution from the source data. Using
the most optimal methods, you have loaded the transformed and cleansed data into your
data warehouse database. Now what?
After performing all of these tasks most effectively, if your team has not provided the
best possible mechanism for information delivery to your users, you have really accom-
plished nothing from the users’ perspective. As you know, the data warehouse exists for
one reason and one reason alone. It is there just for providing strategic information to your
users. For the users, the information delivery mechanism is the data warehouse. The user
interface for information is what determines the ultimate success of your data warehouse.
If the interface is intuitive, easy to use, and enticing, the users will keep coming back to
the data warehouse. If the interface is difficult to use, cumbersome, and convoluted, your
project team may as well leave the scene.
Who are your users? What do they want? Your project team, of course, knows the an-
swers and has designed the data warehouse based on the requirements of these users. How
315
Data Warehousing Fundamentals: A Comprehensive Guide for IT Professionals. Paulraj Ponniah
Copyright © 2001 John Wiley & Sons, Inc.
ISBNs: 0-471-41254-6 (Hardback); 0-471-22162-7 (Electronic)
do you provide the needed information to your users? This depends on who your users are,
what information they need, when and where they need the information, and in exactly
what form they need the information. In this chapter, we will consider general classes of
users of a typical warehouse and the methods for providing information to them.
A large portion of the success of your data warehouse rests on the information delivery
tools made available to the users. Selecting the right tools is of paramount importance.
You have to make sure that the tools are most appropriate for your environment. We will
discuss in detail the selection of information delivery tools.
INFORMATION FROM THE DATA WAREHOUSE
As an IT professional, you have been involved in providing information to the user com-
munity. You must have worked on different types of operational systems that provide in-
formation to users. The users in enterprises make use of the information from the opera-
tional systems to perform their day-to-day work and run the business. If we have been
involved in information delivery from operational systems and we understand what infor-
mation delivery to the users entails, then what is the need for this special study on infor-
mation delivery from the data warehouse?
Let us review how information delivery from a data warehouse differs from informa-
tion delivery from an operational system. If the kinds of strategic information made avail-
able in a data warehouse were readily available from the source systems, then we would
not really need the warehouse. Data warehousing enables the users to make better strate-
gic decisions by obtaining data from the source systems and keeping it in a format suit-
able for querying and analysis.
Data Warehouse Versus Operational Systems
Databases already exist in operational systems for querying and reporting. If so, how do
the databases in operational systems differ from those of the databases in the data ware-
house? The difference relates to two aspects of the information contained in these data-
bases. First, they differ in the usage of the information. Next, they differ in the value of
the information. Figure 14-1 shows how the data warehouse differs from an operational
system in usage and value.
Users go to the data warehouse to find information on their own. They navigate
through the contents and locate what they want. The users formulate their own queries and
run them. They format their own reports, run them, and receive the results. Some users
may use predefined queries and preformatted reports but, by and large, the data ware-
house is a place where the users are free to make up their own queries and reports. They
move around the contents and perform their own analysis, viewing the data in ever so
many different ways. Each time a user goes to the data warehouse, he or she may run dif-
ferent queries and different reports, not repeating the earlier queries or reports. The infor-
mation delivery is interactive.
Compare this type of usage of the data warehouse to how an operational system is used
for information delivery. How often are the users allowed to run their own queries and for-
mat their own reports from an operational system? From an inventory control application,
do the users usually run their own queries and make up their own reports? Hardly ever.
First of all, because of efficiency considerations, operational systems are not designed to
316
MATCHING INFORMATION TO THE CLASSES OF USERS
let users loose on the systems. The users may impact the performance of the system ad-
versely with runaway queries. Another important point is that the users of operational sys-
tems do not exactly know the contents of the databases and metadata or data dictionary
entries are typically unavailable to them. Interactive analysis, which forms the bedrock of
information delivery in the data warehouse, is almost never present in an operational sys-
tem.
What about the value of the information from the data warehouse to the users? How
does the value of information from an operational system compare to the value from the
data warehouse? Take the case of information for analyzing the business operations. The
information from an operational system shows the users how well the enterprise is doing
for running the day-to-day business. The value of information from an operational system
enables the users to monitor and control the current operations. On the other hand, infor-
mation from the data warehouse gives the users the ability to analyze growth patterns in
revenue, profitability, market penetration, and customer base. Based on such analysis, the
users are able to make strategic decisions to keep the enterprise competitive and sound.
Look at another area of the enterprise, namely, marketing. With regard to marketing, the
value of information from the data warehouse is oriented to strategic matters such as mar-
ket share, distribution strategy, predictability of customer buying patterns, and market
penetration. Although this is the case of the value of information from the data warehouse
for marketing, what is the value of information from operational systems? Mostly for
monitoring sales against target quotas and for attempting to get repeat business from cus-
tomers.
We see that the usage and value of information from the data warehouse differ from
those of information from operational systems. What is the implication of the differences?
First of all, because of the differences, as an IT professional, you should not try to apply
INFORMATION FROM THE DATA WAREHOUSE
317
Figure 14-1 Data warehouse versus operational systems.
the principles of information delivery from operational systems to the data warehouse. In-
formation delivery from the data warehouse is markedly different. Different methods are
needed. Then, you should take serious note of the interactive nature of information deliv-
ery from the data warehouse. Users are expected to gather information and perform analy-
sis from the data in the data warehouse interactively on their own without the assistance of
IT. The IT staff supporting the data warehouse users do not run the queries and reports for
the users; the users do that by themselves. So make the information from the data ware-
house easily and readily available to the users in their own terms.
Information Potential
Before we look at the different types of users and their information needs, we need to gain
an appreciation of the enormous information potential of the data warehouse. Because of
this great potential, we have to pay adequate attention to information delivery from the
data warehouse. We cannot treat information delivery in a special way unless we fully re-
alize the significance of how the data warehouse plays a key role in the overall manage-
ment of an enterprise.
Overall Enterprise Management. In every enterprise, three sets of processes gov-
ern the overall management. First, the enterprise is engaged in planning. Execution of the
plans takes place next. Assessment of the results of the execution follows. Figure 14-2 in-
dicates these plan–executive–assess processes.
Let us see what happens in this closed loop. Consider the planning for expansion into a
specific geographic market for an enterprise. Let us say your company wants to increase
its market share in the Northwest Region. Now this plan is translated into execution by
318
MATCHING INFORMATION TO THE CLASSES OF USERS
PLANNING
EXECUTION
ASSESSMENT
Plan
marketing
campaigns
Execute
marketing
campaigns
Assess
results of
campaigns
Enhance
campaigns
based on
results
Data
Warehouse
helps in
planning
Data
Warehouse
helps
assess
results
Figure 14-2 Enterprise plan–execute–assess closed loop.
means of promotional campaigns, improved services, and customized marketing. After
the plan is executed, your company wants to find the results of the promotional campaigns
and the marketing initiatives. Assessment of the results determines the effectiveness of the
campaigns. Based on the assessment of the results, more plans may be made to vary the
composition of the campaigns or launch additional ones. The cycle of planning, execut-
ing, and assessing continues.
It is very interesting to note that the data warehouse, with its specialized information
potential, fits nicely in this plan–execute–assess loop. The data warehouse reports on the
past and helps plan the future. First, the data warehouse assists in the planning. Once the
plans are executed, the data warehouse is used to assess the effectiveness of the execution.
Let us go back to the example of your company wanting to expand in the Northwest
Region. Here the planning consists of defining the proper customer segments in that region
and also defining the products to concentrate on. Your data warehouse can be used effec-
tively to separate out and identify the potential customer segments and product groups for
the purpose of planning. Once the plan is executed with promotional campaigns, your data
warehouse helps the users to assess and analyze the results of the campaigns. Your users can
analyze the results by product and by individual districts in the Northwest Region. They can
compare the sales to the targets set for the promotional campaigns, or the prior year’s sales,
or against industry averages. The users can estimate the growth in earnings due to the pro-
motional campaigns. The assessment can then lead to further planning and execution. This
plan–execute–assess loop is critical for the success of an enterprise.
Information Potential for Business Areas. We considered one isolated example
of how the information potential of your data warehouse can assist in the planning for a
market expansion and in the assessment of the results of the execution of marketing cam-
paigns for that purpose. Let us go through a few general areas of the enterprise where the
data warehouse can assist in the planning and assessment phases of the management loop.
Profitability Growth. To increase profits, management has to understand how the prof-
its are tied to product lines, markets, and services. Management must gain insights into
which product lines and markets produce greater profitability. The information from the
data warehouse is ideally suited to plan for profitability growth and to assess the results
when the plans are executed.
Strategic Marketing. Strategic marketing drives business growth. When management
studies the opportunities for up-selling and cross-selling to existing customers and for ex-
panding the customer base, they can plan for business growth. The data warehouse has
great information potential for strategic marketing.
Customer Relationship Management. A customer’s interactions with an enterprise
are captured in various operational systems. The order processing system contains the or-
ders placed by the customer; the product shipment system, the shipments; the sales sys-
tem, the details of the products sold to the customer; the accounts receivable system, the
credit details and the outstanding balances. The data warehouse has all the data about the
customer extracted from the various disparate source systems, transformed, and integrat-
ed. Thus, your management can “know” their customers individually from the informa-
tion available in the data warehouse. This knowledge results in better customer relation-
ship management.
INFORMATION FROM THE DATA WAREHOUSE
319
Corporate Purchasing. From where can your management get the overall picture of
corporate-wide purchasing patterns? Your data warehouse. This is where all data about
products and vendors are collected after integration from the source systems. Your data
warehouse empowers corporate management to plan for streamlining purchasing process-
es.
Realizing the Information Potential. What is the underlying significance of the infor-
mation potential of the data warehouse? The data warehouse enables the users to view the
data in the right business context. The various operational systems collect massive quanti-
ties of data on numerous types of business transactions. But these operational systems are
not directly helpful for planning and assessment of results. The users need to assess the re-
sults by viewing the data in the proper business context. For example, when viewing the
sales in the Northwest Region, the users need to view the sales in the business context of
geography, product, promotion, and time. The data warehouse is designed for analysis of
metrics such as sales along these dimensions. The users are able to retrieve the data, trans-
form it into useful information, and leverage the information for planning and assessing
the results.
The users interact with the data warehouse to obtain the data, transform it into useful
information, and realize the full potential. This interaction of the users generally goes
through the six stages indicated in Figure 14-3 and summarized below.
1. Think through the business need and define it in terms of business rules as applica-
ble to data in the data warehouse.
2. Harvest or select the appropriate subset of the data according to the stipulated busi-
ness rules.
320
MATCHING INFORMATION TO THE CLASSES OF USERS
DATA
WAREHOUSE
END
-
USERS
Define business
need in terms of
warehouse data.
Select appropriate
data subset from
warehouse.
Enrich selected
subset with
calculations, etc.
Associate
meanings to
selected data.
Structure results
into formats
suitable to users.
Present structured
results in a variety
of ways.
DATA
INFORMATION
6
5
4
3
2
1
Figure 14-3 Realization of the information potential: stages.
3. Enrich the selected subset with calculations such as totals or averages. Apply trans-
formations to translate codes to business terms.
4. Use metadata to associate the selected data with its business meaning.
5. Structure the result in a format useful to the users.
6. Present the structured information in a variety of ways, including tables, texts,
graphs, and charts.
User–Information Interface
In order to pass through the six stages and realize the information potential of the data
warehouse, you have to build a solid interface for information delivery to the users. Put
the data warehouse on one side and the entire community of users on the other. The inter-
face must be able to let the users realize the full information potential of the data ware-
house.
The interface logically sits in the middle, enabling information delivery to the users.
The interface could be a specific set of tools and procedures, tailored for your environ-
ment. At this point, we are not discussing the exact composition of the interface; we just
want to specify its features and characteristics. Without getting into the details of the types
of users and their specific information needs, let us define the general characteristics of
the user–information interface.
Information Usage Modes. When you consider all the various ways the data ware-
house may be used, you note that all the usage comes down to two basic modes or ways.
Both modes relate to obtaining strategic information. Remember, we are not considering
information retrieved from operational systems.
Verification Mode. In this mode, the business user proposes a hypothesis and asks a se-
ries of questions to either confirm or repudiate it. Let us see how the usage of the infor-
mation in this mode works. Assume that your marketing department planned and executed
several promotional campaigns on two product lines in the South-Central Region. Now
the marketing department wants to assess the results of the campaign. The marketing de-
partment goes to the data warehouse with the hypothesis that the sales in the South-
Central Region have increased. Information from the data warehouse will help confirm
the hypothesis.
Discovery Mode. When using the data warehouse in the discovery mode, the business
analyst does not use a predefined hypothesis. In this case, the business analyst desires to
discover new patterns of customer behavior or product demands. The user does not have
any preconceived notions of what the result sets will indicate. Data mining applications
with data feeds from the data warehouse are used for knowledge discovery.
We have seen that users interact with the data warehouse for information either in the
hypothesis verification mode or in a knowledge discovery mode. What are the approaches
for the interaction? In other words, do the users interact with the data warehouse in an in-
formational approach, an analytical approach, or by using data mining techniques?
Informational Approach. In this approach, with query and reporting tools, the users
retrieve historical or current data and perform some standard statistical analysis. The data
INFORMATION FROM THE DATA WAREHOUSE
321
may be lightly or heavily summarized. The result sets may take the form of reports and
charts.
Analytical Approach. As the name of this approach indicates, the users make use of
the data warehouse for performing analysis. They do the analysis along business dimen-
sions using historical summaries or detailed data. The business users conduct the analysis
using their own business terms. More complex analysis involves drill down, roll up, or
slice and dice.
Data Mining Approach. Both the informational and analytical approaches work in the
verification mode. The data mining approach, however, works in the knowledge discovery
mode.
We have reviewed two modes and three approaches for information usage. What about
the characteristics and structures of the data that is being used? How should the data be
available through the user–information interface? Typically, the information made avail-
able through the user–information interface has the following characteristics:
Preprocessed Information. These include routine information automatically created
and made readily available. Monthly and quarterly sales analysis reports, summary
reports, and routine charts fall into this category. Users simply copy such pre-
processed information.
Predefined Queries and Reports. This is a set of query templates and report formats
kept ready for the users. The users apply the appropriate parameters and run the
queries and reports as and when needed. Sometimes, the users are allowed to make
minor modifications to the templates and formats.
Ad Hoc Constructions. Users create their own queries and reports using appropriate
tools. This category acknowledges the fact that not every need of the users can be
anticipated. Generally, only power users and some regular users construct their own
queries and reports.
Finally, let us list the essential features necessary for the user–information interface.
The interface must
ț Be easy to use, intuitive, and enticing to the users
ț Support the ability to express the business need clearly
ț Convert the expressed need into a set of formal business rules
ț Be able to store these rules for future use
ț Provide ability to the users to modify retrieved rules
ț Select, manipulate, and transform data according to the business rules
ț Have a set of data manipulation and transformation tools
ț Correctly link to data storage to retrieve the selected data
ț Be able to link with metadata
ț Be capable of formatting and structuring output in a variety of ways, both textual
and graphical
ț Have the means of building a procedure for executing specific steps
ț Have a procedure management facility
322
MATCHING INFORMATION TO THE CLASSES OF USERS
Industry Applications
So far in this section, we have clearly perceived the great information potential of the data
warehouse. This enormous information potential drives the discussion that follows, where
we get into more specifics and details. Before we do that, let us pause to refresh our minds
on how the information potential of data warehouses is realized in a sample of industry
sectors.
Manufacturing: Warranty and service management, product quality control, order ful-
fillment and distribution, supplier and logistics integration.
Retail and Consumer Goods: Store layout, product bundling, cross-selling, value chain
analysis.
Banking and Finance: Relationship management, credit risk management.
WHO WILL USE THE INFORMATION?
You will observe that in six months after deployment of the data warehouse, the number
of active users doubles. This is a typical experience for most data warehouses. Who are
these new people arriving at the data warehouse for information? Unless you know how to
anticipate who will come to get information, you will not be able to cater to their needs
appropriately and adequately.
Anyone who needs strategic information is expected to be part of the groups of users.
That includes business analysts, business planners, departmental managers, and senior ex-
ecutives. Each of the data marts may be built for the specific needs of one segment of the
user groups. In this case, you can identify the special groups and cater to their needs. At
this stage, when we are discussing information delivery, we are not considering the infor-
mation content so much but the actual mechanism of information delivery.
Each group of users has specific business needs for which they expect to get answers
from the data warehouse. When we try to classify the user groups, it is best to understand
them from the perspective of what they expect to get out of the warehouse. How are they
going to use the information content in their job functions? Each user is performing a par-
ticular business function and needs information for support in that specific job function.
Let us, therefore, base our classification of the users on their job functions and organiza-
tional levels.
Figure 14-4 suggests a way of classifying the user groups. When you classify the
users by their job functions, their positions in the organizational hierarchy, and their
computing proficiency, you get a firm basis for understanding what they need and how
to provide information in the proper formats. If you are considering a user in account-
ing and finance, that user will be very comfortable with spreadsheets and financial ra-
tios. For a user in customer service, a GUI screen showing consolidated information
about each customer is most useful. For someone in marketing, a tabular format may be
suitable.
Classes of Users
In order to make your information delivery mechanism best suited for your environment,
you need to have a thorough understanding of the classes of users. First, let us start by as-
WHO WILL USE THE INFORMATION?
323
sociating the computing proficiency of the users with how each group based on this type
of division interacts with the data warehouse.
Casual or Novice User. Uses the data warehouse occasionally, not daily. Needs a very
intuitive information interface. Looks for the information delivery to prompt the
user with available choices. Needs big button navigation.
Regular User. Uses the data warehouse almost daily. Comfortable with computing op-
tions but cannot create own reports and queries from scratch. Needs query tem-
plates and predefined reports.
Power User. Is highly proficient with technology. Can create reports and queries from
scratch. Some can write their own macros and scripts. Can import data into spread-
sheets and other applications.
Now let us change the perspective a bit and look at the user types by the way they wish
to interact to obtain information.
Preprocessed Reports. Use routine reports run and delivered at regular intervals.
Predefined Queries and Templates. Enter own set of parameters and run queries with
predefined templates and reports with predefined formats.
Limited Ad Hoc Access. Create from scratch and run limited number and simple types
of queries and analysis.
Complex Ad Hoc Access. Create complex queries and run analysis sessions from
scratch regularly. Provide the basis for preprocessed and predefined queries and re-
ports.
324
MATCHING INFORMATION TO THE CLASSES OF USERS
Organizational
Hierarchy
Job
Function
Marketing
Personnel
Purchasing
Accounting
Novice User
Regular
User
Power User
Computing
Proficiency
Support
Analyst
Manager
Executive
Figure 14-4 A method for classifying the users.
Let us view the user groups from yet another perspective. Consider the users based on
their job functions.
High-Level Executives and Managers. Need information for high-level strategic de-
cisions. Standard reports on key metrics are useful. Customized and personalized
information is preferable.
Technical Analysts. Look for complex analysis, statistical analysis, drill-down and
slice-dice capabilities, and freedom to access the entire data warehouse.
Business Analysts. Although comfortable with technology, are not quite adept at creat-
ing queries and reports from scratch. Predefined navigation helpful. Want to look at
the results in many different ways. To some extent, can modify and customize pre-
defined reports.
Business-Oriented Users. These are knowledge workers who like point-and-click
GUIs. Desire to have standard reports and some measure of ad hoc querying.
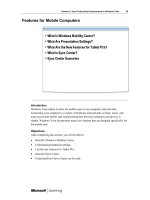
We have reviewed a few ways of understanding how the users may be grouped. Now,
let us put it all together and label the user classes in terms of their access and information
delivery practices and preferences. Please see Figure 14-5 showing a way of classifying
the users adopted by many data warehousing experts and practitioners. This figure shows
five broad classes of users. Within each class, the figure indicates the basic characteristics
of the users in that class. The figure also assigns the users in the organizational hierarchy
to specific classes.
Although the classification appears to be novel and interesting, you will find that it
provides us with a good basis to understand the characteristics of each group of users. You
can fit any user into one of these classes. When you observe the computing proficiency,
WHO WILL USE THE INFORMATION?
325
FARMERS
EXPLORERS
OPERATORS
MINERS
TOURISTS
DATA
WAREHOUSE
Executives
:
interested in
business
indicators
Support
staff
:
interested
in current
data
Analysts
:
interested
in routine
analysis
Skilled
analysts
:
interested in
highly ad
hoc analysis
Special
purpose
analysts
:
interested in
knowledge
discovery
Figure 14-5 Data warehouse user classes.