Databases Demystified a self teaching guide phần 3 potx
Bạn đang xem bản rút gọn của tài liệu. Xem và tải ngay bản đầy đủ của tài liệu tại đây (2.13 MB, 37 trang )
Once you have used Microsoft Access to open one or more database files, a list of
the most recently used database files will appear in a list just below the Open an Ex
-
isting File option in the startup window. You may reopen a previously used database
merely by clicking its filename in the list. After you have opened the database, you
will see a screen similar to the one shown in Figure 3-2.
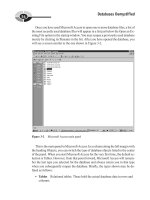
This is the main panel in Microsoft Access. In a column along the left margin with
the heading Objects, you can switch the type of database objects listed in the center
of the panel. When you start Microsoft Access for the very first time, the default se
-
lection is Tables. However, from that point forward, Microsoft Access will remem
-
ber the last type you selected for the database and always return you to that type
when you subsequently reopen the database. Briefly, the types shown may be de
-
fined as follows:
•
Tables Relational tables. These hold the actual database data in rows and
columns.
54
Databases Demystified
Figure 3-2 Microsoft Access main panel
P:\010Comp\DeMYST\364-9\ch03.vp
Monday, February 09, 2004 8:42:39 AM
Color profile: Generic CMYK printer profile
Composite Default screen
•
Queries Stored database queries. These are called views in nearly all
other relational databases.
•
Forms GUI forms for data entry and/or display within Microsoft Access.
•
Reports Reports based on database queries.
•
Pages Web pages for data entry and/or display using a web browser.
•
Macros Sets of actions that each perform a particular operation, such as
opening a form or printing a report.
•
Modules Collections of Visual Basic programming language components
that are stored as a unit.
As with many personal computer–based databases, Microsoft Access is not only
a database, but also a complete development environment for building and running
applications. The database products that run on larger, shared computer systems
commonly called servers typically do not come with application-development envi-
ronments. Learning to build application programs is well outside the scope of this
book, so we will not deal with the Forms, Reports, Pages, Macros, and Modules
types at all. We will focus only on the Tables and Queries types in Microsoft Access.
Maintenance of the objects in the database can be performed from this panel, in-
cluding the following tasks:
•
To add a new object of the type displayed, click the appropriate shortcut
near the top of the list. For example, the Tables object list includes a shortcut
called Create Table in Design View.
•
To delete an existing object, click its name so it is selected and then
press
DELETE.
•
To display an object, double-click its name.
•
To display the definition (design) of an object, click its name so that it is
selected and then click the Design View button on the toolbar (the one with
the ruler, pencil, and triangle on it).
The Microsoft Access Relationships Panel
Microsoft Access provides the Relationships panel, shown in Figure 3-3, for the def
-
inition and maintenance of referential constraints between the relational tables. To
display this panel, either click the toolbar button (the icon with three tables and lines
drawn between them on it) or select Tools | Relationships from the menu bar.
CHAPTER 3 Forms-Based Database Queries
55
P:\010Comp\DeMYST\364-9\ch03.vp
Monday, February 09, 2004 8:42:40 AM
Color profile: Generic CMYK printer profile
Composite Default screen
56
Databases Demystified
Demystified / Databases Demystified / Oppel/ 225364-9 / Chapter 3
The Relationships panel graphically displays tables, shown as rectangles, and
one-to-many relationships, shown as lines between the rectangles. Technically,
these are referential constraints (relationships being only a conceptual term), but be-
cause Microsoft calls them relationships on this panel, I will also for consistency.
The symbol “1” shows the “one” side of each relationship, whereas the infinity sym-
bol (similar to the number 8 laying on its side) shows the “many” side of each rela-
tionship. The relationships may be maintained as follows:
•
To add tables that are not displayed, click the Show Table button on the
toolbar (the one with a table and bold yellow plus sign on it), and select
the tables from the pop-up window.
•
To remove a table from the display, click it so that it is selected and then
press
DELETE. Note that this does not delete the table or any relationships
in which the table participates; it merely removes the table from the panel.
•
To add a relationship, drag the primary key in one table to the matching
foreign key in another. For recursive relationships, the table must be added
to the display a second time, and the relationship must be created between
one displayed copy of the table and the other. This looks odd at first, but it
is only to facilitate the drag-and-drop method of creating the relationship.
A table shown multiple times on the panel still exists only one time in the
database.
•
To delete a relationship, click the narrow part of its line and press DELETE.
Selecting relationships can be tricky in Microsoft Access because only the
Figure 3-3 The Microsoft Access Relationships panel
P:\010Comp\DeMYST\364-9\ch03.vp
Monday, February 09, 2004 8:42:40 AM
Color profile: Generic CMYK printer profile
Composite Default screen
narrow part of the line will work, and you may have to stretch short lines by
moving a table on the panel in order to even find the narrow part of the line.
•
To edit a relationship, double-click the narrow part of its line. A pop-up
window may be used to change various options about the relationship,
including toggling enforcement of the relationship as a referential constraint
on and off (that is, enabling and disabling the constraint). When a constraint is
disabled, the DBMS will not prevent inserts, updates, and deletes from creating
“orphan” foreign key values (foreign key values that have no matching primary
key values in the parent table). The DBMS will, however, not permit a constraint
to be enabled if there are orphan foreign key values in the child table.
Closing or minimizing the window will make the main panel visible once again.
The Microsoft Access Table Design View
From the main panel, a table may be selected by double-clicking its name. The de-
fault display, called the Datasheet View, is shown in Figure 3-4. The data in the table
is displayed in the familiar tabular form, and the data may be updated if desired, in-
cluding the insertion and deletion of rows. Be careful. There is no “undo” feature—
once you move the cursor from one row to another, any changes you have made can-
not be easily reversed.
To see the definition of the table, click the Design View button on the toolbar (the
one with the ruler, pencil, and triangle on it). Figure 3-5 shows the Design View for
the Employees table.
CHAPTER 3 Forms-Based Database Queries
57
Figure 3-4 Datasheet View (Employees table)
Design View
P:\010Comp\DeMYST\364-9\ch03.vp
Monday, February 09, 2004 8:42:40 AM
Color profile: Generic CMYK printer profile
Composite Default screen
The Design View for a table in Microsoft Access displays information such as the
following:
•
Field Name The name of the column.
•
Data Type The data type for the column.
•
Description A description of the column, typically provided by a DBA.
•
Field Size A subtype within the data type. For example, Long Integer and
Short Integer apply to the more general Number data type.
•
Required Indicates whether the column is optional (that is, whether it
may have null values).
•
Indexed Indicates whether the column has an index.
•
Primary Key Denoted with a small key icon next to the field name (or
names) that comprises the primary key.
58
Databases Demystified
Figure 3-5 Design View (Employees table)
P:\010Comp\DeMYST\364-9\ch03.vp
Monday, February 09, 2004 8:42:41 AM
Color profile: Generic CMYK printer profile
Composite Default screen
Hopefully, you recognized that everything on this panel is metadata. There are
many more options than the ones noted here, and Microsoft Access is very clever
about hiding and exposing options so only the applicable ones are displayed. Notice
that help text in blue automatically displays in the lower-right part of the panel as
you move the cursor from one option to another.
Creating Queries in Microsoft Access
As mentioned earlier, stored queries are called views in most databases, but because
a view is defined as a stored database query, the Microsoft Access name is techni
-
cally correct. Always keep in mind that queries do not store any data; instead, the
data is stored in the tables. On the main panel, clicking the Queries button (along the
left margin) lists all the queries stored in this database, as shown in Figure 3-6.
CHAPTER 3 Forms-Based Database Queries
59
Figure 3-6 Microsoft Access Queries window
P:\010Comp\DeMYST\364-9\ch03.vp
Monday, February 09, 2004 8:42:41 AM
Color profile: Generic CMYK printer profile
Composite Default screen
Although Microsoft Access offers several ways to create a new query, for begin
-
ners, the Create Query in Design View option is the easiest to understand. Figure 3-7
shows the Design View for a New Query panel (also called the Query Design View
panel) with the Show Table dialog box open.
For every new query, Microsoft Access opens the Show Table dialog box to allow
for the selection of the tables and/or queries on which the query will be based (that
is, the tables or queries that are to be the source of the data that will be displayed).
Once the tables are added, the Query Design View panel allows for the entry of the
specification for the desired query. Figure 3-8 shows the Query Design View panel
with the Customers table added.
The Query Design View panel has the following components:
•
In the open area at the top of the panel (gray background), a graphical
representation of the source tables and/or views and the relationships for the
query are shown. Any relationships defined for the tables are automatically
inherited here.
60
Databases Demystified
Figure 3-7 Query Design View with the Show Table dialog box visible
P:\010Comp\DeMYST\364-9\ch03.vp
Monday, February 09, 2004 8:42:41 AM
Color profile: Generic CMYK printer profile
Composite Default screen
•
In the grid area in the lower part of the panel, each column represents a
column of data that is to be returned in the result set when the query is
executed. Rows in the grid area define various options to be applied to the
corresponding columns (usage examples are provided in the sections that
follow):
•
Field The specification for the source of the column. This is normally
a table or query column name, but it can also be a constant or an
expression similar to calculations used in spreadsheets.
•
Table The source table or query name for the column.
•
Sort The specification for any sort sequencing for the column
(Ascending, Descending, or None).
•
Show A check box that controls display of the column. If the box
is not checked, the column may be used in forming the query, but does
not appear in the query results.
•
Criteria The specification that determines which rows of data are to
appear in the query results. All conditions placed on the same line must
be met for a row of data to be displayed in the query results. Conditions
placed on subsequent lines (labeled “or” on the panel) are alternative sets
of conditions that will also cause a matching data row to be displayed in
the results. The usage of these will likely not make sense until you see
the examples that follow, but in short, conditions placed on one line
CHAPTER 3 Forms-Based Database Queries
61
Figure 3-8 Query Design View
P:\010Comp\DeMYST\364-9\ch03.vp
Monday, February 09, 2004 8:42:42 AM
Color profile: Generic CMYK printer profile
Composite Default screen
are connected with a logical AND operator, and each new line of criteria
is connected using a logical OR operator with all the other lines. Said
another way, any row that matches the specifications that appear on any
one of the criteria lines will be displayed in the query results.
Once the specification is complete, clicking the Run button (the one with the ex
-
clamation point on it) runs the query and displays the results using the Datasheet
View, as already shown in Figure 3-4. To go back to the Query Design View panel,
simply click the Design View button (the one with the ruler, pencil, and triangle on
it). For most queries, data updates may be applied directly in the Datasheet View
table, and they are applied directly to the source tables for the query. If a column in
the query results cannot be mapped to a single table column—perhaps because it
was calculated in some way—then it cannot be updated in the query results.
The remainder of this section will use a series of examples to demonstrate the
powerful features of the Microsoft Access Queries tool. For each example, there is a
description of the result desired and the steps required to create the specification for
the query on the Query Design View panel. This is followed by a figure showing the
completed Design View panel, and another figure showing the results when the query
is executed.
Example 3-1: List All Customers
To list the entire Customers table (all rows and all columns), follow these steps:
1. From the main panel with Queries selected in the left margin, double-click
the link Create Query in Design View.
2. Perform the following actions in the Show Table dialog box:
•
Click Customers to select the Customers table.
•
Click the Add button.
•
Click the Close button.
3. On the Design View panel, double-click the asterisk in the Customers table
template (near the top of the panel).
The completed panel is shown at the top of Figure 3-9 with the query results shown
below.
62
Databases Demystified
P:\010Comp\DeMYST\364-9\ch03.vp
Monday, February 09, 2004 8:42:42 AM
Color profile: Generic CMYK printer profile
Composite Default screen
CHAPTER 3 Forms-Based Database Queries
63
Demystified / Databases Demystified / Oppel/ 225364-9 / Chapter 3
Example 3-2: Choosing Columns to Display
Instead of displaying all columns, we now specify only the ones that we wish to see.
To list the CustomerID, CompanyName, City, Region, and Country columns for all
customers (all rows and all columns), follow the steps outlined in this section.
Using the Design View from Example 3-1 as a starting point, modify the query as
follows:
1. Remove the existing specification that displays all columns by clicking the
small gray rectangle above field name “Customers.*” (which changes the entire
column to a black background). Then press
DELETE to remove the column.
Figure 3-9 Example 3-1, “List All Customers” (Query Design View) (top), and the
query results (bottom)
P:\010Comp\DeMYST\364-9\ch03.vp
Monday, February 09, 2004 8:42:42 AM
Color profile: Generic CMYK printer profile
Composite Default screen
64
Databases Demystified
2. For each desired column (CustomerID, CompanyName, City, Region, and
Country), double-click the column name in the table shown at the top of the
form. An alternative method is to drag and drop the column name from the
table shown at the top of the form to the grid in the lower part of the form.
The completed panel and query results are shown in Figure 3-10.
Example 3-3: Sorting Results
In any RDBMS, rows are returned in no particular order unless you request one.
Microsoft Access uses the Sort specification to determine the order in which rows
are returned in query results.
Figure 3-10 Example 3-2, “Choosing Columns to Display” (top), and the query results
(bottom)
P:\010Comp\DeMYST\364-9\ch03.vp
Monday, February 09, 2004 8:42:43 AM
Color profile: Generic CMYK printer profile
Composite Default screen
To modify Example 3-2 so that rows are sorted in ascending order by city, region,
and country, follow these steps:
1. On the line labeled Sort in the column for City, click in the blank space and
select Ascending from the pull-down list.
2. Do the same for the Region column. A simple alternative method is to type
A in the sort specification and press
ENTER.
3. Do the same for the Country column.
The completed panel and query results are shown in Figure 3-11.
CHAPTER 3 Forms-Based Database Queries
65
Figure 3-11 Example 3-3, “Sorting Results” (top), and the query results (bottom)
P:\010Comp\DeMYST\364-9\ch03.vp
Monday, February 09, 2004 8:42:43 AM
Color profile: Generic CMYK printer profile
Composite Default screen
Example 3-4: Advanced Sorting
Looking at the results of Example 3-3, you can see that all the cities are listed in as
-
cending sequence and that sorting by region and then by country had little effect and
would matter only if two cities with the same name existed in different regions and
countries. Spoken language not always being logically precise, this is unlikely to be
what we meant when we said we wanted the data sorted by city, region, and country.
Instead, we likely wanted all the rows for a country to be together, and for each coun
-
try, all the rows in a region to be together, and for each region, all the cities to be listed
in ascending sequence by name. If we had said sort by city within region within
country, our intent would have been clearer. Now we need a way to sort by country
first, region second, and city last, but city is displayed before region, and region be
-
fore country. Microsoft Access sorting works on the columns in the query from left
to right. How can we accomplish our goal? We can place the Region and City col-
umns in the query a second time, use the second copies for sorting, but omit them
from the query results using the Show check box.
To modify Example 3-3 so that rows are sorted as discussed, follow these steps:
1. Remove the sort specifications on the existing City and Region columns.
2. Add the Region column again by double-clicking its name in the
Customers table.
3. Do the same for the City column.
4. Add the ascending sort specification to the Region and City columns
that you just added (the ones to the right of the Country column).
5. Remove the check mark for the Region and City columns that you just added.
The completed panel and query results are shown in Figure 3-12.
Note that most languages are read from left to right, so we naturally expect tabular
listings to be sorted moving from left to right, starting with the leftmost column. It is
unusual, and perhaps poor human engineering, to sort columns another way. But
should you ever need to, you now know how.
Example 3-5: Choosing Rows to Display
Thus far we have been displaying all 91 rows in the Customer table in every query. If
we do not wish to see all the rows, displaying all of them is wasteful of system re
-
sources, especially if we are sorting them. Suppose we only wish to see rows for cus
-
tomers in London, UK. We can do so using the Criteria line on the Query Design
View panel.
66
Databases Demystified
P:\010Comp\DeMYST\364-9\ch03.vp
Monday, February 09, 2004 8:42:43 AM
Color profile: Generic CMYK printer profile
Composite Default screen
To modify Example 3-4 to limit the rows displayed:
1. On the line labeled Criteria, type London in the leftmost City column. Note
that Microsoft Access pays no attention to case when selecting data in que
-
ries, so you can also enter LONDON or london and achieve the same result.
2. On the same line, type UK in the Country column. It is important to enter
the City and Country criteria on the same line because we only want rows
returned where the City is “London” and the Country is “UK.”
CHAPTER 3 Forms-Based Database Queries
67
Figure 3-12 Example 3-4, “Advanced Sorting” (top), and the query results (bottom)
P:\010Comp\DeMYST\364-9\ch03.vp
Monday, February 09, 2004 8:42:44 AM
Color profile: Generic CMYK printer profile
Composite Default screen
68
Databases Demystified
Demystified / Databases Demystified / Oppel/ 225364-9 / Chapter 3
The completed panel and query results are shown in Figure 3-13. You may have no
-
ticed that the criteria for Country is not enclosed in double-quotes in the panel at the
top of Figure 3-13. Microsoft Access knows that this is a character format column
and assumes the quotes to be there, even when you leave them out.
Example 3-6: Compound Row Selection
Suppose we now want to select all customers in the state of Washington in the U.S. in
addition to those in London. We must add the new criteria or a different line of the
Query View panel.
Figure 3-13 Example 3-5, “Choosing Rows to Display” (top), and the query results
(bottom)
P:\010Comp\DeMYST\364-9\ch03.vp
Monday, February 09, 2004 8:42:44 AM
Color profile: Generic CMYK printer profile
Composite Default screen
Follow these steps to modify Example 3-5 to include the additional customers:
1. On a new line in the Criteria area of the panel, enter WA in the leftmost Re
-
gion column.
2. On the same line, enter USA in the Country column. Note that the criteria
is interpreted this way: Select all rows where the City equals “London” and
the Country equals “UK”; in addition, select all rows where the Region equals
“WA” and the County equals “USA.”
The completed panel and query results are shown in Figure 3-14.
CHAPTER 3 Forms-Based Database Queries
69
Figure 3-14 Example 3-6, “Compound Row Selection” (top), and the query results
(bottom)
P:\010Comp\DeMYST\364-9\ch03.vp
Monday, February 09, 2004 8:42:45 AM
Color profile: Generic CMYK printer profile
Composite Default screen
Example 3-7: Using Not Equal
Thus far we have looked at search criteria that assumes the “equal” (=) comparison
operator. However, several other comparison operators can be used, as shown in the
following table:
Operator Description
< Less than
<= Less than or equal
> Greater than
>= Greater than or equal
<> Not equal (ANSI standard form)
For example, suppose we need to find all the customers who are not from either
the USA or the UK. Note that we have run into another situation where spoken lan-
guage isn’t logically precise. If we use OR as the logical operator (that is, <>“USA”
OR <>“UK”), we will select all rows in the table, for no matter what data value is in
the row, it won’t be equal to one or the other of those two values. Therefore, we must
use AND as the relational operator because we want rows that are not equal to one
value and also not equal to the other value.
To modify Example 3-6 to find all the customers who are not in the USA and not
in the UK, do the following:
1. Remove all the criteria from the previous example.
2. In the Criteria line for the Country column, enter <>“USA” AND <>“UK”.
Figure 3-15 shows the completed panel and query results.
Example 3-8: Joining Tables
In relational databases, combinining data from more than one table is called joining.
In this example, we wish to display three columns from the Customers table along
with three columns from the Orders table for each order the customer has placed
with Northwind. Because the relationship between orders and customers is one-to-
many, whenever a customer has multiple orders, the same information about the cus
-
tomer will be repeated in the query results for each row returned.
Understanding joins is essential to understanding relational databases. Just as
one-to-many relationships (implemented in the database as referential constraints)
70
Databases Demystified
P:\010Comp\DeMYST\364-9\ch03.vp
Monday, February 09, 2004 8:42:45 AM
Color profile: Generic CMYK printer profile
Composite Default screen
TEAM FLY
are the fundamental building blocks for relational databases, joins are the funda
-
mental building blocks for relational database queries.
It is best to start with a fresh query so that you can see, from the ground up, how
queries using joins are built. Close whatever query windows you may have open and
start on the Microsoft Access main panel with the Queries database object type se
-
lected. Exercise 3-1 can be used as a guide for getting started. To build our query, fol
-
low these steps:
1. Create a new query using the Create Query in Design View shortcut.
CHAPTER 3 Forms-Based Database Queries
71
Figure 3-15 Example 3-7, “Using Not Equal” (top), and the query results (bottom)
P:\010Comp\DeMYST\364-9\ch03.vp
Monday, February 09, 2004 8:42:45 AM
Color profile: Generic CMYK printer profile
Composite Default screen
72
Databases Demystified
Demystified / Databases Demystified / Oppel/ 225364-9 / Chapter 3
2. On the Show Table dialog box, add both the Customers and Orders tables
to the query. Because queries describe what is to be done instead of how it
is to be done, the order in which you add the tables is immaterial. Click the
Close button when you’re done.
3. On the Query Design View panel, notice that both tables are shown and
there is a line connecting them. Microsoft Access already knows how to
match the rows in the tables and will use the CustomerID for each row re
-
turned from the Orders table to find the matching CustomerID in the Cus
-
tomers table. The query inherited the relationship between the two tables
defined using the Relationships panel. Without this join specification in the
query, we would get a Cartesian product as a result, which would be every
row in one table combined with every row in the other (the product of mul
-
tiplying the two tables together). We clearly do not want our query results to
look like every customer placed every single order, so Microsoft Access has
helped us do the right thing. Properties of the join specifications are explored
in some upcoming examples.
4. In the Customers table, double-click the CustomerID, CustomerName,
and Country columns to select them for display in the query results.
5. In the Orders table, double-click the columns OrderDate, ShippedDate,
and Freight.
The completed panel and query results are shown in Figure 3-16.
Example 3-9: Limiting Join Results
The row count in the query results at the bottom of Figure 3-16 shows 830 rows re
-
turned. A look at the Orders table will confirm that there are indeed 830 rows in it.
Obviously, that is more information than a person would likely want to see, but from
the earlier examples we know that we can limit the rows returned using the Criteria
lines on the panel. Also, because we are joining rows from two tables, we can pro
-
vide search criteria for the rows returned from either table or both tables. When the
criteria eliminates a customer, no orders for that customer will show in the results,
and when we eliminate orders from the results, we will see no customer information
for those orders either. This is because the join we are using is by default an inner
join (also known as an exclusive or standard join), which means that rows appear in
the query results only when matching rows are found in all the tables we are joining
together. In Example 3-10, you will see alternatives to this behavior.
P:\010Comp\DeMYST\364-9\ch03.vp
Monday, February 09, 2004 8:42:45 AM
Color profile: Generic CMYK printer profile
Composite Default screen
CHAPTER 3 Forms-Based Database Queries
73
Demystified / Databases Demystified / Oppel/ 225364-9 / Chapter 3
Let’s assume we only want to see rows for customers in Spain and orders dated
after January 1, 1998. To modify Example 3-8 to do this, follow these steps:
1. On the Criteria line in the Country column, enter Spain. Character strings
in relational databases should be enclosed in quotes (actually, double quotes
in Microsoft Access), but Microsoft Access knows the column is in charac
-
ter format, so it will add the quotes for you automatically (or “automagically”
in IT slang).
Figure 3-16 Example 3-8, “Joining Tables” (top), and the query results (bottom)
P:\010Comp\DeMYST\364-9\ch03.vp
Monday, February 09, 2004 8:42:46 AM
Color profile: Generic CMYK printer profile
Composite Default screen
2. On the same criteria line, enter >1/1/1998 in the OrderDate column.
Microsoft Access encloses date strings with hash marks (#) and will do
this for you automatically. Note that we used the greater-than operator (>),
so any order with a date of exactly 1/1/1998 will not be returned in the re
-
sults. We would use the greater-than-or-equal operator (>=) if we want to
include that date, but knowing that the 1st of January is always a holiday,
it does not matter for this query.
The completed panel and query results are shown in Figure 3-17.
74
Databases Demystified
Figure 3-17 Example 3-9, “Limiting Joined Rows” (top), and the query results
(bottom)
P:\010Comp\DeMYST\364-9\ch03.vp
Monday, February 09, 2004 8:42:46 AM
Color profile: Generic CMYK printer profile
Composite Default screen
CHAPTER 3 Forms-Based Database Queries
75
Demystified / Databases Demystified / Oppel/ 225364-9 / Chapter 3
Example 3-10: Outer Joins
As described in Example 3-9, the join technique we have used so far is the inner join.
Note that there is a customer in Spain who has no orders, so that customer’s data did
not appear in the Example 3-9 results. If we wish to include all customers in Spain in
the results, regardless of whether they have placed orders or not, we need to use an
outer join (also called an inclusive join). An outer join returns all rows from one (or
both) of the tables, regardless of whether matching rows are found in the joined tables.
Any data to be displayed from the table where no matching row is found is set to
NULL in the query results. For example, for the customer who has no orders, all the
columns from the Orders table would display as NULL in the results. Keep in mind
that the returned data rows are still filtered by other search criteria (for example, only
customers from Spain; only orders with dates greater than 1/1/98), but whether the
filtering occurs before, during, or after the join operation is immaterial, so long as
the unwanted rows are eliminated from the query results. Remember, we only de-
scribe the result we want, not how to achieve it. There are three types of outer joins,
and unfortunately, the industry has settled on potentially confusing names for them:
•
Left Outer Join An outer join for which all rows are returned from the
left-hand table in the join, and data from any matching rows found in the
right-hand table is also returned.
•
Right Outer Join An outer join for which all the rows are returned from
the right-hand table in the join, and data from any matching rows found in the
left-hand table is also returned.
•
Full Outer Join An outer join for which all rows are returned from
both tables, regardless of whether matching data is found between them.
Microsoft Access does not currently support this type of join.
The confusion comes from the use of left and right in the names of the join types.
All you have to do is reverse the order of the tables in any existing query, and you are
essentially switching it from a left outer join to a right outer join, or vice versa. How
-
ever, Microsoft Access does not make this distinction, so all its joins are simply
called outer joins.
To change Example 3-9 into an outer join, double-click the thin part of the line
between the two tables. This displays the Join Properties dialog box, shown in
Figure 3-18. As with the Relationships panel, it can be tricky getting the cursor in
exactly the right place on the line, but practice and a bit of patience always prevails.
Note that the look of this panel has changed in newer versions of Microsoft Access.
P:\010Comp\DeMYST\364-9\ch03.vp
Monday, February 09, 2004 8:42:46 AM
Color profile: Generic CMYK printer profile
Composite Default screen
Here are the steps to follow to complete this example:
1. Because we want all the rows from Customers regardless of what is or is
not found in the Orders table, option 2 is the one we seek. Click it to select
it and then click the OK button.
2. In the criteria for the OrderDate column, add OR IS NULL to the entry. If
we fail to do so, we will not see rows in the results for any customers who
have no orders. This is because outer joins set unmatched data to NULL, and
because null values are not greater than 1/1/1998 (and in fact are not greater
than, less than, or equal to anything), the criteria as written in Example 3-9
would eliminate the row we worked so hard to include.
The completed panel and query results are shown in Figure 3-19.
Comparing the query results in Figure 3-19 with the query results in Figure 3-17,
note that there is one more row in Figure 3-19. This is customer FISSA, the one who
has no orders in the Orders table. For this row, the Order Date, Shipped Date, and
Freight columns are null.
An interesting feature of Microsoft Access is that it generates SQL statements for
all database queries. And although Microsoft Access SQL does not conform to
ANSI standards, the ability to try something on the Query Design View panel and
see how that action translates into SQL can be a great learning tool. SQL is carefully
presented in the next chapter; so don’t be intimidated by your first look at it here. To
see the SQL for the Example 3-10 query, click the small downward-pointing arrow
on the toolbar, next to the icon for View, and select the SQL View option from the
drop-down list, as shown in the panel at the top of Figure 3-20. Note that newer
76
Databases Demystified
Figure 3-18 Join Properties dialog box
P:\010Comp\DeMYST\364-9\ch03.vp
Monday, February 09, 2004 8:42:46 AM
Color profile: Generic CMYK printer profile
Composite Default screen
CHAPTER 3 Forms-Based Database Queries
77
Demystified / Databases Demystified / Oppel/ 225364-9 / Chapter 3
versions of Microsoft Access include additional options—PivotTable and
PivotChart—in the drop-down menu. The generated SQL, as shown at the bottom of
Figure 3-20, is displayed. You can even change the generated SQL and see the
changes “reverse engineered” back into the Query Design View panel. This is an
amazing product feature.
Example 3-11: Multiple Joins; Calculated Columns
When we need information from more than two tables in the same query result, we
can simply add more tables, and therefore more join operations, to the query. The
Figure 3-19 Example 3-10, “Outer Joins” (top) and the query results (bottom)
P:\010Comp\DeMYST\364-9\ch03.vp
Monday, February 09, 2004 8:42:47 AM
Color profile: Generic CMYK printer profile
Composite Default screen
78
Databases Demystified
Demystified / Databases Demystified / Oppel/ 225364-9 / Chapter 3
beauty of relational databases is that we need not be concerned with which join is
best processed first and other such implementation details. We can just trust the
RDBMS to make those decisions for us.
Let’s consider another scenario: We want to know the total value in dollars of
items ordered by our U.S. customers. Looking at the tables we have available, we re
-
alize that we need the Customers table, so we can filter by the Country column, and
the Order Details table, because it contains the data we need to calculate the total
Figure 3-20 Selecting the SQL View (top), and the SQL view of Example 3-10
P:\010Comp\DeMYST\364-9\ch03.vp
Monday, February 09, 2004 8:42:47 AM
Color profile: Generic CMYK printer profile
Composite Default screen