Báo cáo khoa học: "Morphological variability of oaks (Quercus robur L, Quercus petraea (Matt) Liebl, Quercus pubescens Willd) in northeastern France: preliminary results" pptx
Bạn đang xem bản rút gọn của tài liệu. Xem và tải ngay bản đầy đủ của tài liệu tại đây (486.12 KB, 6 trang )
Original
article
Morphological
variability
of
oaks
(Quercus
robur
L,
Quercus
petraea
(Matt)
Liebl,
Quercus
pubescens
Willd)
in
northeastern
France:
preliminary
results
JL Dupouey
V Badeau
Laboratoire
de
phytoécologie
forestière,
Centre
de
recherches
forestières,
INRA
Nancy,
54280
Champenoux,
France
Summary —
Morphological
variability
of
oaks
in
Lorraine
(northeastern
France),
was
studied.
Eight
hundred oaks
were
sampled
in
80
stands
covering
a
broad
range
of
ecological
variability;
10
leaves,
fruits
and
current-year
shoots
were
collected
per
tree.
Thirty-four
morphological
variables
were
measured
and
analyzed
by
factorial
correspondance
analysis.
It
is
concluded
that
Q
robur and
Q pe-
traea
are
clearly
separated
with
a
few
morphologically
intermediate
individuals
(3.5%).
Q petraea
is
more
variable
than
Q
robur.
Q
pubescens
and
Q
robur
are
totally
isolated
from
each
other,
while
Q
petraea
and
Q pubescens form
a
continuum.
Many
variables
discriminate
between
these
3
species;
some
of
them
have
been
little
known
prior
to
now
(pilosity,
presence
of
intercalary
ribs).
These
re-
sults
are
compared
with
those
from
other
parts
of
Europe.
taxonomy
/ morphometrics
/ hybridization
/ introgression
/
Quercus
robur / Quercus
petraea /
Quercus
pubescens
Résumé —
Variabilité
morphologique
des
chênes
dans
le
Nord-Est
de
la
France;
résultats
préliminaires.
Nous
avons
étudié
la
différenciation
morphologique
des
chênes
pédonculé,
sessile
et
pubescent
dans
le
Nord-Est
de
la
France.
L’échantillonnage
a
porté
sur
80
populations
provenant
de
stations
représentant
toute
la
gamme
de
variation
des
milieux
de
chênaies
en
Lorraine.
Sur
10
arbres
par
population,
10
feuilles,
infruiescences
et
rameaux
de
l’année
ont
été
prélevés. Trente-
quatre
variables
morphologiques
ont
été
mesurées
et
analysées
par
analyse
factorielle
des
corres-
pondances.
On
observe
une
très
nette
séparation
des
chênes
sessile
et
pédonculé,
avec
seulement
3,5%
d’individus
morphologiquement
intermédiaires,
ainsi
qu’un
isolement
total
du
chêne
pubescent
et
du
chêne
pédonculé.
Par
contre,
les
chênes
sessile
et
pubescent
forment
un
continuum.
Le
chêne
pédonculé
est
moins
variable
que
le
chêne
sessile.
De
nombreuses
variables
discriminent
ces
3
espèces,
dont
certaines
peu
connues
jusqu’alors
(pilosité,
présence
de
nervures
intercalaires).
Ces
résultats
sont
comparés
à
ceux
obtenus
par
ailleurs
en
Europe.
taxonomie
/
morphométrie
/
hybridation
/
introgression
/
Quercus
robur
/
Quercus
petraea
/
Quercus
pubescens
INTRODUCTION
The
distinction
of
species
in
the
Quercus
complex
is
still
a
matter
of
debate.
In
west-
ern
Europe,
several
species
have
been
re-
ported
as
potentially
interbreeding,
the
most
widespread
being
Quercus
robur and
Quercus
petraea.
Until
now,
the
prevalent
opinion
was
in
favor
of
the
common
occur-
rence
of
hybrids
between
the
different
spe-
cies,
producing
many
morphologically
in-
termediate
forms
between
pure
parental
species
due
to
hybridization
and
introgres-
sion.
A
huge
body
of
literature
has
been
published
with
this
thinking
in
mind,
(see
eg,
Kissling,
1983;
Minihan
and
Rushton,
1984,
for
the
most
recent
papers).
Only
a
few recent
studies
(Dupouey,
1983;
Du-
pouey
et
Le
Bouler,
1989;
Dupouey
et
al,
1990;
Grandjean
and
Sigaud,
1987;
Aas,
1990)
have
come
to
different
conclusions.
The
aim
of
this
study
was
to
describe
the
actual
morphological
status
of
Q
robur
and
Q
petraea
at
a
regional
scale
(Lor-
raine
Plain),
including
Q
pubescens.
We
studied
inter-
and
intraspecific
variations,
and
their
link
with
ecological
constraints.
In
this
preliminary
paper,
only
results
on
mor-
phological
differentiation
at
the
interspecif-
ic
level
are
presented.
We
have
tried
to
answer
the
following
questions:
what
is
the
organization
of
morphological
variability
among
the
3
species?
What
is
the
degree
of
isolation
of
each
species?
What
are
the
best
discriminant
morphological
charac-
ters?
MATERIALS
AND
METHODS
Stands
were
selected
from
8
forests
in
the
Lor-
raine
Plain,
and
a
total
of
80
populations
were
sampled
in
order
to
cover
the
whole
ecological
variability
of
oakwoods
in
this
area.
Coppices
with
standards
were
discarded,
as
were
sup-
posed
plantations.
In
each
of
these
populations,
10
dominant
trees
were
marked
at
random.
A
total
of
761
trees
were
sampled
during
summer
1989, 655
of
them
had
produced
fruit
during
this
year.
Twenty
leaves,
fruits
(including
peduncles,
cupules
and
acorns)
and
twigs
of
the
current
growth
year
were
collected.
To
minimize
posi-
tional
variability
within
the
tree
(Blue
and
Jen-
sen,
1988),
leaves
were
collected
from
the
ex-
ternal
part
of
the
canopy
usually
on
the
aspect
facing
south,
and
always
in
the
middle
part
of
the
first
flush
shoot.
Ten
of
these
20
samples
were
chosen
at
random
for
measurements,
after
the
elimination
of
broken,
incomplete
or
dam-
aged
units.
Eighty
variables
were
measured
or
calculated.
These
variables
concern
many
as-
pects
of
foliar
and
fruit
morphology:
size,
overall
shape,
color,
pilosity
on
various
parts
of
leaves
or
fruits
(measured
as
in
Grandjean
and
Sigaud,
1987),
shape
of
some
details
(lobes,
auricles
at
the
lamina
base).
These
data
were
acquired
with
a
digitizing
tablet
hooked
up
to
a
microcom-
puter.
Several
features
were
obtained
from
dis-
tances
and
angles
between
different
landmarks
along
the
outline
of
the
leaf.
Data
were
analyzed
mainly
by
factorial
corre-
spondence
analysis
using
the
SPAD.N
statisti-
cal
package
(Lebart
et
al,
1988).
In
the
first
stage
of
the
analysis,
the
study
of
correlation
co-
efficients
between
all
pairs
of
the
80
initial
vari-
ables
allowed
the
elimination
of
46
redundant
variables.
The
comparison
between
results
with
or
without
fruit
morphological
characters
showed
no
significant
differences
so
only
a
subset
of
29
parameters
describing
leaves
and
shoots
was
used
for
subsequent
analysis.
This
allowed
the
use
of
the
whole
set
of
trees
instead
of
only
those
which
had
fruited
during
the
sampling
year.
Fruit
variables
were
used
as
supplemen-
tary
characters.
Variables
were
ranked
by
decreasing
power
of
discrimination
according
to
their
F value
in
an
unbalanced
analysis
of
variance
between
the
3
species.
Bonferroni
t-tests
of
difference
between
means
for
each
species
were
performed.
Dis-
criminant
analysis
was
used
to
calculate
a
func-
tion
for
species
recognition.
RESULTS
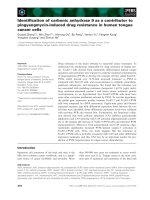
Figure
1
shows
the
projection
of
trees
into
the
space
of
axes,
1,
2
and
3
of
the
factori-
al
analysis.
One
can
observe
3
poles
of
distribution
for
these
individuals.
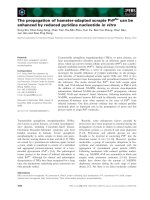
Table
I
gives
the
mean
values
of
the
most
discrim-
inant
variables
for
each
pole.
At
the
right-hand
side
of
the
first
axis,
the
leaves
are
shortly
petiolated,
with
well-
developed
auricles
at
the
base
of
the
lamina.
The
maximum
width
of
leaves
is
located
in
the
upper
part
of
the
lamina.
Lobe
sinuses
are
irrigated
by
numerous
in-
tercalary
veins.
Fruits
have
a
long
and
thin
peduncle.
Pilosity
is
absent,
very
short
on
all
parts.
This
group
of
individuals
repre-
sents
the
typical
Q
robur.
At
the
left
end
of
the
first
axis,
and
at
the
upper
part
of
axis
2,
leaves
have
a
long
petiole.
The
maximum
width
is
at
the
middle
of
the
lamina.
Fruits
are
shortly
pe-
dunculate
and
pilosity
is
medium
to
dense.
this
pole
is
composed
of
Q petraea
trees.
The
last
pole
is
also
located
on
the
left-
hand
side
of
the
first
axis,
in
the
lower
part
of
axis
2.
It
is
composed
of
trees
with
leaves
rather
similar
to
those
of
the
previ-
ous
one.
Lobes
are
sharper,
often
accom-
panied by
lobules
(lobes
irrigated
by
nerves
of
the
third
order).
The
pilosity
is
more
highly developed,
both
in
terms
of
density
and
length.
This
group
can
be
identified
as
Q
pubescens.
Thus
we
find,
with
this
analysis,
that
the
3
species
have
different
morphological
poles,
and
also
that
these 3
species
differ
widely
in
their
degree
of
separation
from
one
another.
The
Q
robur
cluster
is
com-
pletely
separated
from
that
of
Q
pubes-
cens,
and
only
a
few
morphologically
inter-
mediate
individuals
are
found
between
Q
robur
and
Q
petraea
(3.5%
of
the
total
number
of
trees).
On
the other
hand,
Q
petraea
and
Q
pu-
bescens
form
a
continuum
without
any
clear
distinction
between
the
2
species.
A
number
of
morphologically
intermediate
in-
dividuals
occurs.
Consequently,
Q
petraea
and
Q
pubescens
exhibit
much
more
intra-
specific
morphological
variabililty
than
Q
robur,
which
appears
to
be
more
homoge-
neous.
Table
I gives
the
variables
by
decreas-
ing
power
of
discrimination
between
the
species.
The
best
discriminant
parameters
are
pilosity
(density
and
length
of
pilosity
on
nerves,
petiole
and
lamina),
number
and
length
of
intercalary
veins,
length
of
the
petiole
and
of
the
peduncle.
Some
classical
features
only
appear
after
these
variables,
such
as
the
development
of
an
auricle
at
the
lamina
base.
Length
of
the
petiole
and
number
of
in-
ercalary
veins
are
sufficient
to
separate
the
2
species
Q
robur
an
Q
petraea
with
99%
success
rate.
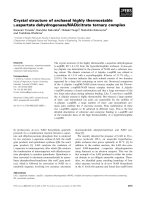
The
discriminant
function
for
tree
recognition
is:
where,
nint.
number
of
intercalary
veins
(mean
of
10
leaves
per
tree);
lpet:
length
of
petiole
in
mm
(mean
of
10
leaves
per
tree);
I
species
index;
positive
for
Q
robur
and
negative
for
Q
petraea.
Values
be-
tween
-1000
and
+1000
indicate
an
inter-
mediate
tree.
DISCUSSION
AND
CONCLUSION
These
results
are
different
from
those
re-
ported
in
a
number
of
previous
publica-
tions:
Carlisle
and
Brown
(1965),
Wigston
(1974),
Olsson
in
Sweden
(1975
a,b)
Rushton
(1978,
1979,
1983),
Minihan
and
Rushton
(1984)
in
the
United
Kingdom
and
Kissling
(1980a,b,
1983)
in
Switzerland,
all
concluded
that
there
was
extensive
hybrid-
ization
between
Q
robur
and
Q
petraea.
Conversely,
the
authors
of
some
more
re-
cent
studies
reached
the
same
conclu-
sions
we
did:
Grandjean
and
Sigaud
(1987)
in
France
(including
Q pubescens),
letswaart
and
Feij
(1989)
in
The
Nether-
lands;
Aas
(1990)
in
Germany.
It
is
difficult
to
compare
these
results
be-
cause
they
are
based
on
different
sample
sizes,
sampling
regimes,
characters
and
with
different
companion
species.
But
sev-
eral
hypotheses
could
be
advanced
to
ex-
plain
the
discrepancies.
One
possible
ex-
planation
is
that
the
extent
of
hybridization
differs
in
the
different
parts
of
the
distribu-
tion
range
of
the
species.
Peripheral
situa-
tions
would
be
more
favorable
to
hybridiza-
tion
than
in
the
inner
part.
This
could
account
for
results
from
Sweden
or
the
United
Kingdom,
but
not
those
from
Swit-
zerland.
More
probably,
one
must
look
to
the
differences
in
the
statistical
approach-
es
used
for
data
analysis.
All
previous
studies
concluding
that
numerous
hybrids
which
were
present
were
based
on
statisti-
cal
methods
according
to
which
the
limits
of
each
species
are
defined
before
the
analysis.
The
main
methods
used
in
these
cases
were
hybridity
indices
for
which
you
had
to
choose
subjectively
the
range
of
each
species
for
all
the
variables
before
calculation,
principal
components
analysis
(PCA)
using
’pure’
stands
as
references
and
discriminant
function
analysis.
On
the
other
hand,
purely
descriptive
methods,
such
as
factorial
correspondence
analysis
(or
principal
components
without
reference
populations)
do
not
require
the
definition
of
the
species
before
the
analysis.
They
can
be
regarded
just
as a
means
of
looking
at
the
raw
data
from
a
particular
point
of
view
(the
one
with
maximum
variance
ex-
plained).
Factorial
correspondence
analysis
is
preferable
to
PCA
(even
when
a
’reference
population’
is
not
used)
because
it
is
able
to
deal
with
non-linear
relationships
be-
tween
characters,
whereas
PCA
only
measures
linear
correlation
coefficients.
The
frequency
of
hybrids
between
Q
pu-
bescens
and
Q
petraea
has
been
under-
lined
by
other
authors.
Semerikov
et
al,
(1988),
studying
populations
from
Dage-
stan
(Russia),
even
conclude
that
such
hy-
brids
represent
a
unique
species
complex.
This
lack
of
isolation
could
explain
the
greater
variability
observed
in
Q
petraea
versus
Q
robur.
Variables
used
in
previous
taxonomic
studies
were
not
always
the
most
highly
discriminating
ones,
and
sometimes
not
discriminant
at
all.
The
best
features,
in
our
sample,
are
intercalary
veins
and
pilos-
ity
development.
Further studies
in
progress
are
explor-
ing
the
persistence
of
these
discriminant
characters
under
homogeneous
growing
conditions
(nursery)
for
the
populations
un-
der
consideration.
Also,
the
structure
of
the
intraspecific
variability
along
ecological
clines
is
of
major
importance.
Finally,
there
is
a
need
for
standardization
of
the
statisti-
cal
methods
used
for
the
analysis
of
mor-
phological
variability
in
the
different
parts
of
the
range
of
distribution
of
these
spe-
cies.
ACKNOWLEDGMENTS
We
gratefully
acknowledge
the
technical
assis-
tance
of
Gilles
Doucet
during
the
collection
of
leaves.
We
also
thank
Patrick
Behr
for
meas-
urements
of
fruits
and
Hervé
Cochard
for
3D
graphics.
Support
for
this
project
was
provided
by
the
EEC
(Research
action
Programme
MA1B:
Genetics
and
Breeding
of
Oaks).
REFERENCES
Aas
G
(1990)
Kreuzbarkeit
und
Unterscheidung
von
Stiel-und
Traubeneiche.
Allg
Forstztg
9-
10, 219-221
Blue
MP,
Jensen
RJ
(1988)
Positional
and
sea-
sonal
variation
in
oak
(Quercus,
Fagaceae)
leaf
morphology.
Am
J
Bot 75,
939-947
Carlisle
A,
Brown
HF
(1965)
The
assessment
of
the
taxonomic
status
of
mixed
oak
popula-
tions
(Quercus sp).
Watsonia 6,
120-127
Dupouey
JL
(1983)
Analyse
multivariable
de
quelques
caractères
morphologiques
de
pop-
ulations
de chênes
(Quercus
petraea
(Matt)
Liebl
et
Quercus
robur
L)
du
Hurepoix.
Ann
Sci For
40,
265-282
Dupouey
JL,
Le
Bouler
H
(1989)
Discrimination
morphologique
des
glands
de
chênes
ses-
sile
(Quercus
petraea
(Matt)
Liebl)
et
pe-
donculé
(Quercus
robur
L).
Ann
Sci
For
46,
187-194
Dupouey
JL,
Fougère
V,
Kremer
A
(1990)
Vari-
abilité
génétique
des
chênes
sessile
et
pé-
donculé.
Rev
For
Fr42,
198-203
Grandjean
G,
Sigaud
P
(1987)
Contribution
à
la
taxonomie
et
à
l’écologie
des
chênes
du
Ber-
ry.
Ann
Sci
For
44,
35-66
letswaart
JH,
Feij
AE
(1989)
A
multivariate
anal-
ysis
of
introgression
between
Quercus
robur
and
Quercus
petraea
in
The
Netherlands.
Acta
Bot
Neerl 38,
313-325
Kissling
P
(1980a)
Un
réseau
de
corrélations
en-
tre
les
chênes
(Quercus)
du
Jura.
Ber
Schweiz
Bot
Ges
90, 1-28
Kissling
P
(1980b)
Clef
de
détermination
des
chênes
médioeuropéens
(Quercus
L).
Ber
Schweiz
Bot
Ges
90,
29-44
Kissling
P
(1983)
Les
chênaies
du
Jura
central
suisse.
Thesis,
Université
de
Lausanne,
Swit-
zerland,
400
p
Lebart
L,
Morineau
A,
Lambert
T
(1988)
SPAD.N:
Système
Portable
Pour
l’Analyse
des
Données.
Version
1.2:
Manuel
de
Référ-
ence.
CISIA,
Paris,
306
pp
Minihan
VB,
Rushton
BS
(1984)
The
taxonomic
status
of
oaks
(Quercus
ssp)
in
Breen
Wood,
Co
Antrim,
Northern
Ireland.
Watsonia
15,
27-32
Olsson
U
(1975a)
A
morphological
analysis
of
phenotypes
in
populations
of
Quercus
(Faga-
ceae)
in
Sweden.
Bot
Not
128, 55-68
Olsson
U
(1975b)
On
the
size
and
microstruc-
ture
of
pollen
grains
of
Quercus
robur
and
Quercus
petraea.
Bot
Not
128,
256-264
Rushton
BS
(1978)
Quercus
robur
L
and
Quer-
cus
petraea
(Matt)
Liebl:
a
multivariate
ap-
proach
to
the
hybrid
problem.
1.
Data
acqui-
sition,
analysis
and
interpretation.
Watsonia
12, 81-101
Rushton
BS
(1979)
Quercus
robur
L
and
Quer-
cus
petraea
(Matt)
Liebl:
a
multivariate
ap-
proach
to
the
hybrid
problem.
2.
The
geo-
graphical
distribution
of
population
types.
Watsonia
12,
209-224
Rushton
BS
(1983)
An
analysis
of
variation
of
leaf
characters
in
Quercus
robur
L
and
Quer-
cus
petraea
(Matt)
Liebl
population
samples
from
Northern
Ireland.
Ir For 40,
52-77
Semerikov
LF,
Glotov
NV,
Zhivotovskii
LA
(1988)
Example
of
effectiveness
of
analysis
of
the
generalized
variance
of
traits
in
trees.
Sov J Ecol 18,
140-143
Wigston
DL
(1974)
Cytology
and
genetics
of
oaks.
In:
The
British
Oak
(Morris
MG,
Perring
FH,
eds).
Bot
Soc
Br
Isles,
London,
27-50