Báo cáo khoa học: "Site-specific height curves for white spruce (Picea glauca [Moench] Voss) stands based on stem analysis and site classification" potx
Bạn đang xem bản rút gọn của tài liệu. Xem và tải ngay bản đầy đủ của tài liệu tại đây (650.3 KB, 12 trang )
Original
article
Site-specific
height
curves
for
white
spruce
(Picea
glauca
[Moench]
Voss)
stands
based
on
stem
analysis
and
site
classification
GG Wang
K
Klinka
1
Department
of Biology,
University
of
Winnipeg,
515
Portage
Avenue,
Winnipeg,
MB,
Canada
R3B
2E9;
2
Department
of
Forest
Sciences,
University
of
British
Columbia,
Vancouver,
BC,
Canada
V6T
1Z4
(Received
2
January
1994;
accepted
15
May
1995)
Summary —
Polymorphic
height
curves
have
been
widely
used
to
predict
dominant
stand
height
from
site
index
or
any
known
pair
of
height
and
age.
To
provide
an
alternative
to
this
conventional
approach,
height
modelling
was
linked
to
site
classification
using
stem
analysis
and
site
data
obtained
from
102
naturally
established
white
spruce
(Picea
glauca
[Moench]
Voss)
stands
in
the
Sub-Boreal
Spruce
zone
of
British
Columbia.
The
study
stands
were
stratified
according
to
their
soil
moisture,
aeration
and
nutrient
regimes,
and
a
site-specific
height
curve
was
developed
for
each
of
the
7
delin-
eated
groups
without
using
site
index
as
a
predictor.
Although
less
precise,
the
curves
developed
were
comparable
to
the
conventional
height
curves
that
use
site
index
as
a
predictor.
Testing
against
independent
data
indicated
that
the
site-specific
height
curves
were
reliable
and
applicable
over
a
large
area
of
the
sub-boreal
forest
for
predicting
dominant
heights
of
white
spruce
stands.
Picea glauca
I
height
curve
/ site-specific
height
curve
/ site
classification
Résumé —
Courbe
de
croissance
en
hauteur
de
l’épinette
blanche
(Picea
glauca
[Moench]
Voss)
par
l’utilisation
de
données
d’analyse
de
tige
et
de
typologie
des
stations.
L’utilisation
de
courbes
polymorphes
de
croissance
en
hauteur
est
très
courante
pour prédire
la
hauteur
dominante
d’un
peuplement
connaissant
un
indice
de
fertilité
ou
un
couple
hauteur-âge.
Nous
proposons
une
alter-
native
à
cette
méthode
en
reliant
directement
un
modèle
de
croissance
en
hauteur
aux
conditions
de
station,
par l’utilisation
de
données
d’analyse
de
tige
et de
typologie
des
stations
dans
102 placettes
de
peuplements
naturels
d’épinette
blanche
(Picea
glauca
(Moench]
Voss)
en
région
sub-boréale
de
Colombie
britannique.
Les
peuplements
choisis
ont
été
stratifiés
selon
le
régime
hydrique
du
sol,
la
com-
pacité,
la
qualité
nutritive,
et
des
courbes
de
croissance
spécifiques
ont
été
construites
pour
chacun
des
7
groupes
sans
utiliser l’indice
de
fertilité
comme
paramètre.
Bien
que
moins
précises,
les
courbes
obtenues
sont
comparables
aux
courbes
plus
conventionnelles
qui
utilisent
l’indice
de
fertilité
comme
paramètre.
La
liaison
entre
les
types
de
station
et les
courbes
est
significative,
comme
le
montre
un
essai
où
cette
hypothèse
a
été
testée
comme
l’indépendance
entre
les
courbes
et
les
types
de
station.
Ce
modèle
est
applicable
dans
une
grande
partie
de
la
forêt
sub-boréale
pour
prédire
la
hauteur
dominante
des
peuplements
d’épinette
blanche.
Picea
glauca
/ courbe
de
croissance
en
hauteur / courbe
de
croissance
dépendant
de
la
station
/
typologie
des
stations
INTRODUCTION
Forest
management
for
sustained
timber
production
requires
accurate
information
on
forest
growth
and
yield.
For
this
purpose,
various
forest
growth
and
yield
models
have
been
developed
(eg
Clutter
et
al,
1983;
Davis
and
Johnson,
1987).
Traditionally,
these
models
are
based
on
’historical
bioas-
says’ and,
therefore,
are
empirical
models.
Empirical
models
have
been
used
over
the
past
several
decades,
and
are
essentially
the
only
type
used
in
western
North
Amer-
ica.
As
long
as
the
future
growth
conditions
remain
similar
to
the
past,
the
use
of
these
models
will
continue
to
be
justified
(Kim-
mins,
1985;
Kimmins
et al,
1990).
However,
some
possible
changes
in
environmental
conditions
may
likely
result
in
a
situation
in
which
growth
conditions
are
no
longer
treated
as
immutable.
Thus,
concerns
about
the
validity
of
empirical
models
in
predict-
ing
future
growth
and
yield
led
to
the
devel-
opment
of
mechanistic
models
(eg
Agren
and Axelsson,
1980;
Shugart,
1984;
Bossel,
1986;
Running
and
Coughlan,
1988).
Mech-
anistic
models
may
be
superior
to
empiri-
cal
models
under
a
changing
environment
(Landsberg,
1986;
Bossel,
1991),
but
many
authors
argue
that
more
effort
is
needed
for
existing
mechanistic
models
to
match
the
precision
of
the
empirical
models
calibrated
from
forest-wide
inventory
and
growth
plot
data
bases
(Leech, 1984;
Rayner
and
Turner,
1990).
Among
various
types
of
growth
and
yield
models,
height
modelling
received
consid-
erable
research
attention.
Height
of
domi-
nant
trees
in
even-aged
stands
has
been
accepted
as
a
measure
of
forest
productiv-
ity,
and
used
as
a
’driving’
variable
in
many
models
(Wykoff
and
Monserud,
1987).
Con-
ventional
height
models
require
site
index
as
an
independent
variable
for
predicting
height;
site
index
is,
in
turn,
estimated
from
site
index
curves
or
tables
(developed
through
’historical
bioassay’)
using
a
known
pair
of
age
and
height.
Changes
in
envi-
ronment
(ie
changes
in
the
ecological
qual-
ity
of
forest
sites)
would
not
be
accounted
for
by
empirical
models
unless
these
environ-
mental
variables
were
explicitly
included
in
the
models.
Replacing
site
index
in
empiri-
cal
models
with
site
descriptors
(ecological
variables)
has
been
suggested
to
accom-
modate
the
changes
in
environment
(West,
1990).
Direct
incorporation
of
quantitative
envi-
ronmental
variables
in
height
models
is
presently
limited
by
the
resolution
(time
and
spatial
scale)
and
the
nature
of
available
climatic
and
edaphic
data
(Nautiyal
and
Cuoto,
1984;
Rayner and
Turner,
1990).
Consequently,
alternative
site
describers,
such
as
those
derived
from
site
classifica-
tion,
have
received
considerable
attention
(eg Green
et al,
1989;
Inions,
1990;
Inions
et
al,
1990;
Klinka
and
Carter,
1990).
The
primary
objective
of this
study
was
to
establish
a
link
between
height
modelling
and
site
classification,
a
part
of
a
larger
study
carried
out
by
Wang
(1993).
Consid-
ering
the
usefulness
of
site
classification
in
delineating
ecologically
equivalent
sites
and
in
addressing
relationships
between
site
index
and
measures
of
ecological
site
qual-
ity
for
several
tree
species
of
British
Columbia
(eg
Green
et al,
1989;
Klinka
and
Carter,
1990;
Wang
et al,
1994),
it
would
seem
possible,
using
the
framework
of
site
classification,
to
develop
height
models
in
which
site
index
is
replaced
by
measures
of
ecological
site
quality.
Study
stands
were
stratified
into
site
groups
according
to
their
ecological
site
quality
in
supporting
white
spruce
height
growth,
and
site-specific
height
curves
for
predicting
dominant
height
were
developed
for
the
delineated
site
groups.
To
evaluate
the
performance
of
the
curves,
conventional
height
curves
were
also
developed
using
stem
analysis
data.
Independent
data
were
then
used
to
test
the
site-specific
curves
for
their
reliability
and
portability.
MATERIALS
AND
METHODS
The
study
area
occupied
the
central
and
southern
portions
of
the
Sub-Boreal
Spruce
(SBS)
bio-
geoclimatic
zone,
extending
from
approximately
52°30’
to
54°18’
N
latitude
and
from
122°0’
to
125°54’
W
longitude.
Using
the
maps
obtained
from
the
British
Columbia
Forest
Service,
102
stands
were
located
into
6
biogeoclimatic
sub-
zones
or
variants:
1)
Horsefly
Dry
Warm
SBS
variant
(SBSdw1
), 2)
Stuart
Dry
Warm
SBS
vari-
ant
(SBSdw3),
3)
Dry
Cool
SBS
subzone
(SBSdk),
4)
Moist
Warm
SBS
subzone
(SBSmw),
5)
Moist
Cool
SBS
subzone
(SBSmk)
and
6)
Wet
Cool
SBS
subzone
(SBSwk)
(Meidinger
and
Pojar,
1991).
Each
biogeoclimatic
unit
was
selected
to
represent
a
segment
of
a
regional
climatic
gradi-
ent.
Within
each
unit,
study
stands
were
selected
to
represent
the
widest
possible
range
of
soil
mois-
ture
and
nutrients
for
white
spruce
growth
(table
I).
Only
naturally
regenerated,
fully
stocked,
unmanaged
and
even-aged
white
spruce-domi-
nated stands
without
a
visible
history
of
damage
were
chosen
for
the
study.
In
each
stand,
a
20
x
20
m
(0.04
ha)
sample
plot
was
located
to
rep-
resent
an
individual
ecosystem
relatively
uniform
in
topography,
soil
and
vegetation
characteris-
tics.
The
site
quality
of
each
study
stand
was
deter-
mined
by
characterizing
its
soil
moisture,
aera-
tion
and
nutrient
regimes
(SMRs,
SARs
and
SNRs,
respectively).
Seven
SMRs
were
differen-
tiated
according
to
actual/potential
evapotranspi-
ration
ratio
and
the
depth
to
a
ground-water
table,
a
gleyed
layer
or
prominent
mottling;
3
SARs
according
to
soil
water
saturation,
soil
texture
and
slope
and
5
SNRs
according
to
soil
mineralizable
N and
C/N
(Wang,
1993).
Based
on
the
SMR,
SAR
and
SNR
determined
for
each
stand,
study
stands
were
stratified
into
7
site
groups:
C,
F,
G,
I,
J,
K
and
L
as
delineated
and
labelled
by
Wang
(1993).
Each
site
group
represents
a
group
of
sites
with
similar
soil
moisture,
aeration
and
nutri-
ent
conditions
as
well
as
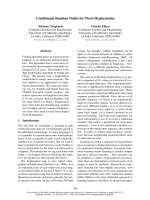
white
spruce
site
index
(fig
1).
A
more
detailed
account
of
SMRs,
SARs
SNRs
and
site
classification
is
given
by
Wang
(1993).
On
each
plot,
3
dominant
trees,
with
the
largest
diameter
at
breast
height,
were
felled for
stem
analysis.
Their
total
heights
were
measured
in
the
field.
Stem
discs
were
cut
at
0.3,
0.6
and
1.3
m
above
the
ground
surface,
and
then
were
taken
at
1
m
intervals
between
1.3 m
and
the
top
of
each
tree.
On
each
disc,
rings
were
counted.
If
necessary,
ring
counting
was
assisted
by
a
micro-
scope.
Height/age
data
obtained
from
stem
analysis
can
be
biased
if
the
height
of
the
cross-cut
is
taken
as
the
tree
height
for
the
given
age,
because
of
the
presence
of
a
"hidden
tip"
above
the
cross-cut
(Carmean,
1972).
Dyer
and
Bailey
(1987)
compared
6
published
algorithms
for
esti-
mating
the
true
height
within
a
section
and
con-
cluded
that
Carmean’s
(1972)
method
was
the
best.
Therefore,
the
raw
stem
analysis
data
were
adjusted
using
Carmean’s
(1972)
algorithm
to
calculate
tree
height
corresponding
to
the
age
at
each
cross-cut.
Plots
of
height
versus
age
were
examined
for
each
site
tree.
If
growth
suppres-
sion
was
apparent,
data
from
that
site
tree
was
deleted
or
truncated.
In
consequence,
6
trees
were
deleted,
and
the
remaining
300
site
trees
were
used
in
further
analyses.
An
average
height
growth
curve
was
deter-
mined
for
each
plot
from
the
individual
tree
stem
analysis
data
using
Richards’
(1959)
3-parameter
model:
where
H
is
height
(m), A
is
age
(years)
at
breast
height,
e
is
the
base
of
the
natural
logarithm,
and
b1,
b2
and
b3
are
parameters
to
be
estimated
for
each
stand.
Within-plot
standard
errors
of
estimates
for
model
[1]
averaged
0.79
m,
with
a
standard
devi-
ation
of
0.28
m.
The
model
was
evaluated
for
each
stand
at
every
decade
from
age
10
years
to
the
decadal
age
nearest
the
age
of
the
oldest
tree
in
that
stand
to
provide
the
data
base used
for
constructing
height
growth
curves.
All
the
height-age
pairs
over
100
years
of
breast
height-
age
(bha)
were
excluded
from
height
modelling,
as
average
site
index
plotted
against
age
showed
a
significant
decline
beyond
the
bha
of
100
years.
Site
index
of
each
stand
was
determined
from
the
model
by
setting
bha
to
50
years.
As
a
result,
672
decadal
observations
of
height,
age
and
site
index
for
102
stands
were
produced.
Of
these,
596
observations
from
82
stands
with
bha
greater
than
50
years
were
used
to
develop
height
mod-
els
which
required
site
index
as
a
predictor.
For
the
models
without
site
index,
all
672
observa-
tions
from
the
102
stands
were
used
to
calibrate
the
model
coefficients.
Site-specific
height
curves
were
developed
by
fitting
Richards’
model
(eq
[1])
to
the
data
of
each
site
group.
Site
index
was
not
used
as
a
predictor,
but
it
was
implicitly
expressed
in
the
modelling
by
site
group.
The
effect
of
ecological
site
quality
on
white
spruce
height
growth
was
indicated
by
different
model
coefficients
calibrated
from
data
of
different
site
groups.
The
delineated
site-specific
curves
were
compared
to
conven-
tional
height
curves
in
terms
of
their
precision
to
predict
dominant
height
of
white
spruce
stands.
Conventional
height
curves
were
developed
by
fitting
a
conditioned
logistic
model
(eq
[2])
to
the
data
of
this
study:
where
Sl
is
site
index
(m
at
50
years
of
bha);
H,
A
and
e
are
as
previously
defined
in
eq
[1]
and
bl,
b2
and
b3
are
model
coefficients.
It
was
appro-
priate
to
select
this
model
for
assessing
the
per-
formance
of
site-specific
height
curves
as
the
same
model
was
employed
by
Goudie
and
Mitchell
(1986)
to
develop
white
spruce
height
curves
for
interior
British
Columbia
and
Alberta.
The
applicability
of
the
developed
site-spe-
cific
height
curves
was
evaluated
by
testing
the
curves
against
independent
data
obtained
from
Wang
et
al
(1994).
As
they
did
not
determine
soil
aeration
regime,
only
the
study
stands
with
mod-
erately
dry,
slightly
dry,
fresh
and
moist
SMRs
(all
likely
with
adequate
aeration)
were
used
in
the
testing.
SYSTAT
(Version
5.0)
statistical
package
(Wilkinson,
1990a,
b)
was
applied
to
statistical
analysis
and
graphics.
Derivative-free
Quasi-
Newton
methods
(Greene,
1990;
Wilkinson,
1990b)
were
adopted
to
compute
the
least
squares
estimation
of
the
parameters
for
all
the
nonlinear
regression
models.
The
R2
reported
for
the
nonlinear
model
was
the
corrected
R2
(Wilkinson,
1990b),
calculated
as:
where
y
is
the
mean
of
the
dependent
variable
and
ei
and
yi
are
the
residual
and
the
measure
of
the
dependent
variable
for i
th
observation,
respectively.
Although
the
R2
of
a
nonlinear
regression
model
is
no
longer
guaranteed
to
be
in
the
range
of
0
to
1,
it
does
provide
a
useful
descriptive
measure
of
the
fit
of
the
regression
(Greene,
1990).
RESULTS
The
b
coefficients,
R2
and
standard
error
of
estimates
(SEE)
of
the
developed
site-spe-
cific
curves
are
given
in
table
II.
Coefficient
b1,
which
was
highly
correlated
with
the
mean
site
index
of
each
site
group
(r=
0.92),
represents
the
average
asymptotic
value
of
each
site
group.
As
expected,
the
highest
values
were
found
for
site
groups
G
and
I
(sites
with
sufficient
soil
water,
aeration
and
nutrients),
and
the lowest
value
for
site
group
L
(sites
with
deficient
aeration
and
nutri-
ents).
The
shape
of
the
average
curve
for
each
site
group
was
also
different,
as
indi-
cated
by
coefficients
b2
and
b3
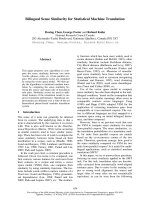
(table
II;
fig
2).
These
coefficients
represent
the
aver-
age
trend
of
height
over
age
development
(ie
the
average
height
growth
pattern
in
each
site
group).
Height
curves
for
site
groups
F,
G
and
I
were
very
close
to
each
other
before
age
20
years,
but
spread
afterward.
The
height
curve
for
the
site
group
G
was
consistently
above
any
of
the
other
curves
up
to
100
years.
This
suggested
that
the
best
growth
of
white
spruce
occurs
on
slightly
dry
to
moist,
adequately
aerated
and
rich
to
very
rich
sites.
Height
curves
for
site
groups
F
and
I were
nearly
identical
up
to
60
years.
After
this,
the
height
growth
in
site
group
I surpassed
that
in
site
group
F,
and
approximated
the
height
growth
on
site
group
G
after
100
years.
Height
curves
for
site
groups
C
and
J
intersected
twice
(approximately
at
15
and
70
years).
Before
the
first
and
after
the
second
intersections,
height
growth
of
the
stands
in
site
group
C
was
superior
to
those
in
site
group
J.
Although
it
was
consistently
lower,
the
height
curve
for
site
group
K
paralleled
that of
site
group
C
despite
contrasting
soil
moisture
regimes
between
the
site
groups
(water
deficit
for
site
group
C
versus
water
saturation
for
site
group
K).
Height
growth
in
site
group
L
was
the
lowest
among
all
the
site
groups
due
to
deficient
aeration
caused
by
a
stagnant
and
high
ground
water
table.
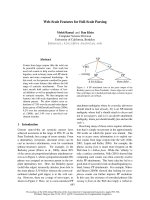
Similar
trends
among
site
groups
were
found
when
the
differential
forms
of
the
site-
specific
height
curves
were
plotted
(fig
3).
Until
approximately
25
years
of
bha,
the
maximum
annual
height
increment
decreased
in
order
of
site
groups:
G>F>I>J>C>K>L.
After
this
age,
several
shifts
occurred.
For
example,
the
increment
of
the
stands
in
site
group
I increased
and,
surpassed
that
in
other
site
groups
after
60
years.
Similarly,
after
about
50 and
70
years,
the
increment
of
the
stands
in
site
groups
C
and
K
surpassed
those
in
site
groups
J
and
F,
respectively.
Site
group
L
maintained
the
lowest
height
growth
rate
until
about
80
years,
but
afterward
the
rate
increased
and
surpassed
that
in
site
group
J.
Basic
statistics
for
the
site-specific
height
curves
and
the
results
of
testing
against
independent
data
are
given
in
table
III.
Although
some
minor
biases
were
found
and
the
average
errors
were
slightly
higher
than
those
obtained
from
the
nonindepen-
dent
tests,
the
relative
errors
were
compa-
rable
for
each
or
all
tested
groups.
Consid-
ering
that
the
study
stands
of
Wang
et
al
(1994)
were
assigned
into
site
groups
on
the
basis
of
field
estimates
of
SMRs
and
SNRs,
better
results
from
the
independent
test
were
not
expected.
The
conditioned
logistic
model
(eq
[2])
was
calibrated,
and
is
presented
in
table
IV.
Considering
all
study
stands,
no
significant
biases
were
found
in
the
2
types
of
height
curves
(table
V).
The
precision
of
the
con-
ventional
curves
was
slightly
higher
than
that
of
site-specific
curves
in
terms
of
the
mean
and
relative
error
of
height
prediction.
This
was
expected
as
site
index
was
replaced
by
site
group
in
site-specific
models.
Site
index
within
any
site
group
was
not
a
point
mea-
sure,
but
rather
a
range
measure.
Similar
results
were
also
found
when
pre-
diction
precision
was
compared
between
the
2
types
of
height
curves
for
each
site
group.
Except
for
site
group
I,
the
conven-
tional
curves
were
more
precise
in
height
prediction
than
site-specific
curves.
Although
the
site-specific
height
curves
yielded
a
somewhat
less
precise
prediction
compared
to
the
conventional
height
curves,
the
aver-
age
error
of
0.93
m
and
the
relative
error
of
6.5%
are
considered
operationally
accept-
able.
DISCUSSION
If
site
classification
is
based
on
growth-lim-
iting
factors
(eg climate,
moisture,
aeration
and
nutrients),
the
resulting
classes
can
be
expected
to
represent
sites
with
similar
pro-
ductivity
potentials.
Site
groups
delineated
according
to
these
factors
made
it
possible
to
develop
site-specific
height
curves
based
on
site
classification
instead
of
conventional
height
curves
based
on
site
index.
Unlike
the
conventional
modelling
that
expresses
height
as
a
function
of
age
and
site
index,
the
site-specific
modelling
used
in
this
study
expresses
height
as
a
function
of
age
and
site
groups.
The
replacement
of
site
index
with
site
group
supported
the
assumption
that
the
effect of
site
can
be
adequately
rep-
resented
in
growth
models
without
using
site
index
(Wykoff
and
Monserud,
1987).
This
gave
evidence
that
site
classification
provides
a
useful
framework
for
the
study
and
prediction
of
forest
productivity.
Site-specific
curves
have
several
advan-
tages
over
conventional
height
curves.
First,
height
at
any
age
could
be
predicted
without
using
any
stand
information.
This
unique
feature
of
site-specific
height
curves
could
be
very
important
since
they
can
be
used
to
estimate
dominant
height
of
white
spruce
stands
even
if
a
site
is
occupied
by
1)
crop
stands
without
suitable
site
trees,
2)
non-
crop
stands
or
3)
nonforest
communities.
Second,
variation
in
height
growth
pattern,
either
due
to
site
index
and/or
site
factors,
is
implicitly
included
in
the
curves.
As
the
height
growth
pattern
of
2
stands
with
the
same
site
index
could
be
significantly
dif-
ferent
(eg Carmean,
1956,
1972;
Zahner,
1962;
Newsberry and
Pienaar,
1978;
Pfister
et al,
1979;
Monserud,
1984),
this
variation
may
not
be
accounted
for
by
conventional
(polymorphic)
height
curves
that
assume
that
site
index
determines
the
height
growth
pattern
of
a
stand.
Third,
impact
of
envi-
ronmental
changes
on
the
future
height
growth
could
be
accounted
for
if
the
effect
of
these
changes
on
ecological
site
quality
can
be
predicted.
Given
the
fact
that
site
productivity
is
a
result
of
the
integrated
effects
of
many
envi-
ronmental
factors
and
given
the
potential
for
organizing
information
and
integrating
the
influences
of
a
large
number
of
inter-
acting
variables
using
models,
growth
and
yield
modelling
seems
to
have
a
useful
role
within
the
framework
of
site
classification.
However,
growth
and
yield
and
site
classi-
fication
studies
have
rarely
been
coordi-
nated
(Crow
and
Rauscher,
1984),
possi-
bly
due
to
lack
of
joint
efforts
by
biometricians
and
forest
ecologists.
The
result
is
a
growth
model
that
cannot
be
eas-
ily
adapted
to
a
site
classification
or
a
site
classification
that
has
not
been
demon-
strated
to
be
highly
correlated
with
produc-
tivity.
To
solve
this
problem,
this
study
linked
height
modelling
with
site
classification.
Unlike
previous
studies
that
used
both
site
unit
and
site
index
in
developing
height
curves
(eg Carmean,
1956;
Beck
and
Trous-
dell,
1973;
Carmean
and
Kok,
1974;
Losch
and
Schlesinger,
1975;
Monserud,
1984),
this
study
used
only
site
unit.
Many
previous
studies
assumed
that
height
growth
pattern
varies
with
site
units,
and
tested
this
assumption
by
a
graphical
comparison
of
the
averaged
height
curve
developed
for
each
site
unit
(eg
Carmean,
1956;
Monserud,
1984).
This
testing,
how-
ever,
may
not
be
necessarily
valid.
Without
knowing
within-unit
variation,
any
differences
detected
among
site
units
may
not
be
sub-
stantial.
Although
this
study
showed
some
differences
in
curve
shape
among
site
groups,
these
differences
may or
may
not
reflect
the
real
height
growth
patterns
of
the
individual
stands
included
in
each
site
group,
given
the
fact
that
the
variation
within
each
site
group
was
not
examined.
Thus,
it
could
not
be
proven
that
site
groups
were
indeed
controlling
the
height
growth
pattern
of
white
spruce.
In
fact,
a
separate
study
on
white
spruce
height
growth
pattern
indicated
that
soil
moisture,
aeration
and
nutrient
regimes
are
not
controlling
factors
of
curve
shape
(Wang
et al,
1994).
Even
if
site
groups
were
not
important
in
determining
height
growth
pattern,
their
use
in
height
modelling
is
jus-
tified
because
they
are
good
predictors
of
white
spruce
site
index
(Wang,
1993).
Among
10
subzones
of
the
SBS
zone,
only
5
subzones
(ie
dry
cool,
dry
warm,
moist
cool,
moist
warm
and
wet
cool)
were
included
in
this
study.
Although
no
signifi-
cant
differences
in
white
spruce
site
index
were
found
among
the
5
studied
subzones
(Wang,
1993),
the
differences
in
site
index
between
these
subzones
and
the
unstud-
ied
subzones
and
among
the
unstudied
sub-
zones
themselves,
were
not
examined.
As
the
site-specific
models
were
only
tested
for
the
5
studied
subzones,
they
may
not
be
applicable
to
other
subzones
without
independent
test.
Furthermore,
the
site-spe-
cific
curves
were
developed
for
only
7
of
the
13
possible
site
groups
(Wang,
1993);
thus,
they
cannot
be
applicable
to
other
site
groups.
However,
these
7
site
groups
may
well
include
all
sites
that
could
potentially
support
productive
white
spruce
growth
in
the
SBS
zone.
CONCLUSION
It
appears
feasible
to
develop
site-specific
height
curves
without
using
site
index
and
any
other
stand
attributes
as
predictors
when
height
modelling
is
linked
to
site
clas-
sification.
The
site-specific
height
curves
constructed
for
the
7
broad
site
units
pre-
dicted
dominant
height
of
the
studied
white
spruce
stands
with
acceptable
precision,
and
the
predictions
were
comparable
with
the
polymorphic
height
curves.
Testing
against
independent
data
indicated
that
these
curves
could
be
applied
over
a
large
area
of
the
sub-boreal
forests
of
British
Columbia.
ACKNOWLEDGMENTS
The
authors
thank
A
Franc
for
providing
a
French
summary
to
this
paper,
and
JF
Dhote
for
his
help-
ful
review
comments
on
the
manuscript.
REFERENCES
Agren
GI,
Axelsson
B
(1980)
PT -
a tree
growth
model.
In:
Structure
and
function
of
northern
coniferous
forests -
an
ecosystem
study
(T
Persson,
ed),
Ecol
Bull 32,
525-536
Beck
DE,
Trousdell
DB
(1973)
Site
index:
accuracy
of
prediction.
USDA
For
Serv
Res
Pap
SE-108.
South-
eastern
For
Exp
Stn,
Asheville,
NC,
USA
Bossel
H
(1986)
Dynamics
of
forest
dieback:
systems
analysis
and
simulation.
Ecol
Modelling
34,
259-228
Bossel
H
(1991)
Modelling
forest
dynamics:
moving
from
description
to
explanation.
For
Ecol Manage
42,
129-
142
Carmean
WH
(1956)
Suggested
modifications
of
the
standard
Douglas-fir
site
curves
for
certain
soils
in
southwestern
Washington.
ForSci2,
242-250
Carmean
WH
(1972)
Site
index
curve
for
upland
oaks
in
the Central
States.
For
Sci
18, 109-120
Carmean
WH,
Kok
CT
(1974)
Site
quality
for
Caribbean
pine
in
peninsular
Malaysia.
Malaysian
Forester 37,
109-119
Clutter
JL,
Fortson
JC,
Pienaar
LV,
Brister
GH,
Bailey
RL
(1983)
Timber
management:
a
quantitative
approach.
John
Wiley
&
Sons,
New
York,
NY,
USA
Crow
TR,
Rauscher
HM
(1984)
Forest
growth
model
and
land
classification.
In:
Forest
land
classification:
experience,
problems,
perspectives
(JG
Bockheim,
ed),
Univ
of
Wisconsin,
Madison,
WI,
USA
Davis
LS,
Johnson
KN
(1987)
Forest
management,
3rd
ed.
McGraw-Hill
Book
Company,
New
York,
NY,
USA
Dyer
ME,
Bailey
RL
(1987)
A
test
of
6
methods
for
esti-
mating
true
heights
from
stem
analysis
data.
For
Sci
33, 3-13
Goudie
JW,
Mitchell
KJ
(1986)
The
first
approximation
managed
stand
yield
tables
for interior
white
spruce:
initial
density.
BC
Min
For,
Victoria,
BC
(unpublished
manuscript)
Greene
WH
(1990)
Econometric
analysis.
Macmillan
Publishing
Company,
New
York,
NY,
USA
Green
RN,
Marshall
PL,
Klinka
K
(1989)
Estimating
site
index
of
Douglas-fir
(Pseudotsuga
menziesii
[Mirb]
Franco)
from
ecological
variables
in
southwestern
British
Columbia.
For Sci 35,
50-63
Inions
G
(1990)
Classification
and
evaluation
of
site
in
karri
(Eucalyptus
diversicolor
F
Muell)
regeneration.
I.
Edaphic
and
climatic
attributes.
For
Ecol Manage
32, 117-124
Inions
G,
Wardell-Johnson
G,
Annels
A
(1990)
Classifi-
cation
and
evaluation
of
site
in
karri
(Eucalyptus
diversicolor F
Muell)
regeneration.
II.
Floristic
attributes.
For
Ecol Manage
32,
125-134
Kimmins
JP
(1985)
Future
shock
in
forest
yield
fore-
casting:
the
need
for
a
new
approach.
For
Chron
61, 503-512
Kimmins
JP,
Comeau
PG,
Kurz
W
(1990)
Modelling
the
interactions
between
moisture
and
nutrients
in
the
control
of
forest
growth.
For
Ecol
Manage
30,
361-
379
Klinka
K,
Carter
RE
(1990)
Relationships
between
site
index
and
synoptic
environmental
factors
in
immature
Douglas-fir
stands.
For Sci 36,
815-830
Landsberg
JJ
(1986)
Physiological
ecology
of
forest
pro-
duction.
Academic
Press
Inc,
London,
UK
Leech
JW
(1984)
Modelling
for
forest
management.
In:
Research
for
forest
management
(JJ
Landsberg,
W
Parsons,
eds),
CSIRO,
Melb,
229-232
Losch
CK,
Schlesinger
RC
(1975)
Predicting
site
index
in
young
black
walnut
plantations.
USDA
For
Serv
Res
Note
NC-187,
North
Central
For
Exp
Stn,
St
Paul, MN, USA
Meidinger
D,
Pojar
J
(1991)
Ecosystems
of British
Columbia.
Special
Report
Series
6,
BC
Min
For,
Vic-
toria,
BC
Monserud
RA
(1984)
Height
growth
and
site
index
curves
for
inland
Douglas-fir
based
on
stem
analysis
data
and
forest
habitat
type.
For Sci 30,
943-965
Nautiyal
JC,
Cuoto
L
(1984)
The
natural
and
use
of
the
timber
production
function:
Eucalyptus
grandis
in
Brazil. For Sci 30,
761-773
Newberry
JD,
Pienaar
LV
(1978)
Dominant
height
growth
models
and
site
index
curves
for
site-pre-
pared
slash
pine
plantations
in
the
lower
coastal
plain
of
Georgia
and
North
Florida.
Plantation
Man-
age
Res
Coop
Res
Paper
no
4,
Univ
of
Georgia,
Athens,
GA,
USA
Pfister
RD,
Kovalchik
BL,
Arno
SF,
Presby
RC
(1979)
Forest
habitat
types
of
Montana.
General
Technical
Report
INT-34,
USDA
For
Serv,
Intermountain
For-
est
and
Range
Experiment
Station,
Ogden,
UT,
USA
Pojar J,
Klinka
K,
Meidinger
DV
(1987)
Biogeoclimatic
ecosystem
classification
in
British
Columbia.
For
Ecol
Manage
22, 119-154
Rayner
ME,
Turner
BJ
(1990)
Growth
and
yield
mod-
elling
of
Australia
eucalyptus
forests.
I.
Historical
development.
Australia
For 53,
224-237
Richards
FJ
(1959)
A
flexible
growth
function
for
empir-
ical
use.
J
Exp
Bot
10,
290-300
Running
SW,
Coughlan
JC
(1988)
A
general
model
of
forest
ecosystem
processes
for
regional
application.
I.
Hydrological
balance,
canopy
gas
exchange
and
primary
production
processes.
Ecol
Modelling
42,
125-154
Shugart
HH
(1984)
Theory
of forest
dynamics.
Springer,
New
York,
NY,
USA
Wang
GG
(1993)
Ecological
site
quality,
site
index,
and
height
growth
of
white
spruce
stands
in
the
sub-
boreal
spruce
zone
of
British
Columbia.
PhD
dis-
sertation,
Univ
of
British
Columbia,
Vancouver,
BC
Wang
GG,
Marshall
PL,
Klinka
K
(1994)
Height
growth
pattern
of
white
spruce
in
relation
to
site
quality.
For
Ecol Manage
68, 137-147
Wang
Q,
Wang
GG,
Coates
KD,
Klinka
K
(1994)
Use
of
site
factors
to
product
lodgepole
pine
and
interior
spruce
site
index
in
the
sub-boreal
spruce
zone.
Res
Note. BC Min
For,
Victoria, BC, 26
p
West
PW
(1990)
Thinning
response
and
growth
mod-
elling.
In:
The
young
eucalyptus
report
(CM
Kerruish,
WHM
Rawlins,
eds),
CSIRO,
Melb
Wilkinson
L
(1990a)
SYGRAPH:
The
system
for graph-
ics.
SYSTAT
Inc,
Evanston,
IL,
USA
Wilkinson
L (1990b)
SYSTAT:
The
system
for statistics.
SYSTAT
Inc,
Evanston,
IL,
USA
Wykoff
WR,
Monserud
RA
(1987)
Presenting
site
qual-
ity
in
increment
models:
a
comparison
of
methods.
In:
Forest
growth
modelling
and
prediction,
Vol
1,
USDA
For
Serv
Gen
Tech
Rep
NC-120.
North
Cen-
tral
For
Exp
Stn,
Saint
Paul,
MN,
USA,
184-191
Zahner
R
(1962)
Loblolly
pine
site
curves
by
soil
groups.
For Sci 8, 104-110