Microsoft Data Mining integrated business intelligence for e commerc and knowledge phần 5 pdf
Bạn đang xem bản rút gọn của tài liệu. Xem và tải ngay bản đầy đủ của tài liệu tại đây (1.28 MB, 34 trang )
116 4.11 The data mart
data tables to produce both star schemas, for multidimensional viewing, as
well as relational tables for mining.
The way this information is stored assigns a record for each field of data
in a table. So for each customer record there may be one or more promo-
tions with one or more conference attendances in response to the promo-
tions. The collection of related records constitutes a case. For all customers,
the collection of customer cases is called the case set. Different case sets can
be constructed from the same physical data. How the case set is assembled
determines how the mining is done. The focus of the analysis could be the
customer, the promotions or the conference attendances. We could even do
the analysis at the company. If the focus is the customer then such attributes
as Gender and tenure could be used to predict the behavior of future cus-
tomers.
In our example, we can see that the main unit of analysis—called the
case—is the customer and that the promotional detail is contained, in a
nested, hierarchical fashion, within the customer. This is illustrated in Fig-
ure 4.15.
In situations where information is nested in a hierarchical fashion as
shown in Figure 4.19 it is necessary to be careful when specifying the case
level key in the data mining analysis since this will be used to determine the
case base, or unit of analysis. Considerations on defining the unit of analysis
and examples on identifying the key to define the case base are taken up in
Chapter 5.
Figure 4.15 Example of the hierarchical nature of a Microsoft data mining analysis case
117
5
Modeling Data
Information is the enemy of intelligence.
—Donald Hall
In the recent past there has been a growing recognition that we are suffering
from what has sometimes been called a “data deluge.” In Chapter 2 we out-
lined a data maturity hierarchy, which suggested that we turn data into
intellectual capital through successive, and successively sophisticated, refine-
ments. Data are turned into information through grouping, summarizing,
and OLAP techniques such as dimensioning. But too much information
can contribute to the overwhelming effect of data deluge. Further, informa-
tion, which, as we can see, is data organized for decision making, can be fur-
ther refined. By processing information through the lens of numerical and
statistical search algorithms, data mining provides a facility to turn informa-
tion into knowledge. Data can be organized along many dimensions of
potential analysis. But to find the subset of dimensions that are most impor-
tant in driving the outcome or phenomenon under investigation requires
the kind of automated search algorithms that are incorporated in SQL
Server 2000. This chapter provides detailed examples of how to use the
Analysis Server data mining functionality to carry out typical outcome or
predictive modeling (classification) and clustering (segmentation) tasks.
The chapter begins with a review of how to go about setting up an
OLAP cube to perform preliminary data scanning and analysis as a first step
to data mining. It shows how both the data mining model and the OLAP
cube model are different representations of the same data source and how
118 5.1 The database
Analysis Manager stores both sets of models in the same folder. A simple set
of wizards is available to create and examine both OLAP and data mining
models. A very common data mining scenario is built to illustrate the anal-
ysis: target marketing.
As indicated in Chapter 1, potentially the most common data mining
scenario is to sort through multiple dimensions containing multiple drivers
in the data and combinations of drivers in order to determine the specific
set of data drivers that is determining an outcome. These drivers can be data
elements (such as a gender field) or even operational measures of a concept
(such as earnings–expenses to provide an index of purchasing power). The
most common outcome is a probability of purchase or probability of
response to an offer. This is a typical target marketing scenario.
The target marketing example that has been selected for discussion in
this chapter is taken from a marketing scenario discussed in the previous
chapters. The organization under investigation offers educational work-
shops and conferences in a variety of emerging technology areas and con-
tacts its potential customers in several ways, including sending targeted
offers to prospect lists drawn from both new and previous customer inquir-
ies. Our example enterprise wants to determine the characteristics of people
who have responded to previous offers, according to the event that was
offered, in order to construct more effective prospect lists for future event
offerings. This is the kind of problem that data mining is ideally suited to
solve.
5.1 The database
The database captures the important data that are necessary to run the con-
ference delivery business that serves as our example case study. The basic
organization of the database is shown in Figure 5.1.
5.2 Problem scenario
The problem scenario builds on the data mart assembly description dis-
cussed in Chapter 4. As shown there, the enterprise—which we shall call
Conference Corp.—provides industry-leading exposure to new trends and
technologies in the area of information technology through conferences,
workshops, and seminars. It promotes through targeted offers—primarily
through the delivery of personalized offers and the delivery of associated
conference brochures. The exclusive, “by invitation only” nature of the
5.2 Problem scenario 119
Chapter 5
events requires the development of high-quality promotional materials,
which are normally sent through surface mail. Such quality places a pre-
mium on targeting, since the materials are expensive to produce. The enter-
prise consistently strives for high response and attendance rates through
continual analysis of the effectiveness of its promotional campaigns.
The database is organized around the customer base and carries tables
relating to the promotions that have been sent to customers and the atten-
dances that were registered.
As we can see, the information model shown in Figure 5.1 provides the
core data tables needed to accomplish the target marketing task: Customers
receive many promotions for many events. Once they receive the promo-
tion, they may ignore it or may register and attend the event being pro-
moted. Our job is to look at promotional “hits and misses”: What
characteristics of customers who have been contacted predispose them to
attend the promoted event? Once we know these characteristics, then we
will be in a good position to better target subsequent promotions for our
events. This will lower our promotional costs and will enable us to provide
better service to our customers by providing them with information that is
more appropriate to their interests. This produces a personalization effect,
which is central to building customer loyalty over time. Thus, the benefit of
this targeted approach includes the promotional savings that accrue through
targeting a customer grouping that is more likely to respond to an offer, as
Figure 5.1
Information model
for the “New
Trends in
Information
Te c h n ol o g y”
conference and
workshop enterprise
Customers Promotions
Conferences
receive
attend
120 5.3 Setting up analysis services
well as the benefit of providing targeted, personalized messages to customers
and prospects.
The contents of the data tables used to populate the information model
are shown in Figure 5.2. All databases in these exercises are available at
/>5.3 Setting up analysis services
The first task is to publish your data source in the Windows NT or 2000
environment by establishing a data source name (DSN). The Data Sources
(ODBC) settings are accessed in NT through Start Settings Control
Panel, and in Windows 2000 the appropriate access path is Start Settings
AdministrativeTools.
Figure 5.2
Data tables used to
support targeted
marketing
application
information model
Figure 5.3
The first step in
defining a data
source name—
defining source
data driver
5.3 Setting up analysis services 121
Chapter 5
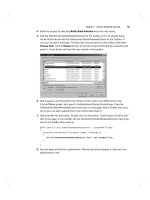
Open the Data Sources (ODBC) by double-clicking and then select the
System DSN tab. Click Add to display the Create New Data Source win-
dow, as shown in Figure 5.3.
In the Create New Data Source window, select Microsoft Access Driver
(*.mdb). Now click Finish. This will present the ODBC Microsoft Access
Setup dialog, displayed in Figure 5.4. Under Data Source Name, enter
ConfCorp (or whatever name you choose). In the Database section click
Select.
In the Select Database dialog box, browse to the ConfCorp.mdb data-
base and Click OK.
Click OK in the ODBC Microsoft Access Setup dialog box.
Click OK in the ODBC Data Source Administrator dialog box.
To start Analysis Manager, from the Start button on the desktop select
Programs Microsoft SQL Server Analysis Services Analysis Manager.
Once Analysis Manager opens, then, in the tree view, expand the Analysis
Services selection. Click on the name of your server. This establishes a con-
nection with the analysis server, producing the display shown in Figure 5.5.
5.3.1 Setting up the data source
Right-click on your server’s name and click New Database. Once you have
defined the new database you can associate a data source to it by right-click-
ing the Data Sources folder and selecting New Data Source. In the Data
Figure 5.4
Designating the
database to be used
as the data source
name
122 5.3 Setting up analysis services
Link Properties dialog box select the Provider tab and then click Microsoft
OLE DB Provider for ODBC Drivers. This will allow you to associate the
data source with the DSN definition that you established through the
Microsoft Data Sources (ODBC) settings earlier. Select the Connection tab.
In the database dialog box, shown in Figure 5.6, enter the DSN that you
have identified—here called ConfCorp—and then click OK.
In the tree view expand the server and then expand the ConfCorp data-
base that you have created. As shown in Figure 5.7, the database contains
the following five nodes:
1. Data sources
2. Cubes
Figure 5.5 Analysis Manager opening display
5.3 Setting up analysis services 123
Chapter 5
3. Shared dimensions
4. Mining models
5. Database roles
As shown in Figure 5.8, you can use the Test Connection button to
ensure that the connection was established (if so, you will receive a confir-
matory diagnostic). At this point you can exit by selecting OK. Exit the
Data Link Properties dialog by selecting OK.
Figure 5.6
Identifying the
database to
Analysis Manager
Figure 5.7
Database folders set
up in Database
Definitions for
Analysis Manager
124 5.4 Defining the OLAP cube
5.4 Defining the OLAP cube
Now that you have set up the data source you can define the OLAP cube.
Start by expanding the ConfCorp database and then selecting the Cubes
tree item. Right-click, then as shown in Figure 5.9, select New Cube and
Wizard.
In the Welcome step of the Cube Wizard, select Next. In the Select a fact
table from a data source step, expand the ConfCorp data source, and then
click FactTable. You can view the data in the FactTable by clicking Browse
data, as shown in Figure 5.10.
To define the measurements for the cube, under fact table numeric col-
umns, double-click LTVind (Life Time Value indicator).
To build dimensions, in the Welcome to the Dimension Wizard step,
click Next. This will produce the display shown in Figure 5.11. In the
Choose how you want to create the dimension setup, select Star Schema: A sin-
gle dimension table. Now select Next.
In the Select the dimension table step, click Customer and then click
Next.
Figure 5.8
Testing the
database
connection
5.4 Defining the OLAP cube 125
Chapter 5
In the Select the dimension type, click Next. As shown in Figure 5.12, to
define the levels for the dimension, under Available columns, double-click
the State, City, and Company columns. Click Next.
Figure 5.9
Building a new
cube from the
Database
Definition in
Analysis Manager
Figure 5.10
Browsing the cube
fact table data
126 5.4 Defining the OLAP cube
Figure 5.11
Setting up the
cube—defining the
source schema
Figure 5.12
Definition of the
cube dimensions
and levels
5.4 Defining the OLAP cube 127
Chapter 5
In the Specify the Member Key Column step, click Next. Also click Next
for the Select Advanced options step. In the last step of the wizard, type Cus-
tomer in the Dimension name box, and keep the Share this dimension with
other cubes box selected. Click Finish.
This will produce a display of the OLAP cube that you have built, illus-
trated in Figure 5.13.
You can either save the cube for processing later or process the cube
immediately (to process immediately select the close box).
If you select the close box you will get a window, shown in Figure 5.14,
that asks you whether you want to save the cube. Select Yes to save the cube
and to enter cube processing to set up the dimensions for the analysis.
This will set up the cube for processing. Processing is necessary to look
ahead for the potential reporting dimensions of the cube so as to make the
Figure 5.13 Example of a cube with fact table and one dimension
128 5.4 Defining the OLAP cube
dimensional results available for query in a responsive manner (since there
are potentially a large number of queries, the processing is done ahead of
time to ensure that the queries are processed and stored in the database to
enable quick responses to a user request).
You will be asked what type of data store you want to create: Molap,
Rolap, or Holap. These dimensional storage options are explained in the
Microsoft Press publication Data Warehousing with SQL Server 7.0. Essen-
tially, these techniques allow the user to optimize query responsiveness with
disk space savings. The data store options are shown in Figure 5.15.
Once you select the data storage method you will be presented with a
storage optimization window, as illustrated in Figure 5.16. This window
will give you an opportunity to tune the relative contributions of preproc-
essed queries and associated storage against potential query responsiveness.
To start, simply select the defaults (including the default “Performance
gain” of 50 percent). Select Start to launch the storage–query responsiveness
process, as shown in Figure 5.16.
Figure 5.14
Saving the cube for
processing
Figure 5.15
Defining the cube
storage types
5.4 Defining the OLAP cube 129
Chapter 5
This will produce the actual query responsiveness distribution, as shown
in Figure 5.17.
Once Analysis Services has finished processing, the cube that you have
defined, it will produce a display indicating that the processing has been
successful. You can examine the processing results window, shown in Figure
5.18, to see the various processing steps (the window displays the SQL that
it used to produce the dimensional cube reports).
Figure 5.16
Setting up the
cube query
responsiveness
process
Figure 5.17
Actual predicted
query
responsiveness
display
130 5.4 Defining the OLAP cube
Once the cube has finished processing, you can view the results. As
shown in Figure 5.19, to view the cube processing results select the cube in
the Analysis Services server tree, select Cube, right-click, and Browse.
This will produce a browsable table as shown in Figure 5.20.
If you like, you can open up the various categories and drill down to
state-level aggregations to get a better view of the results. An example of
drill down is shown in Figure 5.21.
Figure 5.18
Cube processing
results window
Figure 5.19
Cube processing
results
5.4 Defining the OLAP cube 131
Chapter 5
Figure 5.20
Results of cube
browsing operation
Figure 5.21
Cube drill down
132 5.5 Adding to the dimensional representation
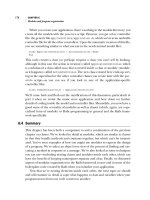
5.5 Adding to the dimensional representation
So far what we have shown is relatively simple. Let’s add a few more dimen-
sions to the display to be in a position to produce a more comprehensive
view of our promotion and conference programs.
To do this, we need to go back to the server tree display in Analysis Serv-
ices and, once the cube is selected, right-click to produce the New Dimen-
sion selection in the cube definition, as shown in Figure 5.22.
Once this is done, it provides the ability to add as many new dimensions
as are necessary to complete the preliminary picture of the conference pro-
gram that we need to support our descriptive analysis of the conference
promotional results. Figure 5.23 shows the display that allows us to add the
Promotional dimension to the analysis.
Figure 5.22
Adding dimensions
to the cube
Figure 5.23
Adding a
dimension
(promotion) to the
cube
5.5 Adding to the dimensional representation 133
Chapter 5
This allows us to add enough dimensions to provide a comprehensive
overview of the promotional program results, which includes the relevant
dimensions of promotions, corresponding conferences attendances, and the
associated time (or seasonality) results. The star schema that supports this
reporting framework is shown in Figure 5.24.
This allows you to produce multidimensional reports, as shown in Fig-
ure 5.25.
Here we see that, overall, the e-commerce conference is attracting the
most attendances from people with a relatively higher lifetime value index.
But we can also see that there are many other possible views of the confer-
ence program. To see the effect of other dimensions all you have to do is
pick up a dimension with the mouse by left-clicking on the dimension and
moving it into the Measurement level column of the OLAP display. Figure
5.26 shows the kinds of multidimensional displays that are possible using
this drag-and-drop, cross-dimensional view operation.
Figure 5.24 Completed star schema representation for the conference results
134 5.5 Adding to the dimensional representation
Here we can see, for example, the growth of the e-Commerce pro-
gram—in terms of Life Time Value indicators—from 1998 to 1999. We
can also see that the Java program and the Windows CE operating system
programs were introduced in 1999.
Figure 5.25
Top-level cube for
the conference
attendance results
Figure 5.26
Dragging and
dropping various
dimensions
5.6 Building the analysis view for data mining 135
Chapter 5
While this kind of presentation is informative and necessary to meet
that standard reporting needs of the enterprise, it is not well adapted to
finding the critical dimensions and dimensional values, that drive a particu-
lar business decision. For example, from this kind of display, it is hard to see
what the most important drivers of a decision to attend a particular confer-
ence are. Data mining is well adapted to address this kind of investigative
question. And, of course, that is why Microsoft followed up the implemen-
tation of OLAP cube reporting in Microsoft SQL Server 7 with the imple-
mentation of data mining in SQL Server 2000. The data mining
capabilities provided in SQL Server 2000 are described in the following sec-
tions.
5.6 Building the analysis view for data mining
5.6.1 Analysis problem
We need to determine the characteristics of customers and prospects who
are most likely to respond to our promotional offer. This means that we
have to assemble an analysis data set containing responses and nonresponses
to our offer. Further, we have to assemble a data set that has enough distin-
guishing information in it to enable us to distinguish the propensity to
respond on the basis of key discriminating characteristics.
Our business experience suggests that the propensity to respond is a
function of customer characteristics, such as type of job and employer char-
acteristics, such as size of firm and annual sales. Response rates also vary
according to other customer characteristics, such as length of time as a cus-
tomer, whether the customer has attended previous events, and so on.
Finally, in the past, business managers have observed that the propensity to
respond is related to the offer type, discount, and coupon policies, as well as
how many promotions have been sent to the targeted prospect.
It is very difficult to sort through all these potential predictors of cus-
tomer response in order to find the unique combination of attributes that
will best describe the profile of the customer who is most likely to respond
without some sort of automated pattern search algorithm. As shown below,
data mining decision trees are particularly suited to carrying out this kind of
automated pattern search.
Once the analysis has been completed below we will see that the best
predictor of response—length of time as a customer—while seemingly use-
ful, reveals a problem: since short term customers are most likely to respond
136 5.6 Building the analysis view for data mining
to campaigns this means that customer loyalty in the installed customer
base is low. However, data mining can be useful in exploring and cultivating
the most loyal customers in order to increase their life time value. The most
loyal customers turn out to be males who either come from very small firms
or very large firms. Whereas the long term response rate to campaigns is
very low at 1 percent it turns out that males in this small or large firm cate-
gory respond at a rate of 8 percent. So Conference Corp can increase
response rate and stimulate customer loyalty by targeting more of this mar-
ket segment in the future.
Among females the keys to increasing response rate are also revealed by
the data mining model: Females in mid-size firms (neither small nor large as
in the case of males) with moderate income are the best targets. Here the
response rate increases to approximately 15 percent.
The analytical model for this approach is illustrated, in the form of an
Ishikawa diagram, in Figure 5.27.
5.6.2 Unit of analysis
As we can see from Figure 5.27, there are four potential units of analysis, as
follows:
1. The company (1,955 records or cases in the data set)
2. The individual customer (3,984 records or cases in the data set)
3. The response (there are 9,934 responses in the data set: 8,075 for
the e-commerce conference [55 percent]; 1,467 for the Java con-
ference [10 percent], and 392 for the Windows CE conference [3
percent] for an overall response rate of about 68 percent)
4. The promotion (14,589 incidents or cases in the data set)
It might be tempting to see the customer as the unit of analysis; how-
ever, if we think about it, the unit of analysis has to be the promotion itself.
Figure 5.27
Analytical model
for the response
analysis
Customer
Behavior
Prospect/Company
Background
Promotional
History
5.7 Setting up the data mining analysis 137
Chapter 5
We want to look at each and every promotion and examine whether the
promotion produced a response or not.
So, promotion is the unit of analysis and response is the outcome that
we want to examine and explain. In our case, the “explanation” will be
through the construction of a predictive model, which uses the characteris-
tics on the analysis record to discriminate between responders and nonre-
sponders.
5.7 Setting up the data mining analysis
In order to develop a model of the effectiveness of promotions and the asso-
ciated customer attributes that predict promotional response, the data need
to be expressed in the appropriate format. Attendance is viewed as a func-
tion of customer and promotional characteristics.
Attendance (outcome/target) Customer Characteristics +
Promotional Activities
The data representation that supports this type of analysis is shown in
Figure 5.28.
Figure 5.28
Construction of the
analysis record—
the customer case
Promotion
11
Promotion
12
Promotion
1n
Attendance
11
Attendance
1n
Customer 1
Promotion
21
Promotion
22
Promotion
2n
Attendance
21
Attendance
2n
Customer 2
Promotion
n1
Promotion
n2
Promotion
nn
Attendance
n1
Attendance
nn
Customer n
138 5.7 Setting up the data mining analysis
As can be seen, the unit of analysis is the promotion. This means that
copies of the “host” customer record for each promotion will be propagated
through the analysis file (the result of executing a right join in the query
that forms the Customer–Promotion link). There may be one or more con-
ference attendances that can result from the promotional records on file, so
these attendances need to be added to the analysis view. This is accom-
plished by a left join between the Promotions and Attendances tables (this
join precedes the former join).
5.7.1 Query construction
Three tables need to be joined to produce the analysis view, as shown in the
following SQL join expression:
SELECT Customers.*, AllPromos.*,
[Conferences].[CourseCode], [Conferences].[DATE]
FROM Customers RIGHT JOIN (AllPromos LEFT JOIN
Conferences ON
([AllPromos].[CUSTNUM]=[Conferences].[CUSTNUM]) AND
([AllPromos].[PromoDate]=[Conferences].[DATE])) ON
[Customers].[Custnum]=[AllPromos].[CUSTNUM];
Note: Since the example database is in Microsoft Access we can use non-
ANSI compliant SQL for this query. The Transact-SQL query, in particular
the OUTER join, would be different.
The first join—a left outer join—includes all records from the promo-
tional AllPromos table and only those records in the Conference table where
the promotional date and the conference date are equal (this latter business
rule is how we establish that a given conference attendance resulted from a
particular promotion). This results in a join between the promotional and
conference attendance tables that allows us to see which promotions
resulted in a conference attendance (attendance types include e-Commerce,
Java, and Windows CE).
The next join—a right outer join—delivers all the promotional and con-
ference attendances and attaches the associated customer and company
fields to the record. This duplicates customer and company information for
each promotion and conference attendance, so that these potential discrim-
inators are available for the analysis of response/no response. As indicated,
there are 14,589 promotional offers, which resulted in 9,934 attendances.
5.8 Predictive modeling (classification) tasks 139
Chapter 5
5.8 Predictive modeling (classification) tasks
The relational database shown in Figure 5.1 has been defined as a Microsoft
Access database. So, the first task to accomplish in bringing the data into
the analysis is to establish the database as an ODBC data source.
As with the dimensional example, begin by setting up the system data
source (DSN) to establish a connection between Analysis Manager and the
conference response data in the ODBC data source administrator, as shown
in Figure 5.29.
In Windows 2000, go to Settings, Control Panel, and then Administra-
tive Tools. Double-click on Data Sources (ODBC).
As illustrated in Figure 5.30, on the System DSN tab, click Add. Select
Microsoft Access Driver and then click Finish.
This will bring you to the Data Link Properties sheet, shown in Figure
5.31. Select the Connection tab, set the check box Use data source name,
and fill in the Access database name (in this case, Conference).
This will present the Select Database dialog box. Use the Select button
to browse to the Conference.mdb database. Click OK.
Figure 5.29
Establishing the
ODBC data source
connection for the
target database
140 5.8 Predictive modeling (classification) tasks
Now back out of the ODBC source data selection sequence: In the
ODBC Microsoft Access Setup dialog box, click OK. In the ODBC Data
Source Administrator dialog box, click OK.
Figure 5.30
Data Link
Properties
Figure 5.31
Access Database
Setup dialog box