Báo cáo y học: "The standardised copy of pentagons test" pdf
Bạn đang xem bản rút gọn của tài liệu. Xem và tải ngay bản đầy đủ của tài liệu tại đây (425.37 KB, 10 trang )
PRIMARY RESEARCH Open Access
The standardised copy of pentagons test
Konstantinos N Fountoulakis
1*
, Melina Siamouli
2
, Panagiotis T Panagiotidis
3
, Stamatia Magiria
4
, Sotiris Kantartzis
2
,
Vassiliki A Terzoglou
5
and Timucin Oral
6
Abstract
Background: The ‘double-diamond copy’ task is a simple paper and pencil test part of the Bender-Gestalt Test and
the Mini Mental State Examination (MMSE). Although it is a widely used test, its method of scoring is crude and its
psychometric properties are not adequately known. The aim of the present study was to develop a sens itive and
reliable method of administration and scoring.
Methods: The study sample included 93 normal control subjects (53 women and 40 men) aged 35.87 ± 12.62 and
127 patients suffering from schizophrenia (54 women and 73 men) aged 34.07 ± 9.83.
Results: The scoring method was based on the frequencies of responses of healthy controls and proved to be
relatively reliable with Cron bach’s a equal to 0.61, test-retest correlation coefficient equal to 0.41 and inter-rater
reliability equal to 0.52. The factor analysis produced two indices and six subscales of the Standardised Copy of
Pentagons Test (SCPT). The total score as well as most of the individual items and subscales distinguished between
controls and patients. The discriminant function correctly classified 63.44% of controls and 75.59% of patients.
Discussion: The SCPT seems to be a satisfactory, reliable and valid instrument, which is easy to administer, suitable
for use in non-organic psychiatric patients and demands minimal time. Further research is necessary to test its
psychometric properties and its usefulness and applications as a neuropsychological test.
Background
The ‘double-diamond copy’ task is a well known, simple
paper and pencil test included in the Bender-Gestalt
Test [1-9]. A slightly different version (’double-pentagon
copy’ ) with a different overlapping shape is included
also in the Mini Mental State Examination (MMSE)
[10,11]. It is composed of two overlapping pentagons,
with the overlapping shape being a rhombus. It assesses
visual motor ability. However, for both scales this item
is scored in a very simple way. For example, in the
MMSE it receives a 0/1 score and in the Bender-Gestalt
Test a 0-4 score, with sample drawings to lead the
examiner. The overall method is more ‘qualitative’ and
focuses on the ‘organic/neuropsychiatric’ end of the
spectrum (for example, dementia), since scoring levels
0-2 are reserved for very poor performance.
Non-organic psychiatric patients, however, including
most patients with schizophrenia, are likely to receive a
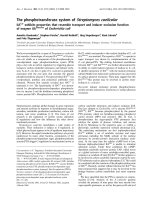
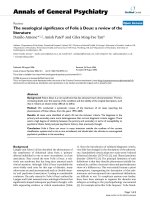
score of 2-4. Samples showing how patients with
schizophrenia perform in this task are shown in Figure 1.
It is obvious that by using these scoring methods to
assess the drawings of psychiatric patients, valuable infor-
mation might be lost.
Theaimofthecurrentstudywastodevelopanovel
and detailed standardised method for the administration
and scoring of a task similar to the ‘double -diamond
copy’ task. This task included two pe ntagons overlap-
ping into a rhombus but with a slight ly different shape
in comparison to the Bender-Gestalt figure (Figure 1).
This new task with his novel scoring me thod aims to be
reliable, valid and sensitive to change in response to
treatment and be suitable for use in mental patients suf-
fering from other disorders than dementia.
Methods
Study sample
The study sample included 93 normal control subjects
(53 women (56.98%) and 40 men (43.02%)) aged 35.87 ±
12.62 (range 18-68) and 127 patients suffering from
schizophrenia, undifferentiated type, a ccording to the
Diagnostic and Statistical Manual of Mental Disorders,
fourth edition, text revision (DSM-IV-TR) (54 women
* Correspondence:
1
Third Department of Psychiatry, School of Medicine, Aristotle University of
Thessaloniki, Thessaloniki, Greece
Full list of author information is availabl e at the end of the article
Fountoulakis et al. Annals of General Psychiatry 2011, 10:13
/>© 2011 Fountoulakis et al; licensee BioMed Central Ltd. This is an Open Access article distributed under the terms of the Creative
Commons Attribution License ( .0), which permits unrestricted use, distribution, and
reproduction in any medium, provided th e original work is properly cited.
(42.52%) and 73 men (57.48%)) aged 34.07 ± 9.83 (range
18-66).
All subjects were ph ysically healthy with normal clini-
cal and laboratory findings. All control subjects and
patients gave informed consent and the protocol
rec eived approval by the University’s Ethics Committee.
The patients were either inpatients or outpatients of a
private psychiatric clinic.
Clinical diagnosis
The diagnosis was made according to DSM-IV-TR cri-
teria on the basis of a semistructured interview based on
the Schedules for Clinical Assessment in N euro psychia-
try version 2.0 (SCAN v 2.0) [12].
Normal controls were assessed on the basis of an
unstructured clinical interview.
The Standardised Copy of the Pentagons Test (SCPT)
procedure
The SCPT procedure demanded the subject to copy a
shape of two partially overlapping pentagons analogous
to a shape of the Bender-Gestalt Test and similar to the
figure used in some versions of the MMSE. The shape
includes two pentagons whose overlap is a four-angle
rhombus.TheshapeisshowninFigure1andinAddi-
tional file 1. The SCPT instructions ask the subject to
draw an identical shape on the same piece of paper. The
template shape was printed on the left half of the sheet
leaving space for the subject to reproduce it on the
right. No time limit was set and no time recording was
made.
TheassessmentincludedtheRandomLetterTest
(RLT) for the assessment of attention and vigilance [13].
It includes the following four series of letters:
LTPEAOAISTDALAA; ANIABFSAMPZEOAD; PAK-
LATSXTOEABAA and ZYFMTSAHEOAAPAT. The
first and third group include five ‘ A’s, while the second
and the fourth include four ‘ A’s. The test requires the
patient to hit the desk when the examiner pronounces
‘A’. Errors of omission and commission are recorded. It
is expected (and verified in the present study) that the
mean number of errors expected from normal controls
in this test is around 0.2 [14]. Both errors of omission
and commission were registered for this test.
Psychometric assessment
The psychometric assessment included the Positive and
Negative Symptoms Scale (PANSS) [15], the Young
Mania Rating Scale (YMRS) [16], and the Montgomery
Asberg Depression Rating Scale (MADRS) [17].
Statistical analysis
Frequency tables were created concerning the scores of
healthy controls. These tables were used to produce per-
centile scores and develop a scoring method for the
scale. The Pearson’s R correlation coefficient, factor ana-
lysis (varimax normalised rotation) and item analysis
[18] (calculation of Cronbach’s a)wereusedtoexplore
the internal structure of the scale. Analysis of variance
(ANOVA) [19], was used to test the difference between
groups, and was performed separately for subjects below
and above the a ge of 40. Discriminant function analysis
wasalsousedtoexplorethepowerofthescaleindis-
criminating between groups. The Pearson’s R correlation
coefficient was calc ulated to assess the test-retest relia-
bility as well as the inter-rater reliability. However, the
Figure 1 Template and samples showing how patients with schizophrenia perform in the copy of pentagons task.
Fountoulakis et al. Annals of General Psychiatry 2011, 10:13
/>Page 2 of 10
calculation of correlation coefficients is not a sufficient
method to test reliability and reproducibility of a
method and its results, because it is an index of correla-
tion and not an index of agreement [19-21]. The calcu-
lation of means and standard deviations for each SCPT
item and total score during the first (test) and second
(retest) applications m ay provide an impression of the
stability of results over time.
The means and the standard deviations of the differ-
ences concerning each SCPT item between test and ret-
est were also calculated, and plots of the test v s retest
and difference vs average value for eac h variable were
generated. In fact, it is not possible to use statistics to
define acceptable agreement [19]. However, these plots
may assist decision. This method has been used in pre-
vious studies concerning the validation of scientific
methods [22,23].
Results
The frequency tables for scores o f healthy controls are
shown in Table 1. In the same table, the proposed scor-
ing for each item is also shown. This scoring method is
based on the frequencies of responses of healthy con-
trols (percentile scores).
The one-way ANOVA revealed significant difference in
the total SCPT score in comparison to controls for sub-
jects under th e age of 40 (P < 0.001) but not for th ose
above t his age (P = 0.17; Table 2). Note that SCPT-14
and SCPT-15 had no variance so they were not included
in the analysis concerning separate items. The results are
shown in Table 2 along with post hoc tests. It seems that
in older subjects there are no differences because the per-
formance of controls gets worse, while the change in the
performance of patients is not great.
The P earson’s R correlation coefficients for the SCPT
items are shown in Table 3 (total study sample).
The P earson’s R correlation coefficients for the SCPT
items and the Positive and Negative Syndrome Scale
(PANNS; positive, negative and general psychopathology
subscales), the YMRS and the MADRS are shown in
Table 4 (only for patients with schizophrenia).
The results of the factor analysis (varimax normalised
rotation) are shown in Table 5. The analysis (by using
the Keiser-Fleish criterion of eigenvalues larger than 1)
produced six factors explaining 62% of the total var-
iance. On the basis of this factor analysis, subscales were
created and the differences between groups c once rning
thesesubscalesarealsoshowninTable6.Thelast
SCPT item (closing-in) was included as a seventh sub-
scale since it did not contribute to the factor analysis.
One-way ANOVA revealed significant differences
between the two diagnostic groups and post hoc tests
showed that this difference concerned the some of the
subscales but not all (P < 0.001; Table 6).
Table 1 Frequencies of normal control results for each
item, and proposed standardised score on the basis of
percentiles
Raw
score
No. of
observations
Percentage of
observations
Standard
score
Number of ‘A’ omissions
0 92 98.92 100
1 1 1.08 0
> 1 0 0.00 0
Total 93 100.00
Number of ‘A’ intrusions
0 86 92.47 100
1 6 6.45 8
2 1 1.08 1
> 2 0 0.00 0
Total 93 100.00
1. Number of left pentagon angles missing (maximum 5)
0 93 100.00 100
> 0 0 0.00 0
Total 93 100.00
2. Number of right pentagon angles missing (maximum 5)
0 92 98.92 100
> 0 1 1.08 1
Total 93 100.00
3. Number of angles of the overlapping shape (rhombus) missing or in
excess
0 92 98.92 100
> 0 1 1.08 1
Total 93 100.00
4. Numbers of breaks and corrections in the lines of the two pentagons
0 22 23.66 100
1 36 38.71 75
2 18 19.35 35
3 3 3.23 20
4 6 6.45 15
5 7 7.53 10
> 5 1 1.08 1
Total 93 100.00
5. Severe distortion in the proportions in the left pentagon shape
0 73 78.49 100
> 0 20 21.51 20
Total 93 100.00
6. Severe distortion in the proportions in the right pentagon shape
0 67 72.04 100
> 0 26 27.96 30
Total 93 100.00
7. Severe distortion of the proportions of the rhombus shape
0 60 64.52 100
> 0 33 35.48 35
Total 93 100.00
Fountoulakis et al. Annals of General Psychiatry 2011, 10:13
/>Page 3 of 10
The correlation coefficients for these subscales are
shown in Table 7. Some correlations among these scales
are statistically significant but weak. A second factor
analysis of these subscales produced three superfactors
explaining 22%, 22% and 15% of total variance,
Table 1 Frequencies of normal control results for each
item, and proposed standardised score on the basis of
percentiles (Continued)
8. Angles with a reverse orientation
0 89 95.70 100
> 0 4 4.30 5
Total 93 100.00
9. Asymmetry of pentagons
0 79 84.95 100
> 0 14 15.05 15
Total 93 100.00
10. Smaller size in comparison to the template
0 72 77.42 100
> 0 21 22.58 20
Total 93 100.00
11. Sides not straight lines
0 38 40.86 100
1 24 25.81 60
2 22 23.66 35
3 8 8.60 10
> 3 1 1.08 1
Total 93 100.00
12. Angles whose sides are not straight lines
0 67 72.04 100
1 12 12.90 30
2 8 8.60 15
3 5 5.38 6
> 3 1 1.08 1
Total 93 100.00
13. Rotation
No 90 96.77 100
Yes 3 3.23 3
Total 93 100.00
14. Crossing sides
0 93 100.00 100
> 0 0 0.00 0
Total 93 100.00
15. Close-in
0 93 100.00 100
> 0 0 0.00 0
Total 93 100.00
Table 2 Comparison of the scores of normal controls and
schizophrenic patients (analysis of variance (ANOVA))
above and below 40 years of age, with t test as post hoc
test
Controls Patients with schizophrenia P value
Mean SD Mean SD
Below 40 years
RLT-A 100.00 0.00 71.43 45.72 < 0.001
RLT-B 84.14 21.31 65.00 40.05 < 0.001
SCPT-1 100.00 0.00 98.02 14.00 NS
SCPT-2 100.00 0.00 92.16 26.87 < 0.05
SCPT-3 98.29 13.00 93.14 25.27 NS
SCPT-4 59.17 32.80 57.93 33.02 NS
SCPT-5 84.83 31.64 66.73 39.63 < 0.01
SCPT-6 79.48 32.14 68.12 35.03 < 0.05
SCPT-7 77.59 31.17 61.39 32.08 < 0.01
SCPT-8 93.45 24.28 96.24 18.62 NS
SCPT-9 89.74 27.93 76.44 38.24 < 0.05
SCPT-10 84.83 31.64 86.53 30.08 NS
SCPT-11 64.67 31.74 47.86 33.32 < 0.01
SCPT-12 80.83 34.64 47.26 41.35 < 0.001
SCPT-13 94.98 21.67 93.28 24.76 NS
SCPT-14 100.00 0.00 100.00 0.00 NS
SCPT-15 100.00 0.00 100.00 0.00 NS
SCPT 1307.86 140.59 1185.09 161.50 < 0.001
Above 40 years
RLT-A 96.77 17.96 84.62 37.55 NS
RLT-B 87.13 15.98 62.46 43.00 < 0.01
SCPT-1 100.00 0.00 96.67 18.26 NS
SCPT-2 97.25 16.50 100.00 0.00 NS
SCPT-3 100.00 0.00 96.70 18.07 NS
SCPT-4 64.44 31.12 53.73 38.83 NS
SCPT-5 77.78 36.34 60.00 40.68 NS
SCPT-6 80.56 31.80 74.33 34.31 NS
SCPT-7 74.72 32.14 69.67 32.98 NS
SCPT-8 97.36 15.83 96.83 17.34 NS
SCPT-9 81.11 35.84 91.50 25.94 NS
SCPT-10 75.56 37.37 84.00 32.55 NS
SCPT-11 65.03 34.61 45.73 34.34 < 0.05
SCPT-12 70.11 40.89 56.30 42.25 NS
SCPT-13 97.31 16.17 87.07 33.54 NS
SCPT-14 100.00 0.00 100.00 0.00 NS
SCPT-15 100.00 0.00 100.00 0.00 NS
SCPT 1281.22 151.58 1212.53 121.71 < 0.05
For below 40 year s there were 60 controls and 101 patients. For above 40
years there were 33 controls and 26 patients.
NS = not significant; RLT = Random Letter Test; SCPT = Standardised Copy of
Pentagons Test.
Fountoulakis et al. Annals of General Psychiatry 2011, 10:13
/>Page 4 of 10
Table 3 Pearson Correlation coefficients (R) among the Standardised Copy of Pentagons Test (SCPT) items and Random Letter Test (RLT) scores in the total
study sample
SCPT-1 SCPT-2 SCPT-3 SCPT-4 SCPT-5 SCPT-6 SCPT-7 SCPT-8 SCPT-9 SCPT-10 SCPT-11 SCPT-12 SCPT-13 SCPT-14 SCPT-15
RLT-A
RLT-B 0.48
SCPT-1 1.00
SCPT-2 0.17 1.00
SCPT-3 0.37 0.19 1.00
SCPT-4 0.02 0.03 0.01 1.00
SCPT-5 0.00 0.14 0.14 0.03 1.00
SCPT-6 0.07 0.12 0.26 0.12 0.28 1.00
SCPT-7 -0.03 0.08 0.12 0.02 0.33 0.49 1.00
SCPT-8 -0.02 -0.04 0.07 0.04 0.02 0.10 0.01 1.00
SCPT-9 0.04 0.07 0.07 0.11 0.19 0.22 0.19 0.00 1.00
SCPT-10 -0.06 0.12 0.01 0.07 -0.04 0.07 0.04 0.05 0.05 1.00
SCPT-11 0.05 0.05 0.02 0.07 0.25 0.19 0.12 0.07 0.04 0.06 1.00
SCPT-12 0.13 0.06 -0.01 -0.03 0.19 0.05 0.00 -0.02 0.09 0.04 0.35 1.00
SCPT-13 -0.03 0.03 0.12 0.00 0.05 0.18 0.18 0.19 -0.05 0.12 0.06 0.11 1.00
SCPT-14 1.00
SCPT-15 1.00
SCPT 0.19 0.31 0.34 0.31 0.56 0.62 0.53 0.21 0.43 0.30 0.50 0.45 0.34
Values significant at P < 0.05 are shown in bold.
Fountoulakis et al. Annals of General Psychiatry 2011, 10:13
/>Page 5 of 10
respectively. The first one included s ubscales 2 and 5,
the second included subscales 1, 3, 4 and 6, and the
third included subscales 3 and 7 (Table 8).
Item analysis (ca lculation of Cronbach’s a) Cronbach’s
a was equal to 0.61. The a coefficient did not change
significantly when any item was omitted from the
analysis.
The Discriminant Function Analysis results are shown
in Tables 9 and 10. This analysis produced the following
function: When 3 (SCPT-1) + 9 × (SCPT-2) + 10 ×
(SCPT-3) + 6 × (SCPT-4) + 4 × (SCPT-5) - 2 × (SCPT-
6) + 12 × (SCPT-7) - 6 × (SCPT-8) + 1 × (SCPT-9) - 9
×(SCPT-10)+9×(SCPT-11)+15×(SCPT-12)+4×
(SCPT-13) > 4456 then the subject is likely to be a nor-
mal control rather than a schizophrenic patient. This
function correctly cla ssified 63.44% of controls and
75.59% of patients with schizophrenia, which is a satis-
factory performance.
The Pearson’s R correlation coefficient (R) for inter-
rater reliability is 0.52 for the total SCPT scale and
ranges from 0.46 to 0.86 for individual items (Table 11);
with regard to test-retest reliability, the same coefficient
was equal to 0.46 and the items coefficients ranged from
-0.12 to 0.70 (Table 9). Retest was performed within 5
days of first testing. The calculation of means and stan-
dard deviations for each SCPT item and total score dur-
ing the first (test) and second (retest) applications as
well as the plots of the test vs retest and difference vs
aver age value for each v ariable suggested that the SCPT
is reliable and replicable.
Table 4 Pearson Correlation coefficients (R) among the Standardised Copy of Pentagons Test (SCPT) items and
subscales and the psychometric scales scores in schizophrenic patients only
PANSS-Positive PANSS-Negative PANSS-General psychopathology YMRS MADRS
RLT-A 0.00 0.06 0.08 -0.14 -0.11
RLT-B -0.02 -0.03 -0.04 0.07 -0.16
SCPT-1 0.01 -0.10 -0.02 0.01 -0.18
SCPT-2 -0.15 -0.19 -0.17 -0.02 -0.06
SCPT-3 -0.03 -0.16 -0.14 0.03 -0.33
SCPT-4 -0.05 -0.02 -0.04 -0.23 -0.02
SCPT-5 -0.27 -0.27 -0.28 -0.17 -0.24
SCPT-6 -0.17 -0.29 -0.25 -0.17 -0.16
SCPT-7 -0.12 -0.24 -0.17 -0.09 -0.17
SCPT-8 0.09 0.07 0.11 -0.06 0.06
SCPT-9 0.04 -0.06 -0.06 0.09 -0.02
SCPT-10 0.08 0.04 0.09 -0.04 -0.02
SCPT-11 -0.12 -0.29 -0.22 -0.03 -0.21
SCPT-12 -0.24 -0.40 -0.34 -0.10 -0.29
SCPT-13 -0.14 -0.20 -0.12 0.01 0.06
SCPT-14 - - - - -
SCPT-15 - - - - -
SCPT total -0.21 -0.39 -0.31 -0.15 -0.29
Deficit index (DcI) -0.05 -0.16 -0.10 -0.02 -0.18
Missing angles (MA) -0.08 -0.21 -0.16 0.01 -0.27
Size (S) 0.00 -0.06 0.00 -0.04 -0.04
Deformation index (DfI) -0.21 -0.37 -0.33 -0.14 -0.26
Proportion (P) -0.19 -0.31 -0.28 -0.12 -0.22
Quality of lines (QL) -0.22 -0.41 -0.34 -0.08 -0.30
Correction (C) -0.01 -0.06 -0.06 -0.09 -0.03
Image distortion (ID) -0.03 -0.09 -0.01 -0.03 0.08
Close-in index (CiI) -0.22 -0.41 -0.34 -0.08 -0.30
Quality of lines (QL) -0.22 -0.41 -0.34 -0.08 -0.30
Close-in (CI) - - - - -
Values significant at P < 0.05 are shown in bold. Items 14 and 15 have no variance so a correlation coefficient cannot be calculated for them.
MADRS = Montgomery Asberg Depression Rating Scale; PANSS = Positive and Negative Symptoms Scale; RLT = Random Letter Test; YMRS = Young Mania Rating
Scale.
Fountoulakis et al. Annals of General Psychiatry 2011, 10:13
/>Page 6 of 10
Discussion
The SCPT is a test of v isual motor ability, and although
several decades have passed since it was introduced, lit-
tle has been performed to standardise it. This may be
due to i ts complex pattern and a preference to score it
on the basis of an ‘overall’ impression or ‘ qualitatively ’.
Litt le data can be found in the literature and these exist
only because it is included in the MMSE and the
Bender-Gestalt Test. Until now, scoring has been based
on the overall impression and quality of the drawing as
well as on common errors observed. The focus is on
detecting ‘organic’ brain defects (for example, due to
tumour, stroke or dementia), however, in this way many
details in the perfo rmance of patients may be lost, and
this is especially true when the test is used in psychiatric
populations. Even the Bender-Gestalt Test us es a very
simple way to score these tests.
The current study attempted to develop a standardised
scoring method that would allow the examiner to reli-
ably quantify the subject’s performance in the copy the
pentagons test. This test demands the subject t o copy a
simple drawing template. Both the drawing template
and the resulting SCPT along with the scoring method
developed by the current study are shown in Additional
file 1. The test and its scoring method proved to be
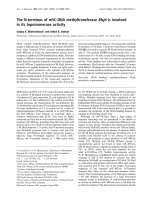
satisfactory reliable and s table. It is not clear whether it
is also sensitive to change after treatment. In one
patient, performance improved after 2 months of anti-
psychotic treatment (Figure 2). However, it is still neces-
sary to apply the test to different patient populations,
especially to pa tients suffering from ‘organic’ brain dis-
ease, before and after therapeutic intervention.
Table 5 Factor analysis of Standardised Copy of
Pentagons Test (SCPT) items (varimax normalised
rotation) of the whole sample
Factor
1
Factor
2
Factor
3
Factor
4
Factor
5
Factor
6
SCPT-1 -0.11 0.82 0.14 -0.07 -0.05 -0.06
SCPT-2 0.14 0.40 0.05 -0.22 0.57 0.05
SCPT-3 0.23 0.77 -0.09 0.17 0.04 0.03
SCPT-4 -0.01 0.02 0.01 0.10 0.07 -0.86
SCPT-5 0.61 0.04 0.37 -0.09 -0.09 0.02
SCPT-6 0.73 0.18 0.03 0.20 0.07 -0.16
SCPT-7 0.82 -0.05 -0.05 0.08 0.05 0.06
SCPT-8 -0.02 0.03 0.02 0.75 -0.12 -0.20
SCPT-9 0.43 0.02 0.05 -0.26 0.05 -0.45
SCPT-10 -0.03 -0.15 0.03 0.15 0.84 -0.12
SCPT-11 0.15 -0.02 0.76 0.11 0.00 -0.10
SCPT-12 -0.02 0.07 0.83 -0.03 0.08 0.07
SCPT-13 0.19 0.02 0.07 0.67 0.24 0.24
Percentage of
total
15% 11% 11% 10% 9% 8%
Total variance explained 64%
Values significant at P < 0.05 are shown in bold.
Table 6 comparison between the two diagnostic groups
(one-way ANOVA) concerning SCPT subscales comparison
between the two diagnostic groups (one-way ANOVA)
concerning SCPT subscales
Normal
controls
Patients with
schizophrenia
P value
Mean SD Mean SD
Deficit index (DcI) 478.12 43.56 465.96 72.46 < 0.001
Missing angles (MA) 297.89 14.36 286.04 43.97 0.01
Size (S) 180.22 37.34 179.91 40.98 NS
Deformation index (DfI) 909.11 135.16 808.67 146.86 NS
Proportion (P) 324.95 86.49 279.44 95.27 < 0.001
Quality of lines (QL) 141.53 55.94 97.24 60.37 < 0.001
Correction (C) 147.63 47.46 136.99 51.65 NS
Image distortion (ID) 290.82 34.66 287.86 34.18 NS
Close-in index (CiI) 241.53 55.94 197.24 60.37 NS
Quality of lines (QL) 141.53 55.94 97.24 60.37 < 0.001
Close-in (CI) 100.00 0.00 100.00 0.00 NS
Table 7 Correlation coefficients among the Standardised
Copy of Pentagons Test (SCPT) subscales
PMAQLIDS C
Proportion (P)
Missing angles (MA) 0.28
Quality of lines (QL) 0.24 0.16
Image distortion (ID) 0.13 0.04 0.08
Size (S) 0.18 0.56 0.11 0.08
Correction (C) 0.45 0.18 0.10 0.04 0.14
Close-in (CI) 0.01 0.06 0.06 -0.02 -0.03 -0.04
Table 8 Factor analysis of the subscales (second order
factor analysis)
Second-order
factor 1
Second-order
factor 2
Second-order
factor 3
Factor 1 0.17 0.81 0.09
Factor 2 0.86 0.16 0.12
Factor 3 0.10 0.41 0.49
Factor 4 0.02 0.30 0.03
Factor 5 0.89 0.06 -0.05
Factor 6 0.08 0.78 -0.11
Factor 7 -0.01 -0.13 0.89
Explained variance 1.57 1.57 1.06
Proportion of
variance explained
22% 22% 15%
Total variance
explained
- - 59%
Values significant at P < 0.05 are shown in bold.
Fountoulakis et al. Annals of General Psychiatry 2011, 10:13
/>Page 7 of 10
The scoring method is such that it allows for maxi-
mum contrast and differentiation between normal sub-
jects and psychiatric patients. It also leaves little space
for subjective assessment. In essence, the proposed scor-
ing method expands levels 2-4 of the Bender-Gestalt
scoring system.
Although some of the correlation coefficients among
individual SCPT items were significant, overall each
item assesses a distinct issue. This is also reflected in
factor analysis. The six factors that emerge explain
roughly 10% of the total variance each and 64% com-
bined. The SCPT can be divided into subscales on the
basis of the factor analysis and i ts interpretation. In this
way, six subscales can be created. The first factor
includes items 5, 6, 7 and 9 and largely reflects ‘propor-
tion’ . Thus it may constitute the basis of a subscale
named ‘proportion’ (P). The second one includes items
1, 2 and 3 and reflects the number of missing angles in
thedrawing.Thusitconstitutesthebasisofasubscale
under the title ‘ missing angles’ (MA). The third factor
includes items 11 and 12 and reflects the quality of the
line drawing in the shape. The resulting subscale is
named ‘quality of lines’ (QL). The fourth factor includes
items 8 and 13 (and 14, although that item’svariance
did not permit to include it in the factor analysis) and is
an index of image disto rtion, and constitutes the basis
of the ‘image distortion’ (ID) subscale. The fifth includes
Table 9 Discriminant function analysis results
Diagnosis Percentage
classified
correct
Classified as
normal
controls
Classified as
schizophrenic
patients
Total
Normal
controls
63.44 59 31 90
Schizophrenic
patients
75.59 34 96 130
Total 70.45 93 127 220
Table 10 Discriminant function analysis coefficients
Normal
control
function
coefficients
Schizophrenic
patient
function
coefficients
Difference
of
coefficients
Final
function
coefficient
(difference ×
1000)
Constant -73.025 -68.569 -4.456 -4456
SCPT-1 0.732 0.729 0.003 3
SCPT-2 0.173 0.164 0.009 9
SCPT-3 0.046 0.036 0.01 10
SCPT-4 0.038 0.032 0.006 6
SCPT-5 0.026 0.022 0.004 4
SCPT-6 -0.05 -0.048 -0.002 -2
SCPT-7 0.065 0.053 0.012 12
SCPT-8 0.228 0.234 -0.006 -6
SCPT-9 0.052 0.051 0.001 1
SCPT-10 0.052 0.061 -0.009 -9
SCPT-11 0.024 0.015 0.009 9
SCPT-12 0.01 -0.005 0.015 15
SCPT-13 0.117 0.113 0.004 4
SCPT = Standardised Copy of Pentagons Test.
Table 11 Inter-rater and test-retest reliability coefficients
Item Inter-rater reliability Test-retest reliability
SCPT-1 - 0.56
SCPT-2 0.81 -0.03
SCPT-3 0.55 -
SCPT-4 0.86 -0.02
SCPT-5 0.46 0.27
SCPT-6 0.61 0.51
SCPT-7 0.63 0.24
SCPT-8 0.48 -
SCPT-9 0.70 -0.12
SCPT-10 0.66 0.29
SCPT-11 0.71 0.70
SCPT-12 0.14 0.46
SCPT-13 0.48 -0.03
SCPT-14 - -
SCPT-15 - -
SCPT 0.52 0.46
Deficit index (DcI) 0.46 0.21
Missing angles (MA) 0.42 0.38
Size (S) 0.64 0.14
Deformation index (DfI) 0.66 0.33
Proportion (P) 0.62 0.39
Quality of lines (QL) 0.43 0.57
Correction (C) 0.81 -0.04
Image distortion (ID) 0.41 -0.03
Close-in index (CiI) 0.38 0.57
Close-in (CI) - -
SCPT = Standardised Copy of Pentagons Test.
Figure 2 Improvement in the performance in the copy of
pentagons task in a patient after 2 months of antipsychotic
treatment.
Fountoulakis et al. Annals of General Psychiatry 2011, 10:13
/>Page 8 of 10
items 2 (again) and 10 and reflects differences in size
between the template and the shape designed by the
subject, thus being the basis of the ‘size’ (S) subscale.
The sixth factor includes items 4 and 9 (again) and
reflects correction efforts, giving rise to the ‘correction’
(C) subscale. A final subscale, which includes only item
15 and is named ‘closing-in’ (CI), should be added. Schi-
zophrenic patients differ from con trols in P, MA and
QL but not concerning the rest subscales.
Correlations among these subscales are significant but
weak. The factor analysis of these subscales produced
three superfactors, named ‘indices’ .Thefirst(subscales
MA and S) constitutes the ‘deficit index’ (DcI), while the
second (subscales P, QL and C) is the ‘deformation index’
(DfI). The third index (subscales QL and CI) is the ‘clos-
ing-in index’ (CiI). It is important to note that all the
items of the SGST included in the DcI are easy for the
normal subject, while the more difficult ones (2, 5 and 8)
are included in the DfI. Patients differ from controls con-
cerning DfI and CiI indices (P <0.001)butnotDcI.In
the context of the above, the SCPT is divided into the
following three indices and six subscales:
a. Deficit index (DcI), wh ich includes the following
two subscales:
1. Missing angles (ME) subscale (items 1, 2 and
3)
2. Size (S) subscale (items 2 and 10).
b. Deformation index (DfI), which includes the fol-
lowing three subscales:
1. Proportion (P) subscale (items 5, 6, 7 and 9)
2. Quality of lines (QL) subscale (items 11 and
12)
3. Corrections (C) subscale (items 4 and 9)
4. Image distortion (ID) subscale (items 8, 13
and 14).
c. Closing-in index (CiI), which includes the follow-
ing two subscales:
1. Quality of lines (QL) subscale (items 11 and
12)
2. Closing-in (CI) subscale (item 15).
The correlations among the psychometric scales
(PANSS, YMRS and the MADRS) and individual items
and subscales of the S CPT revealed some very interest-
ingpoints(Table4).ThePANSS-Positivesubscalecor-
relates inversely with the DfI and Cil. The PANSS-
Negative subscale also correlates inversely with most
indices. PANSS-General Psychopathology correlates
again inversely with the DfI and Cil. The Y MRS does
not correlate with any index, and in the current study
it was used in order to have a measure to compare
with bipolar patients in future studies. The MADRS
correlat ed negatively with most indices. From the above
it is obvious that the relationship of schizophrenia and
its psychometric profile to the cognitive function as
ass essed by the SCPT is rather complex and non-linear,
and further research is necessary to uncover specific
issues and mechanisms.
We believe that future factor analysis with the inclu-
sion of different patient groups will help to further elu-
cidate the mechanism underlying the performance in
the SCPT.
Conclusions
In summary, the current study has developed a reliable
and valid instrument. The great advantage of this instru-
ment is the fact that it is paper and pencil, easily admi-
nistered and little time consuming and a ppropriate for
use in non-organic mental patients. Further research is
necessary to test its usefulness and its applications as a
neuropsychological test.
Additional material
Additional file 1: Standardised Copy of the Pentagons Test (SCPT).
Acknowledgements
The authors wish to thank Dr Symeon Deres, director of the Asklipeios Clinic,
Veroia, Greece, for his valuable help in the recruitment of patients
Author details
1
Third Department of Psychiatry, School of Medicine, Aristotle University of
Thessaloniki, Thessaloniki, Greece.
2
Asklipios Clinic, Veroia, Greece.
3
424
General Military Hospital of Thessaloniki, Thessaloniki, Greece.
4
School of
Medicine, Aristotle University of Thessaloniki, Thessaloniki, Greece.
5
Psychologist, Thessaloniki, Greece.
6
Fifth Inpatient Department of Psychiatry
and Outpatient Unit of Mood Disorders, Bakirköy State Teaching and
Research Hospital for Neuropsychiatry, Istanbul, Turkey.
Authors’ contributions
Konstantinos N Fountoulakis designed the study, analyzed the data,
interpreted the results, wrote the draft and subsequent versions and
finalized the manuscript
Melina Siamouli collected data, assisted in the interpretation of results, gave
input to revisions of the manuscript and approved the final version
Panagiotis T Panagiotidis collected data, assisted in the interpretation of
results, gave input to revisions of the manuscript and approved the final
version
Stamatia Magiria collected data, assisted in the interpretation of results, gave
input to revisions of the manuscript and approved the final version
Sotiris Kantartzis collected data, assisted in the interpretation of results, gave
input to revisions of the manuscript and approved the final version
Vassiliki A Terzoglou collected data, assisted in the interpretation of results,
gave input to revisions of the manuscript and approved the final version
Timucin Oral collected data, assisted in the interpretation of results, gave
input to revisions of the manuscript and approved the final version
Competing interests
The authors declare that they have no competing interests.
Received: 24 January 2011 Accepted: 11 April 2011
Published: 11 April 2011
Fountoulakis et al. Annals of General Psychiatry 2011, 10:13
/>Page 9 of 10
References
1. Bender L: On the Proper Use of the Bender Gestalt Test. Percept Mot Skills
1965, 20:189-190.
2. Bender L: The visual motor Gestalt function in 6- and 7-year-old normal
and schizophrenic children. Proc Annu Meet Am Psychopathol Assoc 1967,
56:544-563.
3. Brannigan GG, Decker SL: The Bender-Gestalt II. Am J Orthopsychiatry 2006,
76:10-12.
4. Brannigan GG, Brunner NA: Relationship between two scoring systems for
the modified version of the Bender-Gestalt test. Percept Mot Skills 1991,
72:286.
5. Brannigan GG, Brannigan MJ: Comparison of individual versus group
administration of the Modified Version of the Bender-Gestalt Test.
Percept Mot Skills 1995, 80:1274.
6. Brannigan GG, Barone RJ, Margolis H: Bender Gestalt signs as indicants of
conceptual impulsivity. J Pers Assess 1978, 42:233-236.
7. Decker SL, Allen R, Choca JP: Construct validity of the Bender-Gestalt II:
comparison with Wechsler Intelligence Scale for Children-III. Percept Mot
Skills 2006, 102:133-141.
8. Bender L: A Visual Motor Gestalt Test and its Clinical Use New York, USA:
American Orthopsychiatric Association; 1938.
9. Brannigan GG, Decker SL: Bender Visual-Motor Gestalt Test. 2 edition. Itasca,
IL: Riverside Publishing; 2003.
10. Folstein MF, Folstein SE, McHugh PR: “Mini-mental state”. A practical
method for grading the cognitive state of patients for the clinician.
J Psychiatric Res 1975, 12:189-198.
11. Folstein MF, Robins LN, Helzer JE: The Mini-Mental State Examination. Arch
Gen Psychiatry 1983, 40:812.
12. Wing J, Babor T, Brugha T: SCAN: Schedules for Clinical Assessment in
Neuropsychiatry. Arch Gen Psychiatry 1990, 47:589-593.
13. Strub R, Black F: The Mental Status Examination in Neurology. 2 edition.
Philadelphia, PA: FA Davis Company; 1989.
14. Fountoulakis KN, Panagiotidis PT, Siamouli M, Magiria S, Sokolaki S,
Kantartzis S, Rova K, Papastergiou N, Shoretstanitis G, Oral T, Mavridis T,
Iacovides A, Kaprinis G: Development of a standardized scoring method
for the Graphic Sequence Test suitable for use in psychiatric
populations. Cogn Behav Neurol 2008, 21:18-27.
15. KaySR,OplerLA,LindenmayerJP:The Positive and Negative Syndrome Scale
(PANSS): rationale and standardisation. Br J Psychiatry Suppl 1989, 7:59-67.
16. Young RC, Biggs JT, Ziegler VE, Meyer DA: A rating scale for mania:
reliability, validity and sensitivity.
Br J Psychiatry 1978, 133:429-435.
17. Montgomery SA, Asberg M: A new depression scale designed to be
sensitive to change. Br J Psychiatry 1979, 134:382-389.
18. Anastasi A: Psychological Testing. 6 edition. New York, USA: Macmillan
Publishing Company; 1988.
19. Altman D: Practical Statistics for Medical Research London, UK: Chapman and
Hall; 1991.
20. Bland J, Altman D: statistical methods for assessing agreement between
two methods of clinical measurement. Lancet 1986, 1:307-310.
21. Bartko J, Carpenter W: On the Methods and Theory of Reliability. J Nerv
Ment Disord 1976, 163:307-317.
22. Fotiou F, Fountoulakis K, Goulas A, Alexopoulos L, Palikaras A: Automated
standardized pupilometry with optical method for purposes of clinical
practice and research. Clin Physiol 2000, 20:336-347.
23. Fountoulakis KN, Iacovides A, Kleanthous S, Samolis S, Gougoulias K,
Tsiptsios I, Kaprinis GS, Bech P: Reliability, validity and psychometric
properties of the Greek translation of the Major Depression Inventory.
BMC Psychiatry 2003, 3:2.
doi:10.1186/1744-859X-10-13
Cite this article as: Fountoulakis et al.: The standardised copy of
pentagons test. Annals of General Psychiatry 2011 10:13.
Submit your next manuscript to BioMed Central
and take full advantage of:
• Convenient online submission
• Thorough peer review
• No space constraints or color figure charges
• Immediate publication on acceptance
• Inclusion in PubMed, CAS, Scopus and Google Scholar
• Research which is freely available for redistribution
Submit your manuscript at
www.biomedcentral.com/submit
Fountoulakis et al. Annals of General Psychiatry 2011, 10:13
/>Page 10 of 10