Báo cáo y học: "A standardized scoring method for the copy of cube test, developed to be suitable for use in psychiatric populations" pdf
Bạn đang xem bản rút gọn của tài liệu. Xem và tải ngay bản đầy đủ của tài liệu tại đây (400.33 KB, 10 trang )
PRIMARY RESEARCH Open Access
A standardized scoring method for the copy of
cube test, developed to be suitable for use in
psychiatric populations
Konstantinos N Fountoulakis
1*
, Melina Siamouli
2
, Stamatia Magiria
3
, Panagiotis T Panagiotidis
4
, Sotiris Kantartzis
2
,
Vassiliki A Terzoglou
5
and Timucin Oral
6
Abstract
Background: Although the ‘copy of cube test’, a version of which is included in the Short Test of Mental Status
(STMS), has existed for years, little has been done to standardize it in detail. The aim of the cur rent study was to
develop a novel and detailed standardized method of administration and scoring this test.
Methods: The study sample included 93 healthy control subjects (53 women and 40 men) aged 35.87 ± 12.62 and
127 patients suffering from schizophrenia (54 women and 73 men) aged 34.07 ± 9.83 years. The psychometric
assessment included the Positive and Negative Symptoms Scale (PANSS) the Young Mania Rating Scale (YMRS),
and the Montgomery-Åsberg Depression Rating Scale (MADRS).
Results: A scoring method was developed based on the frequencies of responses of healthy controls. Cron bach’s
a was equal to 0.75 and inter-rater reliability was 0.90. Three indices and five subscales of the Standardized Copy
of the Cube Test (SCCT) were eventually developed. They included the Deficit Index (DcI), which includes the
Missing Elements (ME) Mirror Image (M) subscales, the Deformation Index (DfI) which includes the Deformation (D)
and the Rotation (R) subscales and the Closing-In Index (CiI).
Discussion: The SCCT seems to be a reliable, valid and sensitive to change instrument for the testing of psychiatric
patients. The great advantage of this instrument is the fact that it only requires paper and a pencil, and is this
easily administered and brief. Further research is necessary to test its usefulness as a neuropsychological test.
Background
Thecopyofcubetaskisawellknown,simplepaper
and pencil test which is part of the Short Test of Mental
Status (STMS) [1,2]. Additionally,patternsofblocksof
cubes are incorporated in the Bender Gestalt Test
[3-11]. T his simple test demands the copy of a Necker
cube. This shape is an optical illusion first published in
1832 by th e Swiss crystallographer Louis Albert Necker,
and it is an ambiguous line drawing. In essence, it is a
wireframe drawing of a cube in isometric perspective.
This means that parallel edges of the cube are drawn as
parallel lines in the picture. The ambiguity lies in the
fact that when two lines cross, the picture does not
show which is in front and which is behind. This leads
to what is called multistable perception, since sometimes
the observer might experience the cube ‘ flipping’
between its two perceptual solutions.
This phenomenon is very interesting as it shows that
from an ambiguous picture, the human visual system
picks an interpretation of each part that makes the
whole c onsistent. Humans do not usually see an incon-
sistent interpretation of the cube (for example, an
impossible object). Most people see the lower-left face
as being in front, possibly because people view objects
from above, with the top side visible, far more often
than from below with the bottom visible, so the brain
selects as most probable the interpretation that the cube
is viewed from abov e. Thus, the use of the Necker cube
in neuropsyc hology has shed light on the human visual
system. The phenomenon has served as evidence of the
* Correspondence:
1
Third Department of Psychiatry, Aristotle University of Thessaloniki,
Thessaloniki, Greece
Full list of author information is available at the end of the article
Fountoulakis et al. Annals of General Psychiatry 2011, 10:19
/>© 2011 Fountoulakis et al; licensee BioMed Central Ltd. This is an Open Access article distribu ted und er the term s of the Creative
Commons Attribution License ( nses/by/2.0), which permits unrestricted use, distribution, and
reproduction in any medium, provided the original work is properly cited.
human brain being a neural network with two distinct
and equally possible interchangeable stable states [12].
The scoring method as indicated in the STMS rates
the performance from 0-2. Psychiatric patients, however,
including most patients with schizophren ia, are likely to
receive a score of 1 or 2, which is largely similar to con-
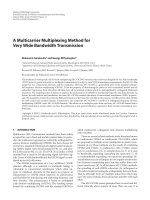
trols. Samples showing how patients with schizophrenia
perform in this task are shown in Figure 1. It is obvious
that by using these scoring methods to assess the draw-
ings of psychiatric patients, valuable information might
be lost.
The reversal of the perception of the Necker cube has
been extensively studied, but this is not the case concern-
ing its copying. To date no standardized method has been
developed. The aims of the current study were to develop
a novel and detailed standardized method of administra-
tion and scoring of the copy of the Necker cube test and
to preliminarily test this method in schizophrenic patients.
This new scoring method aims to be reliable, valid and
sensitive to change in response to treatment.
Methods
Study sample
The study sample included 93 healthy control subjects (53
women (56.98%) and 40 men (43.02%)) aged 35.87 ± 12.62
and 127 pat ients suffering from schizo phrenia accor ding
to Diagnostic and Statistical Manual of Mental Disorders
fourth edition, text revision (DSM-IV-TR) criteria (54
women (42.52%) and 73 men (57.48%)) aged 34.07 ± 9.83.
All subjects were physically healthy with normal clini-
cal and laboratory findings. All control subjects and
patients gave informed consent and the protocol
received approval from the Univer sity’s Ethics Commit-
tee. The patients were either inpatients or outpatients of
a private psychiatric clinic.
Clinical diagnosis
The diagnosis was set according to DSM-IV-TR crite ria
on the basis of a semistructured inter view based on the
Schedules for Clinical Assessment in Neuropsychiatry
(SCAN) version 2.0 [13].
The SCCT procedure
The SCCT procedure required the subject copy a
Necker cube. The template shape is shown in Figure 1
and in Additional file 1. The SCCT instructions ask the
subject to draw an id entical shape on the sam e piece of
paper. The template shape was printed on the left half
of the sheet leaving space for the subject to reproduce it
on the right. No time limit was set and no time record-
ing was made.
The assessment included the Random Letter Test for
the asses sment of attention and vigilance [14] to assure
that subjects could concentrate enough. This includes
the following four series’ of letters: LTPEAOAISTDA-
LAA, ANIABFSAMPZEOAD, PAKLATSXTOEABAA
and ZYFMTSAHEOAAPAT. The first and third group
include five ‘ A’ s, while the second and t he fourth
include four ‘A’s. The test requires the patient to hit the
desk when the examiner pronounces ‘A’. Errors of omis-
sion and commission are recorded. It is expected (and
verified in the present study) that the mean number of
errors expected from healthy controls in this test is
around 0.2. Both errors of omission and commission
were registered for this test.
The psychometric assessment
The psychometric assessment included Positive and
Negative Symptoms Scale (PANSS) [15], the Young
Mania Rating Scale (YMRS) [16], and the Montgomery-
Åsberg Depression Rating Scale (MADRS) [17] in order
Figure 1 Samples showing how patients with schizophrenia perform in the Necker cube test.
Fountoulakis et al. Annals of General Psychiatry 2011, 10:19
/>Page 2 of 10
to assess the clinical picture of patients. The PANSS
assesses psychotic symptoms, the YMRS manic symp-
toms and the MADRS depressive symptoms.
Raters
All authors served as r aters with regard to the psycho-
metr ic scales and neuropsychological testing. They were
not blind to clinical diagnosis. Only brief training was
given, as all of them were already experienced in the
field. There was no specific training concerning the
SCCT because the essence of the development proce-
dure was that the scoring directions included in the test
should be sufficient alone.
Statistical analysis
The statistical analysis included the development of fre-
quency tables for scores of healthy controls so as to
arrive at percentile score s and develop a scoring method
for the scale. The Pearson’s R correlation coefficient,
factor analysis (varimax normalized rotation) and item
analysis [18] (calculation of Cronbach’s a)wereusedto
explore the internal structure of the scale. Analysis of
variance [19], was used to testthedifferencebetween
groups, and was performed separately for subjects below
and above the age of 40. Discriminant function analysis
was also used to explore differences between groups and
the power of the scale in discriminating b etween them.
The P earson’s R correlation coefficient was calculated to
assess the inter-rater reliability. However, the calculation
of correlation coefficients is not a sufficient method to
test reliability and reproducibility of a method and its
results, because it is an index of correlation and not an
index of agreement [19-21]. The calculation of means
and standard deviations for each SCCT item and total
score during the rating by each examiner may provide
an impression of the stability of results.
Additionally, the means and the standard deviations of
the differences concerning each SCCT item between rat-
ing and re-rating were calculated and the plots of the
rating vs re-rating and difference vs average value for
each variable were created. In fact it is not possible to
use stati stics to define acceptable agreement [19]. How-
ever, these plots may assist decision. This method has
been used in previous studies concerning t he validation
of scientific methods [22,23].
Results
The frequency tables for scores of healthy controls are
shown in Table 1. In the same table the proposed scor-
ing for each item is also shown. This scoring method is
based on the frequencies of responses of healthy con-
trols (percentile scores).
Subjects were divided into those under and over the
age of 40 (for those bellow the age of 40: contro ls 28.57
Table 1 Frequencies of healthy controls’ performance in
each item and proposed standardized score
Raw score No. of observations % Standard score
Number of ‘A’ omissions
0 92 98.92 100
1 1 1.08 0
>1 0 0.00 0
Total 93 100.00
Number of ‘A’ intrusions
0 86 92.47 100
1 6 6.45 8
2 1 1.08 1
>2 0 0.00 0
Total 93 100.00
Missing lines (maximum 12)
0 90 96.77 100
1 2 2.15 2
2 1 1.08 1
>2 0 0.00 0
Lines which are not parallel
0 34 36.56 100
1 17 18.28 65
2 20 21.51 45
3 12 12.90 25
4 8 8.60 10
5 2 2.15 2
>5 0 0.00 0
Distorted lines
0 11 11.83 100
1 15 16.13 90
2 18 19.35 70
3 10 10.75 55
4 15 16.13 40
5 10 10.75 25
6 5 5.38 15
7 4 4.30 10
8 1 1.08 5
9 3 3.23 4
10 1 1.08 1
>10 0 0.00 0
Missing angles (maximum 26)
0 91 97.85 100
1-10 2 2.15 2
>10 0 0.00 0
Number of right angles which are not (maximum 12)
0 44 47.31 100
1 16 17.20 50
2 5 5.38 35
3 6 6.45 30
Fountoulakis et al. Annals of General Psychiatry 2011, 10:19
/>Page 3 of 10
± 7.18 years old vs patients 30.18 ± 6.30 years old, P =
0.09 and for those above the age of 40: controls 50.70 ±
6.90 years old vs patients 55.60 ± 9.90 years o ld, P =
0.001). The one-way analysis of variance (ANOVA)
rev ealed significant resu lts for subjects under the age of
40 (P < 0.001) but not for those above this age (P =
0.055). Note that SCCT-14 had no variance so it was
not included in the analysis. The results are shown in
Table 2 along with post hoc tests. This analysis made
the samples considerably smaller and, thus, this study
does not have adequate power to detect a difference
between healt hy controls and people with schizophren ia
in those over 40 and testing should be considered
exploratory. The results indicate that the difference
between healthy controls and patients with sch izophre-
nia gets smaller with age because the performance of
controls gets worse, even though patients were signifi-
cantly older in the above 40 years old group.
The Pearson’s R correlation coefficients among the
SCCT items in the total study sample are shown in
Table 3.
The Pearson’s R correlation coefficient, among the
SCCT items and the PANSS (Positive, Negative and
General Psychopathology scales), the YMRS and the
MADRS are shown in Table 4.
The results of the factor analysis (varimax normalized
rotation) are shown in Table 5. The analysis (by using
the Keiser-Fleish criterion of eigenvalues larger than 1)
produced four factors explaining 71% of the total var-
iance. The scores in the subscales created on the basis
Table 1 Frequencies of healthy controls ’ performance in
each item and proposed standardized score (Continued)
4 3 3.23 25
5 5 5.38 20
6 7 7.53 15
7 1 1.08 7
8 3 3.23 6
9 1 1.08 3
10 1 1.08 2
11 0 0.00 2
>11 1 1.08 1
Angles with different size than the template (maximum 26)
0 30 32.26 100
1 15 16.13 70
2 9 9.68 50
3 8 8.60 40
4 4 4.30 35
5 5 5.38 30
6 5 5.38 25
7 4 4.30 18
8 4 4.30 15
9 1 1.08 10
10 3 3.23 8
11 1 1.08 5
12 1 1.08 4
13 1 1.08 3
14 0 0.00 3
15 1 1.08 2
16 1 1.08 1
>16 0 0.00 0
Missing elements (maximum 7)
0 90 96.77 100
1 2 2.15 2
2 0 0.00 2
3 1 1.08 1
>3 0 0.00 0
Distorted elements (maximum 7)
0 19 20.43 100
1 22 23.66 80
2 13 13.98 55
3 14 15.05 40
4 9 9.68 27
5 8 8.60 17
6 1 1.08 8
7 7 7.53 7
Elements 1 and 2
0 31 33.33 100
1 62 66.67 67
Table 1 Frequencies of healthy controls ’ performance in
each item and proposed standardized score (Continued)
Elements 3, 4, 5 and 6
0 13 13.98 100
1 10 10.75 85
2 22 23.66 75
3 48 51.61 50
Three-dimensional level missing
0 90 96.77 100
1 3 3.23 3
2 0 0.00 0
Rotation
No 74 79.57 100
Yes 19 20.43 20
Mirror Image
No 89 95.70 100
Yes 4 4.30 4
Close-In
No 93 100.00 100
Yes 0 0.00 0
Fountoulakis et al. Annals of General Psychiatry 2011, 10:19
/>Page 4 of 10
of these factors and the differences between groups in
these scales are also shown in Table 6. The last SCCT
item (closing in) was included as a fifth subscale, since
it did not contribute to the factor analysis. The one-wa y
ANOVA revealed significant differences between the
two diagnostic groups and post hoc tests showed that
this difference concern ed the some of the subscales but
not all (P < 0.001; Table 6).
The correlation coefficients among these subscales are
shown in Table 7 and they are non-significant. A second
factor analysis of these subscales produced two superfac-
tors explaining 29% and 28% of total variance respec-
tively (Table 8).
Item analysis (calculation of Cronbach’s a) Cronbach’s
a was equal to 0.75, with no item increasing dramati-
cally the a coefficient when omitted.
The d iscriminant function analysis results are shown
in Tables 9 and 10. This analysis produced the following
function: when 2 × (SCCT-4) + 3 × (SCCT-5) + 2 ×
(SCCT-13) = >3 63.6 then the subject is likely to be a
healthy control rather than a schizophrenic patient. Thi s
function correctly classified 62.36% of controls and
89.76% of patients with schizophrenia, which is a satis-
factory performance.
The Pearson’s R correlation coefficient (R) for inter-
rater reliability is 0.90 for the total SCCT scale and
ranges from 0.51 to 0.90 for individual items (Table 11).
The calculation of means and standard deviations for
each SCCT item and total score for the rating and re-
rating as well as the respective plots and plots of di ffer-
ence vs ave rage value for each variable suggeste d that
the SCCT is reliable.
Discussion
The SCCT is a test of visual-motor ability and, although
several decades have passed since the copy of a cube
test was introduced, little has been done to standardize
it. This may be due to the complex pattern of these
tests and a preference of the examiners to score the m
on the basis of an ‘overall’ impression or ‘qualitatively’.
Table 2 Comparison of the scores of healthy controls and
schizophrenic patients above and below 40 years of age,
with t test as the post hoc test
Controls Patients with
Schizophrenia
Mean SD Mean SD P value
Below 41 years N = 60 N = 101
RLT-A 100.00 0.00 71.43 45.72 <0.001
RLT-B 84.14 21.31 65.00 40.05 <0.001
SCCT-1 100.00 0.00 79.16 40.67 <0.001
SCCT-2 63.10 35.20 41.70 35.12 <0.001
SCCT-3 57.06 30.57 41.14 29.21 0.001
SCCT-4 100.00 0.00 71.83 44.76 <0.001
SCCT-5 66.42 36.94 31.45 30.23 <0.001
SCCT-6 60.52 34.46 45.74 38.96 <0.05
SCCT-7 100.00 0.00 76.39 42.44 <0.001
SCCT-8 56.95 31.41 40.10 30.86 <0.001
SCCT-9 77.11 15.34 79.89 16.18 NS
SCCT-10 68.63 19.27 65.43 19.66 NS
SCCT-11 100.00 0.00 79.30 40.40 <0.001
SCCT-12 85.81 30.81 84.76 31.56 NS
SCCT-13 95.35 20.77 85.37 34.67 <0.05
SCCT-14 100.00 0.00 100.00 0.00 NS
SCCT 1,128.77 145.22 922.26 212.89 <0.001
Deficit Index (DcI) 496.63 17.82 395.61 150.78 <0.001
Missing Elements (ME) 400.00 0.00 310.82 153.23 <0.001
Mirror Image (M) 96.63 17.82 84.79 35.23 <0.05
Deformation Index (DfI) 182.60 34.11 169.74 47.19 NS
Deformation (D) 450.14 138.94 343.06 137.32 <0.001
Rotation (R) 85.96 30.70 84.95 31.42 NS
Closing-In Index (CiI) 100.00 0.00 100.00 0.00 NS
Above 40 years N = 33 N = 26
RLT-A 96.77 17.96 84.62 37.55 NS
RLT-B 87.13 15.98 62.46 43.00 <0.01
SCCT-1 93.65 24.60 77.23 42.40 NS
SCCT-2 61.68 29.48 39.65 38.03 <0.05
SCCT-3 53.39 30.58 27.69 26.87 <0.01
SCCT-4 93.68 24.47 58.38 49.56 <0.001
SCCT-5 58.00 38.12 33.12 26.16 <0.01
SCCT-6 54.65 35.07 32.15 30.93 <0.05
SCCT-7 93.65 24.60 73.46 44.59 <0.05
SCCT-8 58.61 32.58 31.77 31.08 <0.01
SCCT-9 78.71 16.05 77.15 15.53 NS
SCCT-10 63.23 18.42 56.73 15.10 NS
SCCT-11 90.61 29.15 73.42 44.66 NS
SCCT-12 79.35 35.58 72.31 38.81 NS
SCCT-13 96.90 17.24 96.31 18.83 NS
SCCT-14 100.00 0.00 100.00 0.00 NS
SCCT 1,076.10 190.59 849.38 188.07 <0.001
Table 2 Comparison of the scores of healthy controls and
schizophrenic patients above and below 40 years of age,
with t test as the post hoc test (Continued)
Deficit Index (DcI) 470.19 93.07 368.60 164.78 <0.01
Missing Elements (ME) 375.53 91.84 271.80 164.47 <0.01
Mirror Image (M) 94.67 22.30 96.80 17.53 NS
Deformation Index (DfI) 174.67 38.89 170.13 46.17 NS
Deformation (D) 427.53 143.18 312.57 126.38 0.001
Rotation (R) 80.00 35.13 73.33 38.36 NS
Closing-In Index (CiI) 100.00 0.00 100.00 0.00 NS
NS = not significant; RLT = random letter test; SCCT = Standardized Copy of
the Cube Test.
Fountoulakis et al. Annals of General Psychiatry 2011, 10:19
/>Page 5 of 10
Table 3 Pearson Correlation coefficients (R) among the Standardized Copy of the Cube Test (SCCT) items and random
letter test (RLT) scores in the total study sample
SCCT-1 SCCT-2 SCCT-3 SCCT-4 SCCT-5 SCCT-6 SCCT-7 SCCT-8 SCCT-9 SCCT-10 SCCT-11 SCCT-12 SCCT-13 SCCT
RLT-A 0.56 0.22 -0.03 0.59 0.26 0.23 0.58 0.10 -0.10 0.02 0.53 -0.02 -0.10 0.45
RLT-B 0.37 0.23 0.00 0.29 0.25 0.20 0.33 0.13 -0.03 0.09 0.42 0.05 0.03 0.37
SCCT-1 0.12 0.07 0.79 0.15 0.20 0.85 0.05 -0.23 -0.18 0.84 -0.03 -0.08 0.62
SCCT-2 0.37 0.20 0.55 0.45 0.16 0.57 0.21 0.38 0.13 0.05 -0.07 0.62
SCCT-3 0.16 0.41 0.15 0.10 0.39 0.13 0.21 0.09 0.03 0.05 0.47
SCCT-4 0.21 0.19 0.86 0.12 -0.16 -0.10 0.71 -0.05 -0.12 0.66
SCCT-5 0.39 0.18 0.52 0.18 0.25 0.21 0.16 0.06 0.65
SCCT-6 0.23 0.62 0.29 0.44 0.19 0.15 -0.04 0.63
SCCT-7 0.09 -0.22 -0.15 0.77 -0.09 -0.10 0.65
SCCT-8 0.38 0.59 0.08 0.15 0.10 0.67
SCCT-9 0.48 -0.19 0.03 -0.05 0.18
SCCT-10 -0.10 0.16 0.04 0.36
SCCT-11 0.00 -0.05 0.63
SCCT-12 -0.02 0.22
SCCT-13 0.08
Values significant at P < 0.05 are marked in bold. The variable SCCT-14 was excluded because of lack of variability.
Table 4 Pearson Correlation coefficients (R) among the SCCT items and the psychometric scales scores, in
schizophrenic patients
PANSS-Positive PANSS-Negative PANSS-General psychopathology YMRS MADRS
RLT-A 0.00 0.06 0.08 -0.14 -0.11
RLT-B -0.02 -0.03 -0.04 0.07 -0.16
SCCT-1 -0.12 -0.16 -0.15 -0.03 -0.14
SCCT-2 -0.15 -0.20 -0.21 -0.13 -0.14
SCCT-3 -0.11 -0.18 -0.13 0.01 -0.08
SCCT-4 -0.30 -0.34 -0.31 -0.39 -0.18
SCCT-5 -0.33 -0.29 -0.33 -0.18 -0.25
SCCT-6 -0.16 -0.09 -0.15 -0.01 -0.11
SCCT-7 -0.17 -0.20 -0.19 -0.10 -0.13
SCCT-8 -0.23 -0.17 -0.23 -0.10 -0.14
SCCT-9 0.00 0.05 0.00 0.10 -0.03
SCCT-10 -0.13 -0.13 -0.14 -0.05 -0.10
SCCT-11 -0.14 -0.20 -0.19 0.00 -0.23
SCCT-12 -0.06 -0.01 -0.12 -0.03 -0.19
SCCT-13 -0.18 -0.21 -0.22 -0.04 -0.21
SCCT-14
SCCT total -0.33 -0.34 -0.37 -0.16 -0.30
Deficit Index (DcI) -0.25 -0.30 -0.28 -0.16 -0.23
Missing Elements (ME) -0.21 -0.25 -0.23 -0.15 -0.19
Mirror Image (M) -0.18 -0.21 -0.22 -0.04 -0.21
Deformation Index (DfI) -0.15 -0.13 -0.22 -0.05 -0.27
Deformation (D) -0.25 -0.23 -0.27 -0.10 -0.19
Rotation (R) -0.06 -0.01 -0.12 -0.03 -0.19
Closing-In Index (CiI)
Close-In (CI) - - - -
Values significant at P < 0.05 are marked in bold. Item 14 has no variance so a correlation coefficient cannot be calculated for it.
MADRS = Montgomery-Åsberg Depression Rating Scale; PANSS = Positive and Negative Symptoms Scale; RLT = random letter test; SCCT = Standardized Copy of
the Cube Test; YMRS = Young Mania Rating Scale.
Fountoulakis et al. Annals of General Psychiatry 2011, 10:19
/>Page 6 of 10
Little data can be found in t he literature and even then
only because it is included in the STMS [1,2]. The
Bender Gestalt Test includes complex three-dimensional
figures constituted from many Necker cubes, but again
scoring i s simplistic [3-5,8-11]. Scoring is based on the
overall impression and quality of the drawing as well as
on common errors observed, and the focus is on detect-
ing ‘organic’ brain defects. However, in this way many
details in the performance o f patients may be lost, and
this is especially true when the test is used in psychiatric
populations.
The current study attempted to develop a standar-
dized scoring method that would allow the examiner to
reliably quantify the subject’s performance in the copy
the Necker cube test. This test requires the subject to
copy a simple drawing templ ate. Both the drawing tem-
plateandtheresultingSCCTalongwiththescoring
method developed by the current study are shown in
Additional file 1. The test and its scoring method
proved to be reliable and stable. There are some clues
that it could be also sensitive to change after treatment.
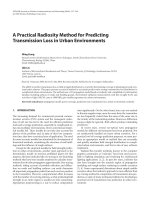
Anexampleofpossiblechangeafter2monthsofanti-
psychotic treatment is shown in Figure 2. However, tar-
geted research is necessary to show whether this is the
case and also it is necessary to apply the test to different
patient population, especia lly to patients suffering from
‘ organic’ brain disease, before and after therapeutic
intervention.
The scoring method is such that allows for maximum
contrast and differentiation between healthy subjects
and patients and simultaneously leaves little space for
subjective assessment. Largely, the scoring method
expands levels 2-4 of the Bender-Gestalt scoring system.
Further research is necessary to show whether such a
detailed approach adds substantially to th e understand-
ing of the neurocognitive deficit of mental patients or
simply consumes time.
Table 5 Factor analysis of Standardized Copy of the Cube
Test (SCCT) items (varimax normalized rotation) of the
whole sample
Factor 1 Factor 2 Factor 3 Factor 4
SCCT-1 0.94 -0.01 0.03 0.02
SCCT-2 0.17 0.74 -0.12 -0.11
SCCT-3 0.10 0.49 -0.49 -0.23
SCCT-4 0.89 0.10 0.02 -0.07
SCCT-5 0.21 0.63 -0.37 0.07
SCCT-6 0.21 0.71 0.15 0.20
SCCT-7 0.94 0.05 0.03 -0.06
SCCT-8 0.05 0.85 -0.15 0.09
SCCT-9 -0.31 0.60 0.31 -0.09
SCCT-10 -0.23 0.73 0.11 0.13
SCCT-11 0.89 0.04 -0.02 0.05
SCCT-12 -0.03 0.13 -0.04 0.94
SCCT-13 -0.14 -0.06 -0.76 0.08
SCCT-14 - - - -
Proportion total 28% 26% 9% 8%
Total variance explained 71%
Table 6 Comparison between the two diagnostic groups
(one-way analysis of variance (ANOVA)) concerning SCCT
subscales
Healthy
controls
Patients with
schizophrenia
Mean SD Mean SD P value
Deficit Index (DcI) 486.40 60.47 386.87 154.59 <0.001
Missing Elements (ME) 390.53 57.90 298.96 156.95 <0.001
Mirror Image (M) 95.87 19.58 87.91 31.97 <0.05
Deformation Index (DfI) 179.53 36.04 170.13 46.50 NS
Deformation (D) 441.29 140.27 334.48 134.20 <0.001
Rotation (R) 83.66 32.43 82.22 33.38 NS
Closing-In Index (CiI):
Close-In (CI) 100.00 0.00 100.00 0.00 NS
Table 7 Correlation coefficients among the SCCT
subscales
Mirror Image
(M)
Deformation
(D)
Rotation
(R)
Missing Elements
(ME)
-0.10 0.15 -0.05
Mirror Image (M) 0.02 -0.02
Deformation (D) 0.15
Close-In (CI) - - -
Table 8 Factor analysis of the subscales (second order
factor analysis)
Second-order
factor 1
Second-order
factor 2
Deficit Index (DcI)
Missing Elements (ME) 0.15 -0.80
Mirror Image (M) 0.12 0.61
Deformation Index (DfI)
Deformation (D) 0.76 -0.24
Rotation (R) 0.74 0.24
Closing-In Index (CiI)
Close-In (CI) - -
Explained variance 1.16 1.12
Proportion of variance
explained
29% 28%
Total variance explained 57%
Significant values are in bold. Because of lack of variability the CI subscale
was not included in the analysis.
Fountoulakis et al. Annals of General Psychiatry 2011, 10:19
/>Page 7 of 10
The results of the discriminant function analysis sup-
port the usefulness of this new scoring method. By
using the functions, the SCCT can assist in the differen-
tiation between patients with schizophrenia from healthy
controls. However, apart from discriminant function
analysis, we did not proceed to try to calculate sensitiv-
ityandspecificityforoneormorespecificcut-off
points, because the overlap between groups was signifi-
cant and the test se ems to be useful to assess aspects of
cognitive function but not as a specific diagnostic test
for a specific illness.
The correlation coefficients among individual SCCT
items, although some were significant, suggest that over-
all each item assesses a distinct issue. This is also
reflected in factor analysis. The four factors that emerge
explain 71% of the total variance. The SCCT can be
divided into subscales on the basis of the factor analysis
and its interpretation. In this way, five subscales can be
created. The first factor includes items 1, 4, 7 and 11
and i t constitutes the Missing Elements (ME) subscale.
The second includes items 2, 3, 5, 6, 8, 9 and 10 and it
constitutes the Deformation (D) subscale. The third
includes only item 13 and it constitutes the Mirror (M)
subscale. The fourth includes only item 12 and constitu-
tes the Rotation (R) subscale. Item 14 had no variability
and thus it constitutes a separate subscale, the Close-In
(CI) subscale.
Correlations among these subscales are very weak.
The factor analysis of these subscales produced three
superfactors, named ‘ indices’ .Thefirst(subscalesME
and M) constitutes the ‘ Deficit Index’ (DcI), while the
second (subscales D and R) is the ‘Deformation Index’
(DfI). The third index (subscale CI alone) is the ‘Clos-
ing-In Index’ (CiI). It is important to note that al l the
items of the SGST included in the DcI are easy for the
healthy subject, while the more difficult ones (2, 5 and
8) are included i n the DfI. Patients differ from controls
concerning DfI and CiI indices (P < 0.001) but not DcI.
In the frame of the above, the SCCT is divided into the
following three indices and five subscales:
(a) Deficit Index (DcI), which includes the following
two subscales: (1) Missing Elements (ME) subscale
(items 1, 4, 7 and 11); (2) Mirror Image (M) subscale
(item 13).
(b) Deformation Index (DfI), which includes the fol-
lowing two subscales: (3) Deformation (D) subsc ale
(items 2, 3, 5, 6, 8, 9 and 10)); (4) Rotation (R) subscale
(item 12).
(R) Closing-In Index (CiI), which includes the follow-
ing subscale: (5) Close-In (CI) subscale (item 14).
Further research is neces sary to elucidate the underly-
ing cognitive functions and deficits that are reflected in
Table 9 Discriminant function analysis results and function coefficients
Diagnosis Percentage classified correct Classified as healthy controls Classified as schizophrenic patients Total
Healthy controls 62.36 58 35 93
Schizophrenic patients 89.76 13 114 127
Total 78.18 71 149 220
Table 10 Discriminant function analysis results and
function coefficients
Healthy control function
coefficients
Schizophrenic patient
function coefficients
Constant -40.8311 -37.1956
SCCT-4 0.0034 -0.0189
SCCT-5 0.0058 -0.0194
SCCT-13 0.1766 0.1615
SCCT = Standardized Copy of the Cube Test.
Table 11 Inter-rater reliability coefficients
Item Inter-rater reliability (N = 35)
SCCT-1 0.90
SCCT-2 0.66
SCCT-3 0.78
SCCT-4 0.87
SCCT-5 0.73
SCCT-6 0.51
SCCT-7 0.82
SCCT-8 0.76
SCCT-9 0.78
SCCT-10 0.76
SCCT-11 0.87
SCCT-12 0.72
SCCT-13 0.86
SCCT-14 -
SCCT total 0.90
Deficit Index (DcI) 0.93
Missing Elements (ME) 0.93
Mirror Image (M) 0.86
Deformation Index (DfI) 0.66
Deformation (D) 0.83
Rotation (R) 0.72
Closing-In Index (CiI) -
Close-In (CI) -
CiI has no variability.
SCCT = Standardized Copy of the Cube Test.
Fountoulakis et al. Annals of General Psychiatry 2011, 10:19
/>Page 8 of 10
these indices and subscales. The correlations among the
psychometric scales (PANSS, YMRS and the MADRS)
and individual items and subscales of the SCCT revealed
some very interesting points (Table 4). The Deficit
Index correlates negatively with all psychometric scales.
The MADRS correlates also negatively with all subscales
and indices. Generally the correlation among the scoring
of the SCCT and the psychometric scales is significant.
The above suggest a complex neurocognitive profile for
schizophrenia as this is revealed by the SCCT. Further
research is necessary to uncover specific issues and
mechanisms. Commenting on these correlations is
beyond the scope of the current manuscript and the
data included here are insufficient as they do not focus
on this research target.
We believe that further factor analysis with the inclu-
sion of different patient groups will help to further elu-
cidate the mechanisms underlying performance in the
SCCT.
Conclusions
The current study has developed a reliable, valid and
maybe sensitive to change instrument. The great advan-
tage of this instrument is the fact that it only requires
paper and a pencil, and hence is easily administered and
brief. Further research is necessary to test its usefulness
as a neuropsychological test.
Additional material
Additional file 1: Standardized Copy of the Cube Test (SCCT). The
SCCT.
Acknowledgements
We wish to thank Dr Symeon Deres, director of the Asklipeios Clinic, Veroia
Greece, for his valuable help in the recruitment of patients.
Author details
1
Third Department of Psychiatry, Aristotle University of Thessaloniki,
Thessaloniki, Greece.
2
Asklipios Clinic, Veroia, Greece.
3
School of Medicine,
Aristotle University of Thessaloniki, Thessaloniki, Greece.
4
424 General Military
Hospital of Thessaloniki, Thessaloniki, Greece.
5
Psychologist, Thessaloniki,
Greece.
6
Fifth Inpatient Department of Psychiatry and Outpatient Unit of
Mood Disorders, Bakirköy State Teaching and Research Hospital for
Neuropsychiatry, Istanbul, Turkey.
Authors’ contributions
KNF designed the study, analyzed the data, interpreted the results, wrote
the draft and subsequent versions and finalized the manuscript. MS
collected data, assisted in the interpretation of results, gave input to
revisions of the manuscript and approved the final version. PTP collected
data, assisted in the interpretation of results, gave input to revisions of the
Figure 2 Examples of how performance on the Standardi zed Copy of the Cube Test (SCCT) changes after 2 months of antipsychotic
treatment.
Fountoulakis et al. Annals of General Psychiatry 2011, 10:19
/>Page 9 of 10
manuscript and approved the final version. StM collected data, assisted in
the interpretation of results, gave input to revisions of the manuscript and
approved the final version. SK collected data, assisted in the interpretation of
results, gave input to revisions of the manuscript and approved the final
version. VAT collected data, assisted in the interpretation of results, gave
input to revisions of the manuscript and approved the final version. TO
collected data, assisted in the interpretation of results, gave input to
revisions of the manuscript and approved the final version.
Competing interests
The authors declare that they have no competing interests.
Received: 4 March 2011 Accepted: 11 July 2011 Published: 11 July 2011
References
1. Kokmen E, Naessens JM, Offord KP: A short test of mental status:
description and preliminary results. Mayo Clinic Proc 1987, 62:281-288.
2. Kokmen E, Smith GE, Petersen RC, Tangalos E, Ivnik RC: The short test of
mental status. Correlations with standardized psychometric testing. Arch
Neurol 1991, 48:725-728.
3. Bender L: On the proper use of the Bender gestalt test. Percept Mot Skills
1965, 20:189-190.
4. Bender L: The visual motor Gestalt function in 6- and 7-year-old normal
and schizophrenic children. Proc Annu Meet Am Psychopathol Assoc 1967,
56:544-563.
5. Brannigan GG, Decker SL: The Bender-Gestalt II. Am J Orthopsychiatry 2006,
76:10-12.
6. Brannigan GG, Brunner NA: Relationship between two scoring systems for
the modified version of the Bender-Gestalt test. Percept Mot Skills 1991,
72:286.
7. Brannigan GG, Brannigan MJ: Comparison of individual versus group
administration of the modified version of the Bender-Gestalt test. Percept
Mot SKills 1995, 80:1274.
8. Brannigan GG, Barone RJ, Margolis H: Bender Gestalt signs as indicants of
conceptual impulsivity. J Pers Assess 1978, 42:233-236.
9. Decker SL, Allen R, Choca JP: Construct validity of the Bender-Gestalt II:
comparison with Wechsler Intelligence Scale for Children-III. Percept Mot
Skills 2006, 102:133-141.
10. Bender L: A Visual Motor Gestalt Test and its Clinical use New York, USA:
American Orthopsychiatric Association; 1938.
11. Brannigan GG, Decker SL: Bender Visual-Motor Gestalt Test. 2 edition. Itasca,
IL, USA: Riverside Publishing; 2003.
12. Einhauser W, Martin KA, Konig P: Are switches in perception of the
Necker cube related to eye position? Eur J Neurosci 2004, 20:2811-2818.
13. Wing J, Babor T, Brugha T: SCAN: Schedules for Clinical Assessment in
Neuropsychiatry. Arch Gen Psychiatry 1990, 47:589-593.
14. Strub R, Black F: The Mental Status Examination in Neurology.
Philadelphia, PA, USA: FA Davis Company;, 2 1989.
15. Kay SR, Opler LA, Lindenmayer JP: The Positive and Negative Syndrome
Scale (PANSS): rationale and standardisation. Br J Psychiatry Suppl 1989,
7:59-67.
16. Young RC, Biggs JT, Ziegler VE, Meyer DA: A rating scale for mania:
reliability, validity and sensitivity. Br J Psychiatry 1978,
133:429-435.
17. Montgomery SA, Åsberg M: A new depression scale designed to be
sensitive to change. Br J Psychiatry 1979, 134:382-389.
18. Anastasi A, Urbina S: Psychological Testing. 7 edition. >New York, USA:
Prentice Hall; 1997.
19. Altman D: Practical Statistics for Medical Research London, UK: Chapman and
Hall; 1991.
20. Bland J, Altman D: Statistical methods for assessing agreement between
two methods of clinical measurement. Lancet 1986, 1:307-310.
21. Bartko J, Carpenter W: On the methods and theory of reliability. J Nerv
Ment Disord 1976, 163:307-317.
22. Fotiou F, Fountoulakis K, Goulas A, Alexopoulos L, Palikaras A: Automated
standardized pupilometry with optical method for purposes of clinical
practice and research. Clin Physiol 2000, 20:336-347.
23. Fountoulakis KN, Iacovides A, Kleanthous S, Samolis S, Gougoulias K,
Tsiptsios I, Kaprinis GS, Bech P: Reliability, validity and psychometric
properties of the Greek translation of the Major Depression Inventory.
BMC Psychiatry 2003, 3:2.
doi:10.1186/1744-859X-10-19
Cite this article as: Fountoulakis et al.: A standardized scoring method
for the copy of cube test, developed to be suitable for use in
psychiatric populations. Annals of General Psychiatry 2011 10:19.
Submit your next manuscript to BioMed Central
and take full advantage of:
• Convenient online submission
• Thorough peer review
• No space constraints or color figure charges
• Immediate publication on acceptance
• Inclusion in PubMed, CAS, Scopus and Google Scholar
• Research which is freely available for redistribution
Submit your manuscript at
www.biomedcentral.com/submit
Fountoulakis et al. Annals of General Psychiatry 2011, 10:19
/>Page 10 of 10