Báo cáo y học: "Measurement of global functional performance in patients with rheumatoid arthritis using rheumatology function tests." ppsx
Bạn đang xem bản rút gọn của tài liệu. Xem và tải ngay bản đầy đủ của tài liệu tại đây (327.55 KB, 11 trang )
Open Access
Available online />R315
Vol 6 No 4
Research article
Measurement of global functional performance in patients with
rheumatoid arthritis using rheumatology function tests
Agustín Escalante, Roy W Haas and Inmaculada del Rincón
Division of Rheumatology and Clinical Immunology, Department of Medicine, The University of Texas Health Science Center at San Antonio, San
Antonio, TX, USA
Corresponding author: Agustín Escalante,
Received: 23 Dec 2003 Revisions requested: 26 Jan 2004 Revisions received: 2 Apr 2004 Accepted: 8 Apr 2004 Published: 21 May 2004
Arthritis Res Ther 2004, 6:R315-R325 (DOI 10.1186/ar1188)
http://arthr itis-research.com/conte nt/6/4/R315
© 2004 Escalante et al.; licensee BioMed Central Ltd. This is an Open Access article: verbatim copying and redistribution of this article are permitted
in all media for any purpose, provided this notice is preserved along with the article's original URL.
Abstract
Outcome assessment in patients with rheumatoid arthritis (RA)
includes measurement of physical function. We derived a scale
to quantify global physical function in RA, using three
performance-based rheumatology function tests (RFTs). We
measured grip strength, walking velocity, and shirt button speed
in consecutive RA patients attending scheduled appointments
at six rheumatology clinics, repeating these measurements after
a median interval of 1 year. We extracted the underlying latent
variable using principal component factor analysis. We used the
Bayesian information criterion to assess the global physical
function scale's cross-sectional fit to criterion standards. The
criteria were joint tenderness, swelling, and deformity, pain,
physical disability, current work status, and vital status at 6 years
after study enrolment. We computed Guyatt's responsiveness
statistic for improvement according to the American College of
Rheumatology (ACR) definition. Baseline functional
performance data were available for 777 patients, and follow-up
data were available for 681. Mean ± standard deviation for each
RFT at baseline were: grip strength, 14 ± 10 kg; walking
velocity, 194 ± 82 ft/min; and shirt button speed, 7.1 ± 3.8
buttons/min. Grip strength and walking velocity departed
significantly from normality. The three RFTs loaded strongly on a
single factor that explained ≥70% of their combined variance.
We rescaled the factor to vary from 0 to 100. Its mean ±
standard deviation was 41 ± 20, with a normal distribution. The
new global scale had a stronger fit than the primary RFT to most
of the criterion standards. It correlated more strongly with
physical disability at follow-up and was more responsive to
improvement defined according to the ACR20 and ACR50
definitions. We conclude that a performance-based physical
function scale extracted from three RFTs has acceptable
distributional and measurement properties and is responsive to
clinically meaningful change. It provides a parsimonious scale to
measure global physical function in RA.
Keywords: Factor analysis, functional performance, outcome assessment, rheumatoid arthritis
Introduction
Measurement of physical functional limitations in patients
with rheumatoid arthritis (RA) is a time-honored strategy to
assess the disease's outcome [1]. Performance-based
tests of physical function such as grip strength and walking
velocity were included in some of the earliest trials of
antirheumatic therapy [2]. These tests provide reproduci-
ble, quantitative information about a patient's current status
and about the prognosis [3,4]. In a paper describing the
behavior of functional tests over time in RA, Pincus and
Callahan made the analogy between them and commonly
used laboratory tests of other organs, referring to perform-
ance- and questionnaire-based measures as 'rheumatology
function tests' (RFTs) [4].
It is useful to consider RFTs within an overarching concep-
tual framework of the disease's outcome. We have pro-
posed a disablement framework for studying the
development of disability, and possibly other outcomes, in
RA [5]. The framework consists of a main disease–disabil-
ity pathway, which describes the sequential development
of pathology, impairment, functional limitation, and, finally,
disability [5-9]. Within this framework, performance-based
functional tests are well suited to quantify functional limita-
tions, because they entail measurement of physical actions
performed by the intact person [8]. A number of different
tests are available, and researchers often include more than
one in studies. However, the clinical literature is sparse in
guiding how to analyze or report research findings when
ACR20(50) = American College of Rheumatology 20% (50%) response criteria; BIC = Bayesian information criterion; MHAQ = modified health
assessment questionnaire; RA = rheumatoid arthritis; RFT = rheumatology function test; SD = standard deviation; SF36PF = short-form 36 physical
function scale
Arthritis Research & Therapy Vol 6 No 4 Escalante et al.
R316
multiple tests are used. The need for data parsimony may
sway investigators to report findings on less than the full set
of tests available. We are concerned that if researchers
choose this route, important information may be lost.
In an earlier analysis, we used principal component factor
analysis to extract the underlying latent variable from three
primary disability scales [10]. The distributional and meas-
urement characteristics of the latent disability scale were
better than those of the primary scales [10]. In the present
analysis, we used a similar approach to extract a global
physical performance scale from three primary perform-
ance-based RFTs: grip strength; walking velocity over 50
feet; and the timed shirt button test. The resulting latent
functional performance scale reflects overall physical func-
tion in RA. This data reduction approach may assist inves-
tigators who wish to quantify functional limitations in RA.
Materials and methods
Patients
From 1996 to 2000, we enrolled patients meeting the
1987 RA criteria [11] in a study of the disablement process
in RA [5]. We have described our sample in previous pub-
lications [12,13]. The study's acronym, ÓRALE (Outcome
of Rheumatoid Arthritis Longitudinal Evaluation), matches a
Mexican-American idiom for "Let's go!" Here, we will show
cross-sectional results obtained during the recruitment
evaluation of each participant.
Data-collection procedures
Our study was approved by the institutional review board of
each of the clinical facilities where we went to recruit
patients, and all patients gave their written, informed con-
sent. A physician or a research nurse, assisted by a trained
research associate, conducted evaluations at the clinic
where the patient was recruited. The evaluation lasted
approximately 90 minutes and consisted of a comprehen-
sive interview, a physical examination, a review of medical
records, and laboratory and x-ray tests. Interviews were
conducted in either English or Spanish, as preferred by the
patient.
Data elements
Demographics
We ascertained age, sex, and race/ethnicity by self-report
[12,13]. For race/ethnicity, we used the following question:
"In which of the following race or ethnic groups do you feel
you belong?" Patients could choose from 'White', 'Black',
'Asian', 'Hispanic', and 'Other'.
Musculoskeletal examination
A physician or research nurse, trained in joint examination
techniques, assessed 48 joints in each patient for the pres-
ence or absence of tenderness or pain on motion, swelling,
or deformity, as described elsewhere [14].
Pain
We asked patients to rate the amount of pain they experi-
enced due to their arthritis during the past week, on a
graded, horizontal 10-point scale that we have validated in
our patient population [15].
Global response measures
We used two scales to measure patients' overall condition.
The first, a global assessment of disease activity scale, was
completed by the examining physician or nurse. Raters
assessed the degree of inflammatory disease activity on a
10-point scale, ranging from 'mildest disease' to 'most
severe disease'. Raters were instructed to consider symp-
toms such as joint pain, stiffness, tenderness, and swelling,
as well as the presence of subcutaneous nodules, to rate
this variable. The second scale we used was the SF-36
general health subscale [16], which was administered by
an interviewer. Patients were asked to respond to the fol-
lowing five statements: (a) "In general, would you say your
health is:", with the response options 'excellent', 'very
good', 'good', 'fair', and 'poor'; (b) "I seem to get sick a little
easier than other people"; (c) "I am as healthy as anybody I
know"; (d) "I expect my health to get worse"; and (e) "My
health is excellent". Response choices for items (b) to (e)
were five-level Likert scales ranging from 'definitely true' to
'definitely false'. Responses to the five questions were
recoded, summed, and scaled to range from 0 to 100 [16].
Performance-based rheumatology function tests
We used the following tests:
1. Grip strength. This was measured with a hand-held
JAMAR
®
Dynamometer (Sammons Preston; Bolingbrook,
IL, USA). In a sitting position, with the elbow held at 90
degrees, and the forearm supported on a flat horizontal sur-
face, patients were asked to squeeze the handle with as
much as strength as possible. Three repetitions from each
hand were recorded, in kilograms. The mean value of all
repetitions for both hands is shown.
2. Walking velocity. Starting from a standing position,
patients were asked to walk at their usual pace for a dis-
tance of 50 feet, or 25 feet if they had difficulty covering the
full distance. No effort was made to conceal the stopwatch
used to time the patients. Results are expressed in feet per
minute. Patients unable to walk were assigned a velocity of
0 feet per minute.
3. Timed button test. Patients were asked to don a stand-
ard eight-button, men's or women's extra-large denim shirt
and fasten the front buttons (Wal-Mart; San Antonio, TX,
USA). A stopwatch was activated when the patient took the
shirt offered by the examiner, and stopped when the last
button was fastened. This test quantifies the performance
of large and small upper extremity joints. Results are
Available online />R317
expressed as buttons per minute. Patients unable to don
the shirt were assigned a score of 0 buttons per minute.
Physical disability measures
We used four measures:
1. The disability index of the Modified Health Assessment
Questionnaire (MHAQ) [17], a self-administered, 'arthritis-
specific' instrument which asks respondents to rate the
amount of difficulty they experience performing eight activ-
ities (dressing, getting out of bed, lifting a cup, walking,
bathing, bending, turning faucets, and getting in and out of
a car), on a scale ranging from 1 to 4 (without difficulty, with
some difficulty, with much difficulty, and unable).
2. The physical function scale of the SF-36 questionnaire
(SF36PF), an interviewer-administered, 'generic' instru-
ment [16]. The SF36PF asks respondents to rate the
amount of limitation caused by their health on 10 physical
activities (vigorous activities; moderate activities; carrying
groceries; climbing several flights of stairs; climbing one
flight of stairs; bending, kneeling or stooping; walking more
than a mile; walking several blocks; walking one block; and
bathing or dressing). Respondents rated each activity on a
three-level scale (a lot, a little, not at all). Item responses
were then summed and rescaled, with results expressed on
a scale ranging from 0 to 100, higher values representing
better function.
3. The Steinbrocker functional classification was used by
the physician or the research nurse, who were trained in
physical function assessment, to rate the extent of physical
disability on a four-level scale, ranging from Class I, "com-
plete functional capacity to carry out all usual duties without
handicaps", to Class IV, "largely or wholly incapacitated
with [the person] bedridden or confined to wheelchair . . ."
[18].
4. A latent physical disability variable was computed by
extracting the first principal component from the MHAQ,
SF36PF, and Steinbrocker scales, using factor analysis
[10]. We extracted this latent physical disability variable
scale using a procedure analogous to the one described
here for the global functional performance scale and
described in detail elsewhere [10].
Work status
We asked patients to describe their current work status
from among the following answers: working full-time; work-
ing part-time; retired; student; housewife; unemployed/laid
off; and disabled/unable to work. We used these
responses for two sets of analyses. For the first, patients
were classified as working (full- or part-time) vs not working
(all others); for the second, they were classified as disa-
bled/unable vs all others.
Vital status
We have recontacted the patients at yearly intervals since
their initial evaluation. For patients with whom we were not
able to establish contact, even through family members, we
searched publicly available death registries. We obtained a
death certificate for all patients who died.
Analysis
We performed a principal component factor analysis, using
the grip strength, walking velocity, and button speed, and
then extracted the first principal component from the unro-
tated factor loadings, using the least squares regression
method [19]. We rescaled the extracted factor to vary from
0 to 100 with a positive valence, higher values representing
less disability. We used the skewness and kurtosis test to
check each variable for departure from normality [20]. To
evaluate the degree of association between the new scale
and other study variables with interval or ratio distributions,
we used Pearson product moment correlation coefficients
[21]. Differences between the coefficients were tested
after Fisher's z-transformation [22], using the procedure
provided by Goldstein [23]. Because this required us to
perform a total of 21 correlation coefficient comparisons,
we considered coefficients to be significantly different only
if P was ≤0.002 for the comparison, adjusted according to
the Bonferroni technique (the conventional α = 0.05 ÷
number of comparisons = 21). To evaluate the association
of the new global functional performance scale with cate-
gorical criterion variables, we divided the new scale into
ordinal categories and used a chi-square to test the
strength of association [21]. We then evaluated the fit of
multivariable models that included the new global func-
tional performance scale, compared to models that
included the primary RFT. We asked the question: "Does a
multivariable model that includes the new global functional
performance scale fit criterion standards better than mod-
els that include the RFT?" Age and sex were included as
covariates in all these multivariable models, because they
can have a strong influence on any of the criterion meas-
ures we used. A simplified (without coefficients), general
form of the models we compared was
y = a + b + fp
where y could be any of the criterion standards (working
status, vital status, grip strength, etc.), a was age, b was
sex, and fp was one of the four functional performance
scales (grip strength, walking velocity, button speed, or the
new global functional performance scale). When y was a
categorical variable, the model was a logistic regression,
and when y was an interval or ratio variable, the model was
an ordinary least squares regression. We expected that the
fit of a multivariable model including the new global scale
on any of the criterion standards would be equivalent or
superior to the fit of models that include the three primary
Arthritis Research & Therapy Vol 6 No 4 Escalante et al.
R318
scales. We used the Bayesian information criterion (BIC) to
confirm this expectation [24]. The BIC varies inversely with
a model's fit: given two models, the one with the smaller or
more negative BIC has a better fit [24]. We used Raftery's
guidelines to interpret BIC differences between two mod-
els: a BIC difference >10 is considered 'very strong' evi-
dence in favor of the model with the smaller BIC; a
difference of >6 to 10 as 'strong'; >2 to 6 as 'positive'; and
0 to 2 as 'weak' evidence [24].
To assess the responsiveness of the primary RFT and the
global functional performance scales, we classified
patients as improved or unimproved. Available data allowed
us to compute the American College of Rheumatology pre-
liminary definition of improvement in RA, with one modifica-
tion [25]. The definition requires a 20% or 50%
improvement in both tender and swollen joint counts, plus
a 20% or 50% improvement in at least three of five addi-
tional measures. Four of these additional measures were
available to us: global assessment of disease activity com-
pleted by the examining physician or nurse, 10-point pain
scale, MHAQ, and ESR. In place of the patient global
assessment required by the definition [25], we substituted
the SF-36 general health subscale [16]. We calculated
change in the three primary RFTs and the global functional
performance scale as the difference between the baseline
and follow-up measurements. We used the change scores
among improved and unimproved patients to calculate
Guyatt's responsiveness ratio for each functional scale
[26]. Guyatt's ratio =
We performed all analyses on a desktop personal compu-
ter, using the Stata 8 software package (College Station,
Texas, USA).
Results
We recruited 779 patients from 1996 to 2000. The clinical
characteristics of the study sample have been described in
earlier publications [10,13]. The median age of the patients
was 57 years (range 19 to 90 years); 70% were women
and 56% were Hispanic. The median number of years of
formal education was 12 (range 0 to >16); 21% were
working full-time or part-time, and 27% were disabled from
work. The median disease duration was 8 years (range 0 to
52). Mean joint counts were 15 tender, 7 swollen, and 10
deformed. Subcutaneous nodules were present in 30% of
patients, and rheumatoid factor in 89%.
Of the 779 patients enrolled, 43 (5.5%) died before we
could conduct a follow-up functional performance assess-
ment. Of the remaining 736, we measured follow-up func-
tional performance in 676 (92% of survivors), a mean
period of 1.3 years after the baseline assessment (median
1 year, range 6 months to 5 years). An additional 48
patients died after the follow-up measurement, for a total of
101 deaths by July 2003. Significant differences at base-
line between the surviving patients who did not participate
in the follow-up and those who did participate included
slower walking velocity (179 vs 203 feet/minute; P = 0.02)
and slower shirt button speed (6.2 vs 7.7 buttons per
minute; P = 0.002) among patients without follow-up
assessment. There were no significant differences
between the two groups in age or sex, or in the number of
tender, swollen, or deformed joints.
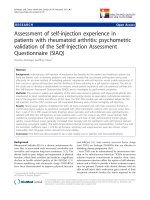
Figure 1 is a diagram of the factor analysis we used to
derive the global functional performance scale. The three
RFTs – grip strength, walking velocity and button speed –
loaded strongly on a single factor, with loadings ≥0.8. This
factor explained ≥70% of the primary variables' combined
variance. Uniqueness values were below 0.36 for each of
the primary variables, indicating that they share about two-
thirds of variance. We extracted the single factor without
rotation, using linear regression scoring, to derive the glo-
bal functional performance scale. The factor scoring coeffi-
cients used to derive the scale are shown in the following
formula, in which GFP = global functional performance, GS
= grip strength, WV = walking velocity, and BS = button
speed:
GFP = GS × 0.38033 + WV × 0.40709 + BS × 0.40508
Mean change among improved patients
Standard deviaion of ch
aange among stable patients
.
Figure 1
Diagram of the factor analysis conducted to extract the global func-tional performance scale (oval on left) from primary rheumatology func-tion tests measured on patients with rheumatoid arthritisDiagram of the factor analysis conducted to extract the global func-
tional performance scale (oval on left) from primary rheumatology func-
tion tests measured on patients with rheumatoid arthritis. The three
primary variables are represented by squares. The numbers next to
arrows from the extracted to the primary variables are factor loadings.
The numbers next to arrows from circles to primary variables represent
uniqueness (U), the proportion of the variable that cannot be explained
by the other primary scales.
Available online />R319
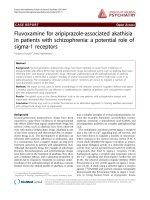
Figure 2 shows frequency distributions for the three pri-
mary scales and the derived global scale. The global func-
tional scale's distribution did not depart significantly from
the normal distribution on the skewness-kurtosis test (chi-
square 4.01 with 2 degrees of freedom, P = 0.13). In con-
trast, grip strength and walking velocity departed signifi-
cantly from normality (chi-square 155 and 10.4, P = 0.007
and ≤0.001, respectively), with shirt button speed as the
one primary test that had normal distribution (chi-square
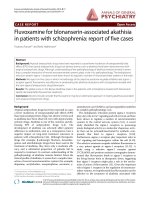
3.3, P = 0.19). Figure 3 depicts a matrix of bivariate distri-
butions between the three primary RFTs and the derived
global physical functions scale. The correlation between
the latter and the three primary RFTs was ≥0.8 in all three
cases.
Table 1 shows coefficients of correlation between each of
the RFTs, including the new global physical function scale,
and the criterion variables of joint tenderness, swelling, and
deformity; overall pain; the MHAQ and SF36PF scales, and
the Steinbrocker class; and the latent disability scale. For
19 of 24 comparisons, the strength of the correlation
between the global physical function scale and the criterion
variables was stronger than that between the primary RFTs
and the criterion variables.
Table 2 shows the BIC of models that contained age and
sex plus either the grip strength, walking velocity, shirt but-
ton speed, or global functional performance scale as inde-
pendent variables, with each of the criterion standards as
dependent variables. The fit of the models that included the
derived global scale was better than the fit of most of the
models that included the primary RFTs. This was evidenced
by smaller or more negative BICs on the better-fitting mod-
els, as shown in the table.
After a median period of one year, 119 patients (18%)
improved sufficiently to meet the ACR50 definition. An
additional 117 patients (17%) met the ACR20 definition of
improvement. Change in RFT and in the global functional
performance scale is shown in Table 3, according to the
Figure 2
Frequency distributions of the functional performance scales for 779 patients with rheumatoid arthritisFrequency distributions of the functional performance scales for 779 patients with rheumatoid arthritis. Values (range, mean ± SD) were grip
strength, 0–62 kg, 14 ± 10 kg; walking velocity, 0–429 feet/min, 194 ± 82 feet/min; shirt button speed, 0–23 buttons/min, 7.1 ± 3.8 feet/min; and
global functional performance, 0–100, 42 ± 19.
Arthritis Research & Therapy Vol 6 No 4 Escalante et al.
R320
level of ACR improvement. The responsiveness of all func-
tional tests was at least moderate. The largest Guyatt's
ratio was seen for the global functional performance scale,
suggesting that this scale is the most responsive to
improvement as defined here (Table 3).
We measured the correlation between assessments per-
formed at the baseline evaluation and the extent of physical
disability measured at follow-up (Table 4). Global functional
performance correlated significantly more strongly with
physical disability at follow-up than did any of the primary
RFTs. Global functional performance at baseline also had a
stronger correlation with follow-up physical disability than
did the baseline number of tender, swollen, or deformed
joints, or the baseline primary disability scales, MHAQ,
SF36 PF, or Steinbrocker class. Only the baseline latent
physical disability exceeded the global functional perform-
ance in its correlation with follow-up physical disability
(Table 4).
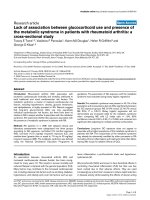
Figure 4 shows the relation between the global physical
function scale and the deformed-joint count, current work-
ing status, current disabled status, and death occurring
during the 6 years of observation covered by the present
report. For all comparisons, the global physical function
scale was strongly associated with the outcome.
Discussion
Our objective was to measure the degree of functional lim-
itation in a sample of RA patients. We elected three estab-
lished, performance-based RFTs: grip strength, walking
velocity, and the timed shirt button test [3]. We found evi-
dence that a new variable derived through a data reduction
process from the three tests performed better than the pri-
mary tests, while meeting the need for data parsimony.
To demonstrate the characteristics of the global functional
scale, we used a number of comparison variables, based
on the disablement process model [5,10]. Thus, our com-
Figure 3
Matrix plot showing the bivariate distribution of the three primary rheumatology function tests (grip strength, walking velocity, timed button test, and the global physical function scale) for 779 patients with rheumatoid arthritisMatrix plot showing the bivariate distribution of the three primary rheumatology function tests (grip strength, walking velocity, timed button test, and
the global physical function scale) for 779 patients with rheumatoid arthritis. The Pearson correlation coefficients of the global physical function
scale with grip strength = 0.80, with walking velocity = 0.86, and with the timed button test = 0.85. All coefficients were significant at P ≤ 0.0001.
Available online />R321
Table 1
Correlation between rheumatology function tests (RFTs) and variables measured as criterion standards in 779 patients with
rheumatoid arthritis
Primary RFT scales
Criterion variable Grip strength Walking velocity Button speed Derived global physical
function scale
Pain -0.16 -0.19 -0.13 -0.19**
Tender-joint count -0.44 -0.37 -0.34 -0.46**
Swollen-joint count -0.32 -0.16 -0.19 -0.27**
Deformed-joint count -0.36 -0.35 -0.45 -0.46**
MHAQ -0.54 -0.60 -0.53 -0.66***
SF36PF 0.52 0.65 0.55 0.68**
Steinbrocker Functional
Class
-0.47 -0.63 -0.59 -0.67***
Latent disability scale 0.59 0.72 0.64 0.78***
Pearson correlation coefficients were compared after Fisher's z-transformation [22,23]. Significance of comparisons was set at P ≤ 0.002.
**Correlation between criterion variable and global physical function is significantly stronger than with two of the primary scales. ***Correlation
between criterion variable and global physical function is significantly stronger than with three of the primary scales. MHAQ, Modified Health
Assessment Questionnaire; SF36PF, short-form 36 physical function scale.
Table 2
Comparative fit of multivariate models containing different rheumatology function tests.
Rheumatology function test scale included as independent variable in multivariate model
a
Primary RFT scale
Dependent variable Grip strength Walking velocity Button speed Derived global physical
function
b
Currently working -4430 -4455 -4438 -4462***
Currently disabled -4260 -4283 -4283 -4298***
Death within 6 years -4673 -4677 -4679 -4689***
Pain -159 -171 -156 -170**
Tender-joint count 828 894 907 824**
Swollen-joint count -69 -9 7 -37**
Deformed-joint count 556 620 571 535***
MHAQ scale -3788 -3880 -3816 -4002***
SF36PF scale -253 -695 -549 -763***
Steinbrocker functional
class
-3564 -3707 -3633 -3787***
Latent disability scale -3277 -3481 -3334 -3635***
Values shown are Bayesian information criteria.
a
Model's form was y = age + sex + physical disability scale, where y = dependent variable. For
current working, currently disabled and death by 6 years, the model was logistic; for other variables, model was ordinary least squares.
b
Extracted
from a principal component factor analysis of grip strength, walking velocity, and button speed (see Fig. 1). **Strong or very strong support in favor
of model that includes the latent variable, over two of the primary tests. ***Strong or very strong support in favor of model that includes the latent
variable, over three of the primary tests. MHAQ, Modified Health Assessment Questionnaire; RFT, rheumatology function test; SF36PF, short-form
36 physical function scale.
Arthritis Research & Therapy Vol 6 No 4 Escalante et al.
R322
parison criteria included key RA impairments such as the
amount of pain and the number of tender, swollen, and
deformed joints; and measures of physical disability,
including the MHAQ, SF36PF, and Steinbrocker functional
class, as well as current occupational status. To be consist-
ent with earlier studies of RFTs [4], we also included death
within 6 years as an outcome. We demonstrate significant
associations between the new global functional perform-
ance score and each of the comparison standards. We
chose the BIC as a comparative fit measure because it is a
tool used often for model selection [24,27]. We expected
that the models that included global functional perform-
ance scale would have smaller BICs, indicating better fit.
Indeed, this was usually the case: for nearly all of the crite-
rion variables, the fit of the global scale was superior to that
of the primary measures of grip strength, walking velocity,
or shirt button speed.
We also evaluated the ability of these performance-based
measures to respond to clinical change. With the data
available to us, we could compute the ACR20 and ACR50
improvement definitions, with one exception: we lacked a
patient global assessment scale [25]. In its place, we used
the general health subscale of the SF-36. We estimate that
the global functional performance scale is more responsive
to clinically significant improvement than are the primary
RFTs. However, it should be noted that improvement
among our patients was not in response to a specific inter-
Table 3
Responsiveness to change of rheumatology function test (RFT) scales in 676 patients with rheumatoid arthritis
Primary RFT scales
Status at follow-up n Grip strength change
a
(kg)
(mean ± SD)
Walking velocity change
a
(ft/min) (mean ± SD)
Button speed change
a
(buttons/min) (mean ± SD)
Global functional
performance change
a
(mean ± SD)
Unimproved 440 0.42 ± 5.31 5.08 ± 59.73 0.16 ± 2.90 0.92 ± 8.72
Improved ACR20 117 -2.94 ± 5.84 -19.74 ± 51.98 -1.18 ± 3.26 -5.48 ± 9.91
Guyatt's ratio
b
-0.55 -0.33 -0.40 -0.63
Improved ACR50 119 -4.54 ± 6.56 -30.30 ± 59.68 -1.54 ± 2.94 -7.86 ± 10.53
Guyatt's ratio
b
-0.85 -0.51 -0.53 -0.90
a
Change = baseline measurement minus follow-up measurement.
b
Guyatt's ratio is the mean change among improved patients divided by the
standard deviation of change among stable patients [26]. ACR20(50), American College of Rheumatology 20% (50%) response criteria; RFT,
rheumatology function test.
Table 4
Correlation between baseline measurements and the extent of physical disability at follow-up in patients with rheumatoid arthritis
Baseline measurement r value with physical disability at follow-up
a,b
P for comparison with global functional
performance
Global functional performance -0.72 Referent
Tender joint count 0.40 ≤0.001
Swollen joint count 0.19 ≤0.001
Deformed-joint count 0.36 ≤0.001
Pain 0.45 ≤0.001
Grip strength -0.52 ≤0.001
Walking velocity -0.69 0.03
Timed button test -0.59 ≤0.001
Steinbrocker functional class 0.62 ≤0.001
SF-36 physical function 0.67 0.02
MHAQ 0.65 ≤0.001
a
r, correlation between baseline measurements and level of physical disability after a median follow-up of 1 year.
b
Physical disability measured as
the first principal component of SF-36 physical function, MHAQ, and Steinbrocker class [10]. MHAQ = Modified Health Assessment
Questionnaire [17]; SF-36, short-form 36 questionnaire [16].
Available online />R323
vention. Because of this, further research is necessary to
test the responsiveness of the global functional perform-
ance scale to specific intervention, and to distinguish
between active drug and placebo in a clinical trial.
Pooled indices are often more reliable than the individual
components of an index [28]. This is most likely due to
improved capture of an underlying construct when multiple
scales are used, in contrast with a single instrument. There
are precedents in rheumatology for developing pooled
indices, usually as part of efforts aimed at measuring the
efficacy of antirheumatic drugs [29-32]. We have previ-
ously applied this data reduction strategy to develop a
physical disability scale, using a generic scale, an arthritis-
specific one, and an observer-assessed functional status
grade [10]. Similar processes could be applied to develop
summary scales for other RA dimensions, such as disease
damage or joint impairment.
The polyarticular nature of RA usually causes a global limi-
tation in joint function. This characteristic of RA makes a
global functional scale valuable for investigators who wish
to capture the full impact of RA on a patient's performance.
However, each of the RFTs we chose is influenced by dif-
ferent upper and lower extremity properties: hand prehen-
sile strength for the grip measure; large and small upper
extremity joint range and dexterity for the shirt button test;
and lower limb strength; joint stability; and overall balance
for walking velocity. The many-sided quality of the three
tests works against the aim of measuring global perform-
ance as a single construct. Our approach was to use
principal component factor analysis to extract the shared
Figure 4
Box–whisker plots showing the relation between the global functional performance scale and the comparison measures for 779 patients with rheu-matoid arthritisBox-whisker plots showing the relation between the global functional performance scale and the comparison measures for 779 patients with rheu-
matoid arthritis. The horizontal line in each box in the two top graphs represents the median, and the box height represents the interquartile range;
whiskers represent the range of adjacent data. The deformed-joint count (top left) decreased with rising global functional performance, trend P ≤
0.001; physical disability decreased (top right); trend P ≤ 0.001. The probability of working full-time or part-time increased (bottom left), and the
probability of work disability and death within 6 years decreased (bottom right); trend P ≤ 0.001 for each.
Arthritis Research & Therapy Vol 6 No 4 Escalante et al.
R324
component from the three scales. Indeed, the three primary
tests loaded strongly on a single factor that explained 70%
of the variance of the three scales.
We believe this approach is suited for research focusing on
RA patients' total level of functional limitation, as is the case
in our and other studies aiming to map the outcome of RA
in patients over time. It may also be a reasonable approach
to measure the effectiveness of therapies that reach all
joints, such as antirheumatic drugs. Although performance-
based RFTs such as grip strength or walking velocity were
often included in antirheumatic drug trials in the past, inves-
tigators did not attempt to condense them as we have
done. These tests have usually not been included in recent
trials of antirheumatic drugs. It may be of interest to re-eval-
uate the role of performance-based RFTs in antirheumatic
drug trials, using the approach we used here to tap into the
underlying construct. Our initial estimate of the responsive-
ness of the global scale responsiveness suggests that its
use could lead to more efficient clinical trials.
It should be mentioned that investigators who aim to meas-
ure regional joint performance more specifically can still do
so using the primary RFTs. For example, a study aiming to
assess the impact of lower-limb joint replacement on func-
tional performance may be better off using the walking
velocity. Likewise, interventions aimed at increasing upper-
limb performance may wish to use the grip strength or but-
ton speed instead of the global scale.
As we have pointed out previously [10], our approach is
data-driven. The global functional performance scale is
derived after all data collection has been completed.
Researchers planning to use the approach we have out-
lined can define the primary outcome scales in advance of
a study (i.e. grip strength, walking velocity, and button
speed in the present analysis). Expected effect sizes on the
extracted variable can be used to compute statistical
power and the needed sample size. As we have found, it is
likely that with this approach, the extracted latent variable
will exceed the primary scales in performance.
Conclusion
In conclusion, we have used principal component factor
analysis to derive a global functional performance scale to
measure the functional limitation stage in the process of
disablement in RA. The new variable outperforms the pri-
mary scales in a number of tests of association and fit with
criterion standards, and in response to clinically significant
change. This approach may be used to develop latent vari-
ables measuring other RA disease components, such as
disease activity and damage.
Competing interests
None declared.
Acknowledgements
This research was supported by an Arthritis Investigator Award and a
Clinical Science Grant from the Arthritis Foundation; and NIH grants
RO1-HD37151, K24-AR47530 and K23-HL004481, and grant M01-
RR01346 for the Frederic C Bartter General Clinical Research Center.
The authors thank Drs Ramon Arroyo, Daniel Battafarano, Rita Cuevas,
Alex de Jesus, Michael Fischbach, John Huff, Rodolfo Molina, Matthew
Mosbacker, Frederick Murphy, Carlos Orces, Christopher Parker, Tho-
mas Rennie, Jon Russell, Joel Rutstein, and James Wild, for giving us
permission to study their patients.
References
1. Decker JL, McShane DJ, Esdaile JM, Hathaway DE, Levinson JE,
Liang MH, Medsger TA, Meenan RF, Mills JA, Roth SH, Wolfe F:
Definition of elements pertaining to functional measurement.
In Dictionary of the Rheumatic Diseases, Volume 1: Signs and
Symptoms. American College of Rheumatology Glossary Commit-
tee. New York: Contact Associates International Ltd; 1982:63-68.
2. The Research Sub-committee of the Empire Rheumatism Council:
Gold therapy in rheumatoid arthritis. Final report of a multi-
center controlled trial. Ann Rheum Dis 1961, 20:315-334.
3. Pincus T, Brooks RH, Callahan LF: Reliability of grip strength,
walking time and button test performed according to a stand-
ard protocol. J Rheumatol 1991, 18:997-1000.
4. Pincus T, Callahan LF: Rheumatology function tests: grip
strength, walking time, button test and questionnaires docu-
ment and predict long term morbidity and mortality in rheuma-
toid arthritis. J Rheumatol 1992, 19:1051-1057.
5. Escalante A, del Rincón I: The disablement process in rheuma-
toid arthritis. Arthritis Rheum 2002, 47:333-342.
6. World Health Organization: International Classification of Impair-
ments, Disabilities and Handicaps. Geneva: WHO; 1980.
7. Nagi SZ: Disability concepts revisited: implications for preven-
tion. In Disability in America: Toward a National Agenda for Pre-
vention Edited by: Pope AM, Tarlov AR. Washington, DC: Division
of Health Promotion and Disease Prevention, Institute of Medicine,
National Academy Press; 1991:309-327.
8. Verbrugge LM, Jette AM: The disablement process. Soc Sci Med
1994, 38:1-14.
9. Brandt EN, Pope AM, Eds: Enabling America. Assessing the Role
of Rehabilitation Science and Engineering. Washington, DC:
National Academy Press; 1997.
10. Escalante A, del Rincón I, Cornell JE: A latent variable approach
to measuring physical disability in rheumatoid arthritis. Arthri-
tis Rheum 2004, 51:399-407.
11. Arnett FC, Edworthy SM, Bloch DA, McShane DJ, Fries JF, Cooper
NS, Healey NA, Kaplan SR, Liang MH, Luthra HS, Medsger TA Jr,
Mitchell DM, Neustadt DH, Pinals RS, Schaller JG, Sharp JT,
Wilder RL, Hunder GG: The American Rheumatism Association
1987 revised criteria for the classification of rheumatoid
arthritis. Arthritis Rheum 1988, 31:315-324.
12. del Rincón I, Battafarano DF, Arroyo RA, Murphy FT, Fischbach M,
Escalante A: Ethnic variation in the clinical manifestations of
rheumatoid arthritis. Role of HLA-DRB1 alleles. Arthritis Rheum
2003, 49:200-208.
13. del Rincón I, Battafarano DF, Arroyo RA, Murphy FT, Escalante A:
Heterogeneity between men and women in the influence of
the HLA-DRB1 shared epitope on the clinical expression of
rheumatoid arthritis. Arthritis Rheum 2002, 46:1480-1488.
14. Orces CH, del Rincón I, Abel MP, Escalante A: The number of
deformed joints as a surrogate measure of damage in rheu-
matoid arthritis. Arthritis Rheum 2002, 47:67-72.
15. Escalante A, Galarza-Delgado D, Beardmore TD, Baethge BA,
Esquivel-Valerio J, Marines AL, Mingrone M: Cross-cultural adap-
tation of a brief outcome questionnaire for Spanish-speaking
arthritis patients. Arthritis Rheum 1996, 39:93-100.
16. Ware JE Jr: SF-36 Health Survey. Manual and Interpretation
Guide Boston: Nimrod Press; 1993:321-322.
17. Pincus T, Summey JA, Soraci SA Jr, Wallston KA, Hummon NP:
Assessment of patient satisfaction in activities of daily living
using a modified Stanford Health Assessment Questionnaire.
Arthritis Rheum 1983, 26:1346-1353.
Available online />R325
18. Steinbrocker O, Traeger CH, Batterman RC: Therapeutic criteria
for rheumatoid arthritis. JAMA 1949, 140:659-666.
19. Norman GR, Streiner DL: Principal components and factor anal-
ysis. In Biostatistics. The Bare Essentials 2nd edition. Edited by:
Norman GR, Streiner DL. Hamilton, Ontario: BC Decker, Inc;
2000:163-177.
20. D'Agostino RB, Balanger A, D'Agostino RB Jr: A suggestion for
using a powerful and informative test of normality. Am Stat
1990, 44:316-321.
21. Daly LE, Bourke GJ, McGilvreay J: Interpretation and uses of
medical statistics. Oxford, UK: Blackwell Scientific Publications;
1991.
22. Meng X-L, Rosenthal R, Rubin DB: Comparing correlated corre-
lation coefficients. Psychol Bull 1992, 111:172-175.
23. Goldstein R: Testing dependent correlation coefficients. Stata
Tech Bull Reprints (STB32) 1997, 6:128-129.
24. Raftery AE: Bayesian model selection in social research. In
Sociological Methodology Edited by: Marsden PV. Cambridge,
MA: Blackwell; 1995:111-195.
25. Felson DT, Anderson JJ, Boers M, Bombardier C, Furst D, Gold-
smith C, Katz LM, Lightfoot R Jr, Paulus H, Strand V, Tugwell P,
Weinblatt M, Williams HJ, Wolfe F, Kieszak S: American College
of Rheumatology. Preliminary definition of improvement in
rheumatoid arthritis. Arthritis Rheum 1995, 38:727-735.
26. Guyatt G, Walter S, Norman G: Measuring change over time:
assessing the usefulness of evaluative instruments. J Chronic
Dis 1987, 40:171-178.
27. Zucchini W: An introduction to model selection. J Math Psychol
2000, 44:41-61.
28. Crocker L, Algina J: Introduction To Classical and Modern Test
Theory. New York: Holt, Rinehart & Winston; 1986.
29. Smythe HA, Helewa A, Goldsmith CH: "Independent assessor"
and "pooled index" as techniques for measuring treatment
effects in rheumatoid arthritis. J Rheumatol 1977, 4:144-152.
30. Prevoo MLL, van't Hof MA, Kuper HH, van Leeuwen MA, van de
Putte LBA, van Riel PLCM: Modified disease activity scores that
include twenty-eight joint counts. Development and validation
in a prospective longitudinal study of patients with rheumatoid
arthritis. Arthritis Rheum 1995, 38:44-48.
31. Smolen JS, Breedveld FC, Schiff MH, Kalden JR, Emery P, Eberl
G, van Riel PL, Tugwell P: A simplified disease activity index for
rheumatoid arthritis for use in clinical practice. Rheumatology
2003, 42:244-257.
32. Pincus T, Strand V, Koch G, Amara I, Crawford B, Wolfe F, Cohen
S, Felson D: An index of the three core data set patient ques-
tionnaire measures distinguishes efficacy of active treatment
from that of placebo as effectively as the American College of
Rheumatology 20% response criteria (ACR20) or the Disease
Activity Score (DAS) in a rheumatoid arthritis clinical trial.
Arthritis Rheum 2003, 48:625-630.