Báo cáo y học: "Acoustic stiffness and change in plug cartilage over time after autologous osteochondral grafting: correlation between ultrasound signal intensity and histological score in a rabbit model" pdf
Bạn đang xem bản rút gọn của tài liệu. Xem và tải ngay bản đầy đủ của tài liệu tại đây (1.62 MB, 13 trang )
Open Access
Available online />R492
Vol 6 No 6
Research article
Acoustic stiffness and change in plug cartilage over time after
autologous osteochondral grafting: correlation between
ultrasound signal intensity and histological score in a rabbit
model
Hiroshi Kuroki
1
, Yasuaki Nakagawa
2
, Koji Mori
3
, Mao Ohba
2
, Takashi Suzuki
2
, Yasuyuki Mizuno
2
,
Keiji Ando
2
, Makoto Takenaka
4
, Ken Ikeuchi
4
and Takashi Nakamura
2
1
Department of Physical Therapy, School of Health Sciences, Faculty of Medicine, Kyoto University, Kyoto, Japan
2
Department of Orthopaedic Surgery, Graduate School of Medicine, Kyoto University, Kyoto, Japan
3
Applied Medical Engineering Science, Graduate School of Medicine, Yamaguchi University, Yamaguchi, Japan
4
Institute for Frontier Medical Sciences, Kyoto University, Kyoto, Japan
Corresponding author: Yasuaki Nakagawa,
Received: 16 Mar 2004 Revisions requested: 21 Apr 2004 Revisions received: 11 Jun 2004 Accepted: 30 Jun 2004 Published: 14 Sep 2004
Arthritis Res Ther 2004, 6:R492-R504 (DOI 10.1186/ar1219)
http://arthr itis-research.com/conte nt/6/6/R492
© 2004 Kuroki et al.; licensee BioMed Central Ltd. This is an Open Access article: verbatim copying and redistribution of this article are permitted in
all media for any purpose, provided this notice is preserved along with the article's original URL.
Abstract
We investigated quantitative changes over time in ultrasound
signal intensity (an index of stiffness), signal duration (an index
of surface irregularity), and interval between signals (an index of
thickness) of plug cartilage in an animal model of autologous
osteochondral grafting. A full-thickness osteochondral plug was
surgically removed and replaced in male Japanese white rabbits
(n = 22). Specimens obtained at day 0 and weeks 2, 4, 8, 12
and 24 postoperatively were assessed using an ultrasound
system and by macroscopic and histological evaluation
(modified Mankin's score). Histology revealed that the plug sank
until 2 weeks postoperatively, and that newly formed cartilage-
like tissue covered the plug, but at 24 weeks the tissue
detached. The plug itself survived well throughout the period of
observation. Although the signal intensity at the plug site was
same as that in the sham operated contralateral knee at day 0,
from 2 to 24 weeks postoperatively it was less than that in the
sham knee. At 8 weeks, this difference was significant (P <
0.05). Modified Mankin's score revealed early degenerative
changes at the site, but macroscopic examination did not. Signal
intensity correlated significantly with score (both at day 0 and at
the five postoperative time points [P < 0.05, r = -0.91] and as a
whole [P < 0.05, r = -0.36]). Signal intensity also significantly
correlated with the individual subscores for 'cartilage structure'
(P < 0.05, r = -0.32) and 'cartilage cells' (P < 0.05, r = -0.30)
from the modified Mankin's score, but not significantly with
subscores for 'staining' and 'tidemark'. Signal duration
correlated significantly with total score (as a whole [P < 0.05, r
= 0.34]), but not significantly with the score for cartilage
structure (P = 0.0557, r = 0.29). The interval between signals
reflected well the actual thickness of the plug site. The
significant relationships between ultrasound signal intensity and
scores suggest that early degenerative changes in plug
cartilage and cartilage-like tissue, especially in the superficial
layer, are detectable by high-frequency ultrasound assessment.
Keywords: articular cartilage, high-frequency ultrasound, histology, osteochondral grafting surgery
Introduction
High-frequency pulse echo ultrasound techniques, which
reveal a number of features of normal and degenerated
articular cartilage [1-16], were recently introduced. The
ultrasound signal correlates strongly with thickness of car-
tilage [5,8,17,18]. The signal also provides information
about the integrity of the superficial zone of cartilage [1-
4,8] and about progression of osteoarthritis [6,7,9-15].
It is known that, if untreated, full thickness articular cartilage
damage will progress to osteoarthritis [19,20] because
articular cartilage has limited intrinsic healing ability [21].
Numerous attempts to induce healing of cartilage defects
have been made, but each treatment has strengths and
weaknesses [15]; therefore, regeneration and repair of
articular cartilage remains a clinical and scientific
challenge.
OCG = autologous osteochondral graft.
Arthritis Research & Therapy Vol 6 No 6 Kuroki et al.
R493
Autologous osteochondral grafts (OCGs) are used to treat
small, isolated articular cartilage defects. Successful clini-
cal treatment with OCGs has been reported, with few com-
plications at the donor site [22-27]. Using both
arthroscopic [22,23,28-31] and open surgical techniques
[24,25,32,33], this type of graft has been implanted in knee
joint and talus, and in end-stage osteochondritis dissecans
lesions of the humeral capitellum. A requirement of the
treatment is that the cylindrical plug of the autograft
includes both articular cartilage and underlying subchon-
dral bone [22-25,27-30] OCGs have several benefits,
including reliable bone union, high survival rate for grafted
cartilage, and little risk for disease transmission. In human
clinical and animal studies it has been shown that osteo-
chondral plugs maintain hyaline cartilage coverage over the
subchondral bone, and that the plugs retain their viability
and attach to the surrounding bone [22,24,27,34].
Using a high-frequency pulse echo ultrasound technique,
we found that the implantation procedure does not
adversely affect the stiffness, surface regularity and thick-
ness of OCG plug cartilage immediately after surgery (at
day 0) [13]. However, no research has yet focused on ultra-
sonographical and histological assessment of postopera-
tive changes in plug cartilage. We therefore investigated
changes over time in the plug cartilage after OCG in a rab-
bit model.
Methods
Animals
This investigation was approved by the Animal Research
Committee of the Kyoto University Graduate School of
Medicine (approval number Med Kyo 03155). Twenty-four
male Japanese white rabbits (Japan Animals Co. Ltd,
Osaka, Japan) were used. The rabbits were randomly
assigned to one of six groups defined by the time point at
which the animals were evaluated (day 0 [immediately after
surgery], and 2, 4, 8, 12 and 24 weeks after surgery; n = 4
in each group). The animals were maintained at the Institute
of Laboratory Animals, Graduate School of Medicine, Kyoto
University for 3 weeks before the start of the experiments.
They were housed, each in a separate cage, in a room
maintained at 22°C and 50% humidity, with a 14-hour light/
10-hour dark cycle, and were given food and water ad
libitum.
Osteochondral grafting
Intravenous pentobarbital sodium (25 mg/kg body weight)
was used to induce and maintain general anaesthesia. The
rabbits were placed supine, and the surgery was performed
on both knees. The lower limbs were disinfected, and 2 ml
of 0.5% lidocaine was injected subcutaneously into the
parapatellar region. A parapatellar incision was made to
expose the knee joint, and the patella was laterally
dislocated.
OCG was performed on the left knee (Fig. 1). A full thick-
ness cylindrical osteochondral plug (5 mm in diameter, 7
mm in depth), which went through the articular surface and
into the subchondral bone, was harvested using the Oste-
ochondral Autograft Transfer System (Arthrex, Naples, Flor-
ida). The Osteochondral Autograft Transfer System
'Recipient' Tube Harvester, 5 mm in diameter, was posi-
tioned on the patellar groove and was then driven into the
subchondral bone to a depth of 7 mm. During creation of
the hole, the harvester was maintained at a 90° angle to the
articular surface in both sagittal and coronal planes. After
insertion to 7 mm depth, the harvester was rotated 90°
clockwise and then 90° anticlockwise. The harvester was
then pulled out of the joint. The articular cartilage around
the hole was shaved in a 7 × 7 mm square with a chisel until
bleeding was observed from the subchondral bone. This
procedure of inducing bleeding is believed to accelerate
healing of surrounding cartilage, and some evidence has
been reported that the area is filled by newly formed repar-
ative tissue [23,26].
The harvested plug was then returned precisely to its orig-
inal site. Thus, the recipient hole was repaired with an autol-
ogous osteochondral plug that was of exactly the same size
as the hole. The chiselled area around the hole was left. The
joint capsule and skin incision were closed with 4-0 nylon
sutures.
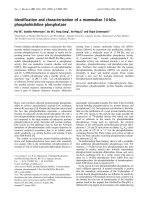
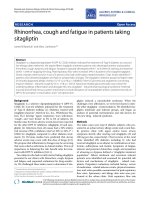
Figure 1
A diagram of surgical proceduresA diagram of surgical procedures. OCG, autologous osteochondral
grafts.
Left knee (OCG surgery):
1) A parapatellar incision
2) Patella was laterally dislocated
3) OCG was performed on the left knee
Harvesting a full-thickness cylindrical osteochondral plug
Shaving around the harvesting hole after harvesting
The plug was returned to its original site
4) Joint capsule and skin incision were closed with 4–0 nylon sutures
Right knee (sham operation):
1) A parapatellar incision
2) Patella was laterally dislocated
3) Exposure to air for almost same minutes with the OCG
4) Joint capsule and skin incision were closed with 4–0 nylon sutures
Available online />R494
Sham surgery was performed on the right knee as follows:
a parapatellar incision was made; the patella was laterally
dislocated; and then the joint capsule and skin incision
were closed, all over the same period of time as was
required for the OGC procedure (Fig. 1).
All rabbits were allowed to move freely in their cages after
the surgery. Two rabbits were excluded from the series;
one exhibited signs of infection 7 days after surgery and in
the other the plug was fractured during surgery. At day 0
(immediately after surgery; n = 3), or 2 (n = 3), 4 (n = 4), 8
(n = 4), 12 (n = 4) or 24 (n = 4) weeks after surgery, the
rabbits (with a weight [mean ± standard deviation] 3.2 ±
0.19 kg, range 2.8–3.6 kg) were killed by intravenous injec-
tion of a fatal dose of sodium pentobarbital. The implanted
osteochondral plugs, the articular cartilage of the defect,
and the intact region of the patellar groove were evaluated
macroscopically. The plug cartilage was assessed using an
ultrasound system and then evaluated histologically.
Ultrasound assessment
The ultrasound assessment system we used provides
quantitative information about tissue properties, and was
described previously (Fig. 2a) [10,13,14]. Briefly, the sys-
tem developed by Mori and coworkers [10] consists of a
transducer and a pulser/receiver (Panametrics Japan,
Tokyo, Japan), a digital oscilloscope and a personal
computer (Fig. 2a). The diameter of the transducer was
approximately 3 mm. The central frequency of the ultra-
sound wave was 10 MHz. As the wave passes through
interfaces between media of different acoustic imped-
ances, reflections return to the transducer and generate
electrical signals in the transducer that are proportional to
the intensity [35].
On examining cartilage, two large amplitude groups of
reflected waves were observed (Fig. 2b). By using appro-
priate wavelet transformation for these amplitude groups
[10,13,14], three properties of cartilage can be analyzed.
The first amplitude group (group N) represents the signal
from the surface of the cartilage, and the second (group K)
represents that from the subchondral bone (Fig. 2b). The
time interval (
µ
s) between the two signals represents the
thickness of the cartilage. The duration (
µ
s) of group N rep-
resents the irregularity of the cartilage, because diffused
reflection waves in a rough surface return to the ultrasound
transducer with a time delay. The intensity of group N is
proportional to the Young modulus of cartilage. The Young
modulus is determined using the following equations [13]:
Z =
ρ
V
R = (Z2 - Z1)/(Z2 + Z1)
Here, E is the Young modulus, V is the speed of sound, and
p is the density of a material. Z and R are the acoustic
impedance of a material and reflectance, respectively. In
the present study, Z2 is the acoustic impedance of articular
cartilage and Z1 is that of saline. Z1 is a constant (1.48 ×
V = (/)Ep
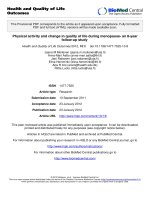
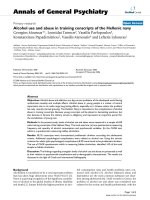
Figure 2
(a) The ultrasonic measurement system consists of a transducer, (a) a pulser/receiver, (b) a digital oscilloscope and (c) a personal computer(a) The ultrasonic measurement system consists of a transducer, (a) a
pulser/receiver, (b) a digital oscilloscope and (c) a personal computer.
The system can be used with (d, e) arthroscopy, (f) open surgery and
(g) saline bath for experimental purposes. The ultrasound wave output
from the transducer travels through saline. The reflected waves return
to the transducer and generate electrical signals in the transducer that
are proportional to the reflected wave intensity. (b) Typical ultrasound
echo (lower) and wavelet map (upper). The wavelet map was calculated
from the ultrasound echo using wavelet transform. The first (left) of the
two large amplitude groups was the echo (t = 2.0
µ
s: group N)
reflected from the cartilage surface, and the second (right; t = 3.9
µ
s:
group K) was reflected from the subchondral bone. The signal intensity
(maximum magnitude, as shown by the scale) of group N represents
cartilage stiffness. The time interval between groups N and K repre-
sents cartilage thickness. The signal duration of group N represents the
surface irregularity of the cartilage.
ab
c
d
e
Saline
Specimen
Transducer
f
g
(a)
(b)
Arthritis Research & Therapy Vol 6 No 6 Kuroki et al.
R495
10
6
kg/m
2
S at room temperature). From the three
equations above, the Young modulus of cartilage, E, is
given by the following:
The reflectance of cartilage in saline, R, is nearly 0.10. In
the case, E is proportional to R, if the density of cartilage,
P, is constant. The intensity of group N is directly propor-
tional to R. Consequently, the intensity of group N may be
used as an index of cartilage stiffness.
An indentation test demonstrated a significant relationship
between the intensity of group N and the aggregate modu-
lus [10], which is one of the indices of mechanical proper-
ties of articular cartilage [36,37]. As described above, in
theory it is reasonable to regard the intensity of the wave as
an index of stiffness of cartilage. The intensity was repre-
sented as relative values because the change in this index
was calculated from the three equations given above.
Therefore, we used signal intensity as an index of stiffness,
signal duration as an index of surface irregularity, and inter-
val between signals as an index of thickness.
The plug cartilage and the corresponding site on the sham
side were evaluated at three different sites: the center of
the plug, 0.25 mm distal to the center, and 0.25 mm proxi-
mal to the center.
Histological evaluation
For histological examination, the specimens were fixed in
10% neutral buffered formalin for 7 days, decalcified with
0.25 mol/l EDTA in phosphate-buffered saline (pH 7.4),
dehydrated in graded ethanol, and embedded in paraffin
wax. Sagittal sections (6
µ
m thick) were then cut, stained
with safranin-O/fast green and haematoxylin and eosin, and
examined microscopically. All sections were observed and
evaluated by three authors. Histological evaluation of plug
cartilage was performed using the modified Mankin's score
[38] (original score proposed by Mankin and coworkers
[39]). The grading system was composed of four catego-
ries – cartilage structure (6 points), cartilage cells (3
points), staining (4 points) and tidemark integrity (2 points)
– with a highest score of 14 points; normal cartilage scored
0 (Table 1) [38]. When we observed newly formed tissue
that covered the plug cartilage, the finding was counted as
'pannus and surface irregularities' (2 points).
Statistical analysis
Data for histological scores were analyzed statistically
using the nonparametric Kruskal-Wallis test and the post-
hoc Scheffe's F-test (for comparison between weeks post-
operatively), and using the Mann-Whitney U-test (for
comparison between grafted and sham sides). Ultrasound
data were analyzed using parametric repeated measures
analysis of variance and the post-hoc Scheffe's F-test. The
relationships between ultrasound data (mean of the three
measurements) and the score were analyzed using nonpar-
ametric Spearman's rank-order correlation.
Results
Macroscopic findings
Day 0 and postoperative week 2
At day 0 (Fig. 3a) the plug was intact and the margins
around the plug and the shaved square were clearly appar-
ent. At 2 weeks postoperatively (Fig. 3b) the margin around
the square could be clearly detected. Although the articular
surface of the plug was smooth and regular, the plug had
subsided a little.
Postoperative weeks 4 and 8
At 4 weeks (Fig. 3c) and 8 weeks postoperatively (Fig. 3d),
the site around and over the plug was filled with newly
formed reparative tissue. The margin around the plug and
the shaved square could be easily detected at 4 weeks. At
8 weeks postoperatively the margin was a little faint but still
detectable. Although the surfaces of the plug and the
defect looked irregular at 4 and 8 weeks, the plug was
glossy.
Postoperative weeks 12 and 24
The plug survived well and no osteoarthritic changes such
as osteophyte formation were observed at 12 weeks (Fig.
3e) and 24 weeks postoperatively (Fig. 3f). At 12 weeks
the margin around the plug and the shaved square was a
little faint but it was still detectable. At 24 weeks postoper-
atively, however, the margin was very faint. At 12 and 24
weeks, the surface of the plug cartilage was as smooth as
that of the adjacent intact cartilage. Although the plug and
intact cartilage were glossy in all of the specimens obtained
from 0 to 24 weeks, the appearance of the shaved area
was not so. In the shaved area, no reparative tissue was
observed throughout the 24 weeks. All sham-operated car-
tilage was grossly normal, and there was no evidence of
articular damage.
Histological findings
At day 0 and postoperative week 2
Histological examination at day 0 revealed that the plug had
been inserted flush with the surrounding articular surface.
The site of the defect (the shaved area) was clearly recog-
nizable because the cartilage around the plug had been
shaved until it bled (Fig. 4a,4b). At 2 weeks postoperatively
the plug had subsided a little and the newly formed tissue
covered half of the plug. No tissue was observed at the site
of the defect (Fig. 4c,4d). The actual thickness of cartilage
increased a little with the overlying tissue.
E
R1
R1
Z
2
1
2
=
−
×
+
ρ
Available online />R496
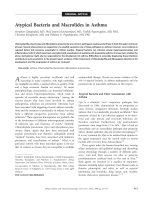
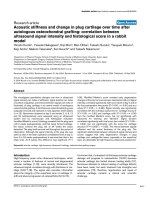
Figure 3
Macroscopic findingsMacroscopic findings. A full-thickness osteochondral plug of 5 mm in diameter and 7 mm in depth was harvested from the patellar groove. Articular
cartilage around the hole was shaved in a 7 × 7 mm square until bleeding from the subchondral bone was observed. The harvested plug was then
returned precisely to its original site. (a) At day 0, the plug was intact and the margin around the plug and the shaved square was clearly recogniza-
ble. (b) At 2 weeks postoperatively, the margin around the square could be clearly detected. Although the articular surface of the plug was smooth
and regular, the plug had subsided a little. (c) The margin around the plug and the shaved square could be easily detected at 4 weeks. (d) At 8
weeks postoperatively the margin was a little faint but could still be detected. At 4 (panel c) and 8 weeks (panel d), the site around and over the plug
was filled with newly formed reparative tissue. Although the surface of the plug and the defect looked irregular, the plug was glossy. (e) The margin
around the plug and the shaved square was a little faint but could still be detected at 12 weeks. (f) At 24 weeks postoperatively, however, the mar-
gin was very faint. The plug survived well and osteoarthritic changes such as osteophyte formation were not observed at 12 and 24 weeks postop-
eratively (panels e and f). The surface of the plug cartilage was as smooth as that of the adjacent intact cartilage.
Arthritis Research & Therapy Vol 6 No 6 Kuroki et al.
R497
Postoperative weeks 4 and 8
By 4 weeks postoperatively the implanted osteochondral
plug had united with the area of the subchondral bone (Fig.
4e,4f). Newly formed reparative tissue, which stained faintly
with safranin-O, covered the plug cartilage, and the plug
cartilage was well stained (Fig. 4e). At 8 weeks (Fig. 5a) the
plug cartilage was extremely well stained and was covered
with the newly formed tissue, which was partly stained. The
surface of the tissue was irregular. At 4 and 8 weeks post-
operatively, the actual thickness of cartilage increased with
the tissue. No reparative tissue was observed at the site of
the defect at 4 or 8 weeks postoperatively.
Postoperative weeks 12 and 24
Although the newly formed reparative tissue over the plug
cartilage was not distinctive on macroscopic observation at
12 weeks postoperatively (Fig. 3e), histological
observation revealed that reparative tissue covered the
plug cartilage (Fig. 5b). Actual thickness of cartilage
increased with the tissue. The tissue was faintly stained and
the plug was well stained (Fig. 5b). At 24 weeks postoper-
atively, no reparative tissue was observed over the plug
(Fig. 5c). Therefore, the actual thickness of cartilage
decreased at 24 weeks. The plug cartilage was stained
with the safranin-O but slightly less intensely than the intact
cartilage. No reparative tissue was observed at the site of
the defect at 12 or 24 weeks postoperatively.
Modified Mankin's score
The mean scores for the plug cartilage at day 0 and weeks
2, 4, 8, 12 and 24 postoperatively were 0.33, 1.67, 2.00,
2.75, 3.50 and 2.50, respectively. Those of the corre-
sponding sham-operated site were 0.00, 0.67, 0.00, 1.00,
Table 1
Modified Mankin's histological scores
Subscore Details
Cartilage structure
Normal 0
Surface irregularities 1
Pannus and surface
irregularities
2
Clefts to transitional zone 3
Clefts to radial zone 4
Clefts to calcified zone 5
Complete disorganization 6
Cartilage cells
Normal 0
Pyknosis, lipid degeneration
hypercellularity
1
Clusters 2
Hypocellularity 3
Safranin-O, thionine, Alcian blue
Normal 0
Slight reduction 1
Moderate reduction 2
Severe reduction 3
No staining 4
Tidemark integrity
Intact 0
Destroyed 1
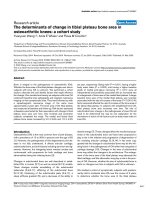
Figure 4
Safranin-O/fast green staining of plug cartilage and the shaved area (original magnification 10×)Safranin-O/fast green staining of plug cartilage and the shaved area
(original magnification 10×). (a, b) No abnormalities were observed at
day 0. The plug (between the arrows) was inserted flush with the sur-
rounding articular surface and the site of the shaved area (between the
triangles) was clearly recognizable. There was a space between the
plug and the surrounding tissue. (c, d) At 2 weeks postoperatively, the
plug (between the arrows) had subsided a little and newly formed tis-
sue covered half of the plug. No tissue was observed at the site of the
shaved area (between the triangles). There was a slight space between
the plug and the surrounding tissue. (e, f) The implanted osteochondral
plug (between the arrows) had united in the subchondral bone area by
4 weeks postoperatively. The newly formed reparative tissue, which
stained faintly with safranin-O, covered the plug cartilage and the plug
cartilage was well stained. No tissue was observed at the site of the
shaved area (between the triangles). Bony union was observed
between the plug and the host.
Available online />R498
0.50 and 0.75, respectively. No differences between
scores existed on the sham side, but on the grafted side the
scores differed significantly between day 0 and week 12
(Fig. 6; P < 0.05). Mann-Whitney U-test revealed that
scores between the right and left knees at 4, 12 and 24
weeks postoperatively were significantly different (P <
0.05).
Ultrasound data on cartilage
Signal intensity at day 0 was the same in the grafted and
sham sides at 1.5 (relative value). At 2 weeks postopera-
tively the signal intensity on both sides had decreased. The
decrease was not significant on the sham side, but it was
significant on the grafted side (P < 0.001; Fig. 7a and
Table 2). At 8 weeks, although signal intensity on both
sides had decreased, the difference was not significant on
the sham side but it was significant on the grafted side (P
< 0.001; Fig. 7a and Table 2). Between 2 and 24 weeks
postoperatively, the intensity on the grafted side was lower
than that on the sham side (P < 0.05 at 8 weeks; Fig. 7a).
At 24 weeks the values were 0.6 on the grafted side and
1.0 on the sham side.
Signal duration on day 0 was 0.6
µ
s on the grafted side and
0.5
µ
s on the sham side. At 2 and 8 weeks postoperatively,
the differences in signal duration between the sides were
0.2 and 0.3
µ
s, respectively (P < 0.05, Fig. 7b). At 12
weeks the difference in signal duration between the sides
was 0.1
µ
s. At 24 weeks postoperatively, the signal dura-
tion on both sides was approximately the same (0.5
µ
s; Fig.
7b).
At day 0 the interval between signals on both sides was the
same (0.5
µ
s). Between 2 and 8 weeks postoperatively, the
difference between them was 0.1 or 0.2
µ
s. At 12 weeks
the difference increased (0.3
µ
s), but at 24 weeks postop-
eratively no difference was observed between the two
sides (for both the interval was 0.6
µ
s; Fig. 7c).
Relationship between ultrasound data and modified
Mankin's score
Spearman's rank-order correlation revealed that the modi-
fied Mankin's score was significantly correlated with signal
intensity (P = 0.0176, r= -0.36; Fig. 8a) and with signal
duration (P = 0.0269, r = 0.34; Fig. 8b). The signal inten-
sity was also significantly correlated with the score for
category 'cartilage structure' in the modified Mankin's
score (P = 0.0343, r = -0.32; Fig. 8c) and that for 'cartilage
cells' (P = 0.0499, r = -0.30; Fig. 8d), but the correlation
was not significant for 'staining' or 'tidemark'. The correla-
tions between signal duration and the scores for structure
(P = 0.0557, r = 0.29) and cartilage cells (P = 0.4630, r =
Figure 5
Safranin-O/fast green staining of plug cartilage (original magnification 10×)Safranin-O/fast green staining of plug cartilage (original magnification
10×). (a) At 8 weeks the plug cartilage (between the arrows) was
extremely well stained and was covered with newly formed tissue,
which was stained partly and the surface of the tissue was irregular. (b)
At 12 weeks reparative tissue covered the plug cartilage (between the
arrows) and the tissue was faintly stained and the plug was well
stained. (c) At 24 weeks postoperatively no reparative tissue covered
the plug (between the arrows) and the plug cartilage was stained with
safranin-O, but slightly less strongly than the plug cartilage at 8 or 12
weeks.
Figure 6
The mean modified Mankin's scores of the plug cartilage (open circles) at day 0 (0D) and at weeks 2 (2W), 4 (4W), 8 (8W), 12 (12W) and 24 (24W) postoperatively were 0.33, 1.67, 2.00, 2.75, 3.50 and 2.50, respectivelyThe mean modified Mankin's scores of the plug cartilage (open circles)
at day 0 (0D) and at weeks 2 (2W), 4 (4W), 8 (8W), 12 (12W) and 24
(24W) postoperatively were 0.33, 1.67, 2.00, 2.75, 3.50 and 2.50,
respectively. Those of the corresponding sham site (closed circles)
were 0.00, 0.67, 0.00, 1.00, 0.50 and 0.50 points, respectively. The
Kruskal–Wallis test and Scheffe's F-test revealed that, on the grafted
side, the score differed significantly between day 0 and week 12 (* P <
0.05). Mann–Whitney U-test revealed that the score differed signifi-
cantly (P < 0.05) between the sham and experimental sites at 4, 12 and
24 weeks postoperatively (not indicated in the graph).
Arthritis Research & Therapy Vol 6 No 6 Kuroki et al.
R499
Figure 7
(a) Change over time in ultrasound signal intensity (an index of stiffness) of the plug site (open circles) and the sham side (closed circles)(a) Change over time in ultrasound signal intensity (an index of stiffness) of the plug site (open circles) and the sham side (closed circles). Intensity
is represented as relative values. Repeated measures analysis of variance and post-hoc test (Scheffe's F-test) revealed that the signal intensity of the
two sides differed significantly at 8 weeks (* P < 0.05) and that the signal intensity of the grafted side differed significantly among the groups (P val-
ues are presented in Table 2). Especially between day 0 (D0) and week 2 (2 W) and between weeks 4 (4 W) and 8 (8 W), the values differed sig-
nificantly (** P < 0.001), but there was no difference between 2 W and 4 W or among the groups 8 W, 12 W and week 24 (24 W). (b) Change over
time in signal duration (an index of surface irregularity) of the plug site and the sham side. Values are presented as
µ
s. Signal duration of the two
sides differed significantly at 2 W and 8 W (* P < 0.05). (c) Changes over time in interval between signals (an index of thickness) of the plug site and
the sham side. Values are represented as
µ
s. Values on both sides were the same (0.5
µ
s) at D0. After 2–8 weeks postoperatively, the values almost
paralleled each other and the difference between them was 0.1 or 0.2
µ
s. At 12 weeks the difference increased to 0.3
µ
s, but by 24 weeks postop-
eratively no difference was observed, at which time the value for both sides was 0.6
µ
s.
0.0
0.2
0.4
0.6
0.8
1.0
1.2
1.4
1.6
1.8
0D(N=3) 2W (N=3) 4W(N=4) 8W(N=4) 12W (N=4) 24W(N=4)
Intensity (index of stiffness)(relative value)
**
**
*
0.0
0.1
0.2
0.3
0.4
0.5
0.6
0.7
0.8
0.9
1.0
0D(N=3) 2W (N=3) 4W(N=4) 8W(N=4) 12W (N=4) 24W(N=4)
Duration time (index of surface irregularity)
(µsec)
*
*
0.0
0.2
0.4
0.6
0.8
1.0
1.2
0D(N=3) 2W (N=3) 4W(N=4) 8W(N=4) 12W (N=4) 24W(N=4)
Interval (index of thickness) (µsec)
(a)
(b)
(c)
Available online />R500
0.11) were not significant. When mean values for signal
intensity of the plug site were calculated among each of the
six postoperative groups, the mean signal intensity was
significantly and strongly correlated with the score (P =
0.0130, r = -0.91; Fig. 8e).
Discussion
Although the concept of ultrasound assessment is over a
decade old [1,2,35,40], new techniques continue to be
developed and reported. These techniques include meas-
urement of surface fibrillation [3] and tissue thickness
[6,8,9], comparison of the speed of sound [7], ultrasound
backscatter [11,41], needle probe [5], use of high fre-
quency (50 MHz) [4,41], real-time analysis [16], ultrasound
indentation [17] and mechano-acoustic diagnosis [12],
among others. It has been suggested that ultrasound exam-
ination is a sensitive method for evaluating structural prop-
erties [12,41], surface roughness [1-3] and cartilage
thickness [6,8,9,17,40]. In our system [10,13,14], wavelet
transformation was used to assess three indices, namely
signal intensity (an index of stiffness), signal duration (an
index of surface irregularity) and interval between signals
(an index of thickness) [10,13]. These three indices may
also be used in combination with arthroscopy, open sur-
gery and saline bath for experimental purposes (Fig. 2a). In
the present study we used the saline bath method.
After surgery, the signal intensity of the sham cartilage
dropped at 2 weeks and recovered 4 weeks postopera-
tively. At 8 and 12 weeks the intensity dropped again and
remained at this level until 24 weeks (Fig. 7a). The sham
cartilage was exposed to air for almost the same period of
time as was the OCG. Therefore, some effects of this expo-
sure might be present in both sham and plug cartilage. A
study reported that 30 min drying of cartilage resulted in
patchy necrosis [42]. Another study revealed that
ultrastructural changes occurred in chondrocytes after
arthrotomy with 1 hour exposure to air [43]. However, 6
weeks after the arthrotomy the chondrocytes had fully
recovered from the changes that were noted immediately
after exposure to air. Although we observed neither patchy
necrosis nor changes in chondrocytes in the sham knees,
exposure to air might have some harmful effects on carti-
lage stiffness.
In the plug site on the OCG side a postoperative drop in
intensity was also observed (Fig. 7a), but there were some
differences from the sham side. At 2 weeks postoperatively
the drop in intensity at the plug site was greater than that at
the sham site, and recovery 4 weeks postoperatively was
limited (Fig. 7a). Although the intensity in both the sham
and plug sites was reduced at 8 weeks, the difference
between sites was significant (P < 0.05). The intensity at
the plug site (about half that at day 0) was then maintained
until 12 weeks, but had again dropped a little at 24 weeks.
The OCG might have been responsible for these
differences.
Macroscopic observation revealed that surface of the plug
site survived well and underwent repair. At 24 weeks post-
operatively in particular, the surface was glossy and as
smooth as that of the adjacent, intact cartilage (Fig. 3f). His-
tological observation, on the other hand, revealed that the
plug had sunk or tilted a little at 2 weeks postoperatively or
earlier, and that newly formed tissue covered the plug car-
tilage (Fig. 4c). This histological observation and the drop
in signal intensity might be related to each other. The inten-
sity of the newly formed tissue that covered the plug carti-
lage was lower than that of the sham cartilage (Fig. 7a). At
8 and 12 weeks postoperatively in particular, the intensity
was about half that at day 0. Because of this low intensity
the tissue could have become detached from the plug car-
tilage before 24 weeks postoperatively (Fig. 5c). The signal
intensity may indicate that the tissue was not sufficiently
stiff for weight bearing during these 24 weeks. Use of
arthroscopy in this system may detect such weak tissue or
cartilage in vivo, before it detaches from the host tissue.
Also, we observed no tissue regrowth in the shaved area.
Based on the histological findings, we speculate that early
weight bearing induced slight plug sinking or tilting, and
that the shaved area came into direct contact with the
patella. The pressure from the patella and its movement
might have prevented the growth of new tissue in the
shaved area.
Table 2
Level of significance (P values) in signal intensity of plug cartilage
24 weeks 12 weeks 8 weeks 4 weeks 2 weeks
Day 0 P < 0.001 P < 0.001 P < 0.001 P < 0.001 P < 0.001
2 weeks P < 0.001 P < 0.05 P < 0.05 NS -
4 weeks P < 0.001 P < 0.001 P < 0.001 - -
8 weeksNSNS
12 weeksNS
The P value was not significant (NS) between weeks 2 and 4, or among weeks 8, 12 and 24. Values for signal intensity are presented in Fig. 7a.
Arthritis Research & Therapy Vol 6 No 6 Kuroki et al.
R501
Figure 8
(a) Signal intensity (an index of stiffness) correlated significantly with the modified Mankin's score (plug site, open circles; corresponding site on the sham side, closed circles; n = 44, P = 0.0176, r = -0.36)(a) Signal intensity (an index of stiffness) correlated significantly with the modified Mankin's score (plug site, open circles; corresponding site on the
sham side, closed circles; n = 44, P = 0.0176, r = -0.36). (b) Signal duration (an index of surface irregularity) correlated significantly with the score
(n = 44, P = 0.0269, r = 0.34). Signal intensity also correlated with the score categories (c) 'cartilage structure' (n = 44, P = 0.0343, r = -0.32) and
(d) 'cartilage cells' (n = 44, P = 0.0499, r = - 0.30) of the modified Mankin's score. (e) When mean values of signal intensity of the plug site were
calculated among each of the six groups, the mean was significantly and strongly correlated with the total modified Mankin's score (n = 6, P =
0.0130, r= -0.91). D0, day 0; 2-w, 2 weeks; 4-w, 4 weeks; 8-w, 8 weeks; 12-w, 12 weeks; 24-w, 24 weeks.
Available online />R502
Although grafts that subsided were considered failed trans-
plants in one study [34], it did not report findings in these
failed grafts. Our findings indicate that the subsided plug
cartilage was covered with newly formed tissue but was not
as intact as normal cartilage, and that it is important to avoid
plug sinking or tilting when small, isolated articular cartilage
defects are treated by OCG.
In a previous study [13] we observed the space between
two types of plug and a recipient hole of 5 mm diameter.
Although a 6-mm diameter plug closely fitted the 5-mm
hole leaving no space, there was a slight space between a
5-mm diameter plug and the hole. In the present study, we
also observed a slight space at day 0 (Fig. 4a) and at 2
weeks postoperatively (Fig. 4c); this space might have
been responsible for the sinking or tilting of the plug. Also,
because all of the rabbits were allowed to move freely in
their cages after the surgery, this early weight bearing
might have affected the results. Because bony union
between plug and host was observed at 4 weeks postop-
eratively (Fig. 4e), early weight bearing should be avoided
until at least 4 weeks.
A study conducted in a rabbit OCG model, in which a plug
of 7 mm diameter and 7 mm depth was harvested and then
returned to its original site, suggested that changes in his-
tological properties between host cartilage and grafted car-
tilage can cause changes in the mechanical properties of
the grafted cartilage [44]. It was also noted that, at 24
weeks postoperatively, the grafted cartilage was not as
intact as normal cartilage, and that the grafted cartilage
was thicker than the normal articular cartilage. Also, the his-
tological appearance of the transplanted articular cartilage
resembled that of immature cartilage, even 24 weeks after
surgery.
Although our plug was smaller in diameter (5 mm), the pro-
cedure for returning the plugs to their original sites was the
same as that used by Makino and coworkers [44]. In the
present study, at 12 weeks postoperatively the thickness of
the plug cartilage (including the newly formed tissue) was
greater than that at the sham site (Fig. 5b). In the superficial
zone we did not observe normal articular cartilage but there
was a newly repaired, cartilage-like tissue that stained
faintly with safranin-O. However, at 24 weeks postopera-
tively there was no reparative tissue covering the plug (Fig.
5c). The plug cartilage was different from normal cartilage
because it stained less intensely (Fig. 5c). Also, the signal
intensity (an index of stiffness) of the plug cartilage fell to
below half that at day 0. This suggests that the plug carti-
lage lost some of its stiffness after the tissue was detached.
Contrary to our findings, in a morphological and mechanical
study conducted in a goat OCG model [45] it was found
that, at 12 weeks postoperatively, mechanical stiffness of
plug cartilage changed to six to seven times greater than
that in the contralateral control site. That study indicated
that no plug subsidence took place, but the cartilage of the
plug was thin in comparison with the surrounding host car-
tilage. Also, the findings of that study suggested that the
increased stiffness might be attributable to intrinsic differ-
ences between host and donor cartilage tissue sites. In our
study, no intrinsic difference between host and donor carti-
lage tissue sites existed because the plugs were returned
to their original position, but the plug sank. Signal intensity
(an index of stiffness) decreased and the actual thickness
(of the plug cartilage and the newly formed tissue) and the
interval between signals (an index of thickness) had
increased by 12 weeks postoperatively. These differences
between the two studies raises questions as to whether
OCG caused these mechanical changes to the plug carti-
lage, and why the changes occurred when they did. Further
investigation of plug diameter and the instruments used will
clarify these issues.
We used a modified Mankin's score to represent degener-
ation of cartilage; increases in the score indicated that
degenerative changes had occurred. Because the score
increased on the grafted side, degeneration of the plug car-
tilage appeared to have taken place. The peak score was
3.5 out of a maximum of 14 points at 12 weeks postopera-
tively, but by 24 weeks the score had improved a little (Fig.
6). This finding suggests that the deterioration was related
to the presence of newly formed tissue. Because we
counted the tissue as 'pannus and surface irregularities' (2
points), recovery of the score at 24 weeks reflected the
detachment of the tissue. Here, the significant correlation
of signal intensity with the mean values of modified
Mankin's score suggests that, to some extent, early degen-
erative changes in cartilage may be detected using this
ultrasound technique (P = 0.0130, r= -0.91; Fig. 8e). How-
ever, the correlation with individual scores was fairly weak
(P = 0.0176, r = -0.36; Fig. 8a). Although we found that
intensity significantly correlated with two categories,
namely cartilage structure (Fig. 8c) and cartilage cells (Fig.
8d), these correlations were weak (P = 0.0343, r = -0.32
and P = 0.0499, r = -0.30, respectively). Therefore, the
intensity may relate to another factor such as superficial
structure.
Mechanical properties of articular cartilage are believed to
reflect the interaction between proteoglycan and collagen
[46]. The composition of cartilage, including proteoglycan
content, may be evaluated by observing the intensity of
staining. In the present study, however, the correlation
between signal intensity and score for staining was not sig-
nificant (P = 0.8111, r = 0.03). Two studies reported that
high-frequency pulse echo ultrasound proved to be sensi-
tive in detecting degeneration of the superficial collagen-
rich cartilage zone [9], and that information gained from
Arthritis Research & Therapy Vol 6 No 6 Kuroki et al.
R503
ultrasound appears to be related to changes in the extracel-
lular matrix collagen and probably in its fibrillar network
organization [11]. Therefore, our ultrasound analysis of
wavelet transformation may detect such changes in colla-
gen rather than in proteoglycan.
Conclusion
Although the plug sank or tilted a little at or earlier than 2
weeks postoperatively, the plug cartilage survived well
throughout the 24-week study period. After the plug sank
or tilted, newly formed tissue covered the plug. The tissue
was attached until 12 weeks, and it was detached from the
plug cartilage between 12 and 24 weeks postoperatively.
These findings are considered to represent failed trans-
plants. Therefore, it is important to avoid plug sinking or tilt-
ing, and to assess the condition of the plug when articular
cartilage defects are treated by OCG. The signal intensity
may reveal and predict whether the tissue is sufficiently stiff
to tolerate weight bearing at 8 and 12 weeks
postoperatively. Ultrasound assessment using wavelet
transformation may contribute to orthopaedics, rheumatol-
ogy and related research in arthritis, and arthroscopic use
of this system may potentially be preferable for in vivo
assessment.
Competing interests
None declared.
Acknowledgement
This study was supported in part by a grant from the New Energy and
Industrial Technology Development Organization, Japan. The study was
performed at the Department of Orthopaedic Surgery, Graduate School
of Medicine, Kyoto University, Kyoto, Japan.
References
1. Adler RS, Dedrick DK, Laing TJ, Chiang EH, Meyer CR, Bland PH,
Rubin JM: Quantitative assessment of cartilage surface rough-
ness in osteoarthritis using high frequency ultrasound. Ultra-
sound Med Biol 1992, 18:51-58.
2. Chiang EH, Adler RS, Meyer CR, Rubin JM, Dedrick DK, Laing TJ:
Quantitative assessment of surface roughness using back-
scattered ultrasound: the effects of finite surface curvature.
Ultrasound Med Biol 1994, 20:123-135.
3. Chiang EH, Laing TJ, Meyer CR, Boes JL, Rubin JM, Adler RS:
Ultrasonic characterization of in vitro osteoarthritic articular
cartilage with validation by confocal microscopy. Ultrasound
Med Biol 1997, 23:205-213.
4. Cherin E, Saied A, Laugier P, Netter P, Berger G: Evaluation of
acoustical parameter sensitivity to age-related and osteoar-
thritic changes in articular cartilage using 50-MHz ultrasound.
Ultrasound Med Biol 1998, 24:341-354.
5. Jurvelin JS, Rasanen T, Kolmonen P, Lyyra T: Comparison of opti-
cal, needle probe and ultrasonic techniques for the measure-
ment of articular cartilage thickness. J Biomech 1995,
28:231-235.
6. Myers SL, Dines K, Brandt DA, Brandt KD, Albrecht ME: Experi-
mental assessment by high frequency ultrasound of articular
cartilage thickness and osteoarthritic changes. J Rheumatol
1995, 22:109-116.
7. Joiner GA, Bogoch ER, Pritzker KP, Buschmann MD, Chevrier A,
Foster FS: High frequency acoustic parameters of human and
bovine articular cartilage following experimentally-induced
matrix degradation. Ultrason Imaging 2001, 23:106-116.
8. Toyras J, Lyyra-Laitinen T, Niinimaki M, Lindgren R, Nieminen MT,
Kiviranta I, Jurvelin JS: Estimation of the Young's modulus of
articular cartilage using an arthroscopic indentation instru-
ment and ultrasonic measurement of tissue thickness. J
Biomech 2001, 34:251-256.
9. Toyras J, Nieminen HJ, Laasanen MS, Nieminen MT, Korhonen RK,
Rieppo J, Hirvonen J, Helminen HJ, Jurvelin JS: Ultrasonic charac-
terization of articular cartilage. Biorheology 2002, 39:161-169.
10. Mori K, Hattori K, Habata T, Yamaoka S, Aoki H, Morita Y, Takakura
Y, Tomita N, Ikeuchi K: Measurement of the mechanical proper-
ties of regenerated articular cartilage using wavelet transfor-
mation. In Tissue Engineering for Therapeutic Use 6 Edited by:
Ikada Y, Umakoshi Y, Hotta T. Tokyo: Elsevier; 2002:133-142.
11. Pellaumail B, Watrin A, Loeuille D, Netter P, Berger G, Laugier P,
Saied A: Effect of articular cartilage proteoglycan depletion on
high frequency ultrasound backscatter. Osteoarthritis Cartilage
2002, 10:535-541.
12. Laasanen MS, Toyras J, Vasara AI, Hyttinen MM, Saarakkala S, Hir-
vonen J, Jurvelin JS, Kiviranta I: Mechano-acoustic diagnosis of
cartilage degeneration and repair. J Bone Joint Surg Am 2003,
Suppl 2:78-84.
13. Kuroki H, Nakagawa Y, Mori K, Ikeuchi K, Nakamura T: Mechanical
effects of autogenous osteochondral surgical grafting proce-
dures and instrumentation on grafts of articular cartilage. Am
J Sports Med 2004, 32:612-620.
14. Hattori K, Mori K, Habata T, Takakura Y, Ikeuchi K: Measurement
of the mechanical condition of articular cartilage with an ultra-
sonic probe: quantitative evaluation using wavelet
transformation. Clin Biomech (Bristol, Avon) 2003, 18:553-557.
15. Hattori K, Takakura Y, Morita Y, Takenaka M, Uematsu K, Ikeuchi
K: Can ultrasound predict histological findings in regenerated
cartilage? Rheumatology (Oxford) 2004, 43:302-305.
16. Nieminen HJ, Toyras J, Rieppo J, Nieminen MT, Hirvonen J, Korho-
nen R, Jurvelin JS: Real-time ultrasound analysis of articular
cartilage degradation in vitro. Ultrasound Med Biol 2002,
28:519-525.
17. Suh JK, Youn I, Fu FH: An in situ calibration of an ultrasound
transducer: a potential application for an ultrasonic indenta-
tion test of articular cartilage. J Biomech 2001, 34:1347-1353.
18. Han CW, Chu CR, Adachi N, Usas A, Fu FH, Huard J, Pan Y: Anal-
ysis of rabbit articular cartilage repair after chondrocyte
implantation using optical coherence tomography. Osteoarthri-
tis Cartilage 2003, 11:111-121.
19. Sahlstrom A, Johnell O, Redlund-Johnell I: The natural course of
arthrosis of the knee. Clin Orthop 1997, 340:152-157.
20. Messner K, Maletius W: The long-term prognosis for severe
damage to weight-bearing cartilage in the knee: a 14-year clin-
ical and radiographic follow-up in 28 young athletes. Acta
Orthop Scand 1996, 67:165-168.
21. Buckwalter JA, Mow VC: Cartilage repair in osteoarthritis. In
Osteoarthritis, Diagnosis and Medical/surgical Management 2nd
edition. Edited by: Moskowitz RW, Howell DS, Goldberg VM,
Mankin HJ. Philadelphia: WB Saunders; 1992:71-107.
22. Hangody L, Kish G, Karpati Z, Szerb I, Udvarhelyi I: Arthroscopic
autogenous osteochondral mosaicplasty for the treatment of
femoral condylar articular defects. A preliminary report. Knee
Surg Sports Traumatol Arthrosc 1997, 5:262-267.
23. Matsusue Y, Yamamuro T, Hama H: Arthroscopic multiple oste-
ochondral transplantation to the chondral defect in the knee
associated with anterior cruciate ligament disruption. Arthros-
copy 1993, 9:318-321.
24. Hangody L, Kish G, Karpati Z, Eberhart R: Osteochondral plugs:
autogenous osteochondral mosaicplasty for the treatment of
focal chondral and osteochondral articular defects. Oper Tech
Orthop 1997, 7:312-322.
25. Marcacci M, Kon E, Zaffagnini S, Visani A: Use of autologous
grafts for reconstruction of osteochondral defects of the knee.
Orthopedics 1999, 22:595-600.
26. Nakagawa Y, Matsusue Y, Ikeda N, Asada Y, Nakamura T: Osteo-
chondral grafting and arthroplasty for end-stage osteochon-
dritis dissecans of the capitellum. A case report and review of
the literature. Am J Sports Med 2001, 29:650-655.
27. Kish G, Modis L, Hangody L: Osteochondral mosaicplasty for
the treatment of focal chondral and osteochondral lesions of
the knee and talus in the athlete. Rationale, indications, tech-
niques, and results. Clin Sports Med 1999, 18(vi):45-66.
28. Barber FA, Chow JC: Arthroscopic osteochondral transplanta- tion: Histologic results. Arthroscopy 2001, 17:832-835.
Available online />R504
29. Berlet GC, Mascia A, Miniaci A: Treatment of unstable osteo-
chondritis dissecans lesions of the knee using autogenous
osteochondral grafts (mosaicplasty). Arthroscopy 1999,
15:312-316.
30. Bobic V: Arthroscopic osteochondral autograft transplantation
in anterior cruciate ligament reconstruction: a preliminary clin-
ical study. Knee Surg Sports Traumatol Arthrosc 1996,
3:262-264.
31. Matsusue Y, Kotake T, Nakagawa Y, Nakamura T: Arthroscopic
osteochondral autograft transplantation for chondral lesion of
the tibial plateau of the knee. Arthroscopy 2001, 17:653-659.
32. Nakagawa Y, Matsusue Y, Nakamura T: Osteochondral graft
transplantation for steroid-induced osteonecrosis of the fem-
oral condyle. Lancet 2003, 362:402.
33. Nakagawa Y, Matsusue Y, Nakamura T: A novel surgical proce-
dure for osteochondritis dissecans of the lateral femoral con-
dyle: exchanging osteochondral plugs taken from donor and
recipient sites. Arthroscopy 2002, 18:E5.
34. Handody L, Udvarhelyi I, Kish G, Toth J, Karpati Z, Dioszegi Z,
Szerb I, Kendik Z: Autogenous osteochondral graft technique
for replacing knee cartilage defects in dogs. Orthop Int 1997,
5:175-181.
35. Rushfeldt PD, Mann RW, Harris WH: Improved techniques for
measuring in vitro the geometry and pressure distribution in
the human acetabulum – I. Ultrasonic measurement of
acetabular surfaces, sphericity and cartilage thickness. J
Biomech 1981, 14:253-260.
36. Mak AF, Lai WM, Mow VC: Biphasic indentation of articular car-
tilage – I. Theoretical analysis. J Biomech 1987, 20:703-714.
37. Mow VC, Gibbs MC, Lai WM, Zhu WB, Athanasiou KA: Biphasic
indentation of articular cartilage – II. A numerical algorithm
and an experimental study. J Biomech 1989, 22:853-861.
38. Bulstra SK, Buurman WA, Walenkamp GH, Van der Linden AJ:
Metabolic characteristics of in vitro cultured human chondro-
cytes in relation to the histopathologic grade of osteoarthritis.
Clin Orthop 1989, 242:294-302.
39. Mankin HJ, Dorfman H, Lippiello L, Zarins A: Biochemical and
metabolic abnormalities in articular cartilage from osteo-
arthritic human hips. II. Correlation of morphology with bio-
chemical and metabolic data. J Bone Joint Surg Am 1971,
53:523-537.
40. Modest VE, Murphy MC, Mann RW: Optical verification of a
technique for in situ ultrasonic measurement of articular carti-
lage thickness. J Biomech 1989, 22:171-176.
41. Kim HK, Babyn PS, Harasiewicz KA, Gahunia HK, Pritzker KP, Fos-
ter FS: Imaging of immature articular cartilage using ultra-
sound backscatter microscopy at 50 MHz. J Orthop Res 1995,
13:963-970.
42. Mitchell N, Shepard N: The deleterious effects of drying on
articular cartilage. J Bone Joint Surg Am 1989, 71:89-95.
43. Speer KP, Callaghan JJ, Seaber AV, Tucker JA: The effects of
exposure of articular cartilage to air. A histochemical and
ultrastructural investigation. J Bone Joint Surg Am 1990,
72:1442-1450.
44. Makino T, Fujioka H, Kurosaka M, Matsui N, Yoshihara H, Tsunoda
M, Mizuno K: Histologic analysis of the implanted cartilage in
an exact-fit osteochondral transplantation model. Arthroscopy
2001, 17:747-751.
45. Lane JG, Tontz WL Jr, Ball ST, Massie JB, Chen AC, Bae WC,
Amiel ME, Sah RL, Amiel D: A morphologic, biochemical, and
biomechanical assessment of short-term effects of osteo-
chondral autograft plug transfer in an animal model. Arthros-
copy 2001, 17:856-863.
46. Elliott DM, Guilak F, Vail TP, Wang JY, Setton LA: Tensile proper-
ties of articular cartilage are altered by meniscectomy in a
canine model of osteoarthritis. J Orthop Res 1999, 17:503-508.