Báo cáo khoa học: "Estimating tree canopy water use via xylem sapflow in an old Norway spruce forest and a comparison with simulation-based canopy transpiration" pdf
Bạn đang xem bản rút gọn của tài liệu. Xem và tải ngay bản đầy đủ của tài liệu tại đây (874.04 KB, 15 trang )
Original article
Estimating tree canopy water use via xylem sapflow
in an old Norway spruce forest and a comparison
with simulation-based canopy transpiration
estimates
Barbara Köstner Eva M. Falge, Martina Alsheimer.
Ralf Geyer, John D. Tenhunen
Bayreuth Institute for Terrestrial Ecosystem Research (BITÖK),
Department of Plant Ecology II, University of Bayreuth, 95440 Bayreuth, Germany
(Received
15
January 1997; accepted
20 October 1997)
Abstract - Tree xylem sapflow rates of 140-year-old Norway spruce (Picea abies) were scaled
to the stand level and compared to canopy transpiration predicted by the stand gas exchange
model STANDFLUX. Variation in sapflux densities between individual sensors was high (coefficient of variance 0.4) and included both variation within and between trees, but it was not different between two applied sapflow methodologies (radial flowmeter according to Granier, variable heating tissue heat balance method according to Cermák and Kucera). During the morning,
a time-lag of typically 2 h elapsed between sapflow (E and predicted canopy transpiration rate
)
f
use was
).
p of
(E During this time total water in the treeas high as 0.3 mm, which was lessLthan the estimated
capacity easily available water
canopy (0.45 mm, on average 14 per tree). Canopy
conductance derived from stand sapflow rates (g and from STANDFLUX (g was in the same
)
f
)
p
),
-1
range (g 10 mm s but a stronger decline with increasing vapor pressure deficit of the air
:
tmax
=
*
Correspondence and reprints
Abbreviations: CBH: tree circumference at breast height; CV: coefficient of variation; DBH:
tree diameter at breast height; D: vapor pressure deficit of the air; D daily maximum half-hour
:
max
average vapor pressure deficit of the air; D average vapor pressure deficit during night; dw:
:
dark
dry weight; E forest canopy transpiration rate; E forest canopy transpiration rate derived with
:
c
:
f
time shift in xylem sapflow; E forest canopy transpiration rate predicted from STANDFLUX
:
p total conductance derived from shifted
Model; g canopy conductance; g
xylem sapflow; g
:
c
:
f
:
ns
total conductance derived from non-shifted xylem sapflow; g canopy conductance predicted from
:
p measurement
STANDFLUX model; g total conductance from canopy to
height of D; g
:
t
:
tmax
maximum total canopy conductance; J: sapflux density (sapflow rate per sapwood area); LAI: projected canopy leaf area index; LS: total leaf surface; LW: leaf dry weight; PPFD: photosynthetic
photon flux density; SD: standard deviation; SE: standard error; SWA sapwood area at breast
:
bh
height; SWA sapwood area below live crown; SWV: sapwood volume.
:
blc
(D) was observed for g as compared to g with current model parameterization. Tree water
f
p
uptake measured by xylem sapflow was higher during spring and somewhat lower during summer compared with
.
p
E Seasonal sums of transpiration from April to October amounted to
108 and 103 mm seasonfor E and E respectively. Estimated tree water uptake during night
-1
f
,
p
increased with D up to 0.5 mm per dark period (on average 16 L per tree) which was 10-140 %
of total daily flux. Because this flow rate did not increase with further increases in D during
night, it is concluded that it reflects the refilling of easily exchangeable water in the trees rather
than a rate of night transpiration. (© Inra/Elsevier, Paris.)
forest transpiration / forest conductance / night water uptake / stand gas
/ Picea abies
exchange model
Résumé - Estimation de la consommation en eau des arbres à partir de la mesure du flux
de sève brute dans un peuplement âgé d’épicéa, et comparaison avec un modèle de transpiration du couvert. Les mesures de flux de sève brute réalisées dans un peuplement d’épicéa
(Picea abies) âgé de 140 ans ont été extrapolées à l’échelle du peuplement et comparées à la
transpiration du couvert prédite par le modèle Standflux. La variabilité des densités de flux entre
les mesures individuelles était élevée (coefficient de variation de 0,4), liée aussi bien à la variabilité intraarbre qu’interarbres, mais les mesures ne différaient pas entre les deux méthodes utilisées (fluxmètre radial de Granier, et bilan d’énergie à chaleur variable de Cermak et Kucera).
Au cours de la matinée, un déphasage, atteignant typiquement 2 h, se produisait entre le flux de
sève (E et la transpiration prédite (E L’équivalent en eau correspondait à 0,3 mm pour cette
)
f
).
p
durée, ce qui est inférieur à la quantité d’eau facilement disponible dans le couvert des arbres
(0,45 mm, soit en moyenne 14 L par arbre). La conductance de couvert, calculée à partir des
mesures de flux de sève du peuplement (g et du modèle Standflux
)
f
),
p
(gétaient du même ordre
de grandeur (g 10 mm s-1), mais une décroissance plus forte, en relation avec l’augmentamax
:
tion du déficit de saturation de l’air (D), était observée pour g comparé à
f
,
p
g avec la paramétrisation actuelle du modèle. La consommation en eau par les arbres mesurée à partir du flux de sève
était plus élevée au printemps, et relativement plus faible en été, par rapport à
.
p mm saiE Les cumul
saisonniers de transpiration entre avril et octobre ont atteint 108 mm saison et
-1
-1
sonpour E et E respectivement. La consommation en eau par les arbres durant la nuit augf p
,
mentait avec D jusqu’à 0,5 mm par nuit (soit en moyenne 16 L par arbre), ce qui correspondait
à 10 à 140 % du flux total journalier. Comme ce flux n’augmentait pas notablement au-delà
d’un certain seuil de D pendant la nuit, il a été conclu que ce flux reflétait plus le remplissage du
réservoir d’eau facilement échangeable des arbres plutôt qu’une véritable transpiration nocturne.
103
(© Inra/Elsevier, Paris.)
transpiration de la forêt / conductance / absorption hydrique nocturne / modèle de transpiration / Picea abies
1. INTRODUCTION
close to total system
evapotranspiration
[3]. In intensively managed forest ecosysTree xylem sapflow rates scaled to the
stand level provide an independent estimate of forest water use which can be
referred to above canopy water vapor flux
to separate the contribution of trees from
other components [8, 20, 21, 31]. Tree
transpiration estimated with a dry canopy
and added to a careful estimate of the forest floor component [56] sums to values
tems which
show a patchy mosaic of
stands varying in age and structure, such as
the Lehstenbach catchment in our study
[1], comparisons of old forest canopy
water use with water vapor fluxes measured by eddy covariance are difficult due
to the small surface occupied by the old
forest stands in the catchment and because
the understory contribution is large. Dur-
ing 1994, water vapor fluxes from the forfloor and from patches of the understory vegetation (Deschampsia flexuosa,
2. MATERIALS AND METHODS
Calamagrostis villosa, Vaccinium myrtillus) in a 140-year-old Norway spruce
stand were estimated by lysimeters and
chamber gas exchange techniques [57].
2.1.
est
On summer days, areally integrated water
vapor fluxes below the tree canopy
reached values of up to 1.1mm d which
-1
equalled ca 40 % of total stand water loss.
Furthermore, tree water storage changes
in
large trees during periods when transpiration is observed via sapflow or at the
leaf level [11, 44]. Storage changes
dynamically on a daily basis [10, 25, 47]
seasonal basis as continuand recharge of water content in the trees occurs from spring to winter in correlation with soil drying and
wetting [6, 54, 55]. While diurnal changes
in tree water storage depend on a relatively small pool of easily available water
in extensible tissues, seasonal changes in
water content are related to the total
amount of extractable water in woody tisas
well
ous
sues
as on a
depletion
[53].
In the
following,
we
compare canopy
estimated by xylem sapflow
methods with canopy transpiration predicted by a three-dimensional gas
exchange model STANDFLUX [13, 15].
STANDFLUX uses information on threedimensional tree structure and temporal
variation in the profile of atmospheric factors to calculate spatial light interception
and process-based gas exchange of threedimensional canopy units. Estimates of
stand xylem sapflow and modelled canopy
transpiration are used to 1) investigate
principle differences in the water uptake
water
use
and canopy
transpiration at various temporal scales, 2) compare estimates of
canopy conductance derived from both
approaches, and 3) estimate tree water
uptake during the night in relation to total
canopy transpiration.
Study site and sample
tree characteristics
The study sites is located in the Lehstenbach catchment in the Fichtelgebirge (Northeast
Bavaria/Germany; latitude 50° 9’N, longitude
11 ° 52’E) which comprises an area of ca 4 km
2
with altitudinal variation from 877 m a.s.l. at
the Waldstein summit to 700 m at the discharge
weir. About 90 % of the catchment is covered
with Norway spruce (Picea abies (L.) Karst.)
varying in age from young regrowth to stands
up to 160 years [36]. Average annual temperatures typically range between 5 and 6.5 °C
and annual precipitation between 950 and 1 050
mm. A relatively high number of foggy days
(100-200 per year) and a short vegetation
period is typical for the region ([40]; for general
infomation on climate of the Fichtelgebirge,
see also Eiden [12]).
Six stands ranging in age from 40 to 140
years were chosen for transpiration studies
[1].In this paper, data from the oldest site
(Coulissenhieb) are presented. Characteristics
of sample trees used for sapflow measurements are shown in table I; for stand characteristics see table II. Stand density and stand
basal area were determined for all 803 trees
within the study area (2.5 ha; Gerstberger,
unpublished). Leaf biomass (LW), total leaf
surface (LS) and sapwood area below live
crown (SWA were determined by harvest
)
blc
of five trees (LW(kg) = 27.56*CBH(m)
,
2.51
2
r 0.96; LS(m 347.9*CBH(m)
2
r
) ,
2 2.35
0.95; SWA r
,
1.83
)=0.017*CBH(m)
2
(m
blc 2
0.97; Köstner and Fischer, unpublished). Total
=
=
=
=
leaf surface was converted to projected leaf
by division of 2.57 [39]. The average relation of SWA was 0.52 (cf. 0.5 for
bh
/SWA
blc
Douglas fir in [54]), the average relation of
tree height height of 25 trees was 0.58.
/total
blc
Due to the relatively low cumulative sapwood
area of the 140-year-old stand, the leaf
area/sapwood area ratio was highest at this
site as compared to the younger sites in the
catchment [1] . Sapwood area at breast height
)
bh
(SWA was determined by two or three stem
cores on 45 trees and by stem disks from the
five harvested trees
,
1.98 2
0.032*CBH(m) r 0.82; n 50). Values
from stem disks agreed with average values
from stem cores. Good agreement between
area
)
2
(m
bh
(SWA
=
=
=
methods
also found using computer
for non-destructive determination of total sapwood area of the trees [1].
Cumulative sapwood area of the stand was
determined by the equation above using the
CBH of all trees (n 803) from the site.
was
2.2.
Meteorological data
tomography
=
Meteorological data were obtained from a
30 m telescopic mast [30] located within the
stand. Photosynthetic photon flux density
(PPFD) was measured at the top of the mast
with linearized photodiodes (G1118, Hamamatsu) calibrated against a LiCor quantum
(Li 190SB, LI-COR, Inc., Lincoln,
Nebraska, USA). Air humidity, air temperature
2.3.
Xylem sapflow
sensor
and wind
speed were measured at three
heights (30, 17 and I m) using VAISALA
HMP-35 UTA humidity sensors (Vaisala, Finland) with linearized thermistors and threedimensional anemometers (ONZ-Windmesser,
MeteolaborAG, Wetikon, Switzerland) with
high resolution propellers (YOUNG, Traverse
City, Michigan, USA). Data from 30 m height
used as driving variables for the STANDFLUX model and to analyse dependencies of
stand sapflow on environmental variables.
Vapor pressure deficit (D) was calculated
using the MAGNUS formula [7] with constants from Smithsonian Meteorological
Tables [50]. Standard meteorological data were
also provided by the Department of Climatolwere
ogy
(BITÖK, University Bayreuth; Gerchau,
unpublished).
by
Xylem sapflow of eight trees was measured
an electronically controlled constant tem-
perature difference system (tissue heat balance
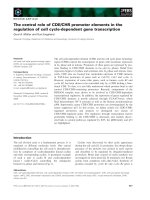
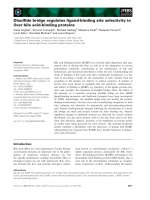
system, THB) constructed according to Cermák and co-workers [5, 35]. Sapflux density (J)
of five additional trees was measured by constant heating flowmeters according to Granier
[18, 19]. The flux signals were measured every
10 s and 10-min averages were stored by a data
logger. The sensors of the constant temperature difference system covered the average sapwood depth (4 cm) while sensors of the constant heating system covered 2 cm of sapwood
depth. No significant change in J measured in
different depths (0-2, 2-4 cm) was observed
during the season. Sapflux density of the THB
system was calculated by dividing tree xylem
sapflow by estimated sapwood area of the tree.
Maximum J of individual measurements was in
the same range for both methods (figure 1).
Accordingly, no systematic difference was
found between methods on a daily basis [1].
2.4.
Scaling from tree to stand level
For
scaling sapflow measurements from
forest stand xylem sapflow rates are
sensor to
related to structural scalars of the trees or stand.
Due to high variation at the sensor level (see
below), we calculated mean J from non-stratified samples and used cumulative sapwood
area of the stand (cumul. SWA to derive
)
bh
forest canopy transpiration (E
):
f
species for a required CV of 15%. A relative deviation of ± 15 and 22 % from the mean
was determined for 12 sample trees of old Scots
pine and old Norway spruce [4].
tree
2.5. Estimation of canopy
conductance from stand
sapflow
Canopy conductance derived from sapflow
comprises the total water vapor
transfer conductance (g from the ’average’
)
t
measurements
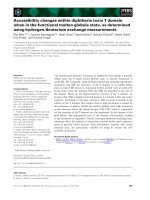
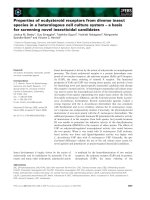
Variation in J of all forest sites measured
in the catchment was high and independent
from tree size of codominant or emergent trees
(figure 2). This high variation in J was referred
to within tree variation in sapwood distribution, sapwood density or activity (highest ratio
of two sensor records within one tree at breast
height =1:3), and between tree variation in
tree size or leaf area. For a selection of five
summer days with mean J ranging between
-2-1
0.08 and 0.11kg cmd and a number of
55-58 codominant and emergent sample trees
measured in the catchment, the coefficient of
variation (CV) ranged between 0.41 and 0.46
independent of sapflow methodologies.
According to the corresponding t-value (twosided), e.g. t the sample size required for
55;0.05
a CV of 15 % would amount to 30-38 while a
usual sample size of between 11 and 9 trees
corresponds to a CV of 25 to 30 %. Oren et al.
[38] report sample sizes from 7 to 48 of various
stomata of the tree
canopy to the measurement
height of D [52], which includes both aerodynamic (g components of momentum and sur:
a
face boundary layer; e.g. [27]) and stomatal
components (g It follows: l/g l/g + l/g
).
c
t c a
,
see Köstner et al. [32]. Because g is usually an
a
order of magnitude larger than g in coniferc
ous stands, E is controlled by g rather than
c
c
a
by g and, therefore, differences between g
t
c
and g are small.
To account for the delay of sapflow rates
compared to transpiration rates, the onset of
stand sapflow (E was simply fitted as a first
)
f
approximation to the onset of predicted transpiration (E which corresponded to the onset
)
p
-2-1
of irradiance (PPFD > 25 μmol m s on dry
)
days. Total canopy conductance was calculated from sapflow as follows [32]:
=
Conversion factor k = G * T G gas
v Kv
;
constant of water vapor (4.62 m hPa kg K
3 -1 -1
),
K
T = air temperature (Kelvin); values of D < 1
hPa were excluded.
=
2.6. The STANDFLUX model
The STANDFLUX model
[13, 15] inte-
grates three-dimensional information on stand
structure and vertical information on stand
microclimate to compute spatial light interception and spatial canopy gas exchange. It
consists of three nested components with a leaf
or branch gas exchange module [ 14], a threedimensional single-tree light interception and
gas exchange module, and the resulting threedimensional forest stand gas exchange model.
Gas exchange of foliage elements is
described according to Harley and Tenhunen
[24] based on estimates of leaf carboxylation,
RuBP regeneration and respiratory capacities
[ 16,17], and an empirical formulation for leaf
conductance [2]. The application to needled
branch segments is described in Falge et al.
[14]. Stomatal conductance is calculated as:
-2 -1
with net CO fixation rate, NP (μmol m s
),
2
relative humidity, h (decimal fraction), CO
s
2
(ppm),
pressure, C
empirically deters
-2
mined minimum conductance, g (mmol m
min
),
-1
s and gfac (dimensionless), describing the
empirically determined sensitivity of stomata to
changes in NP, h and C [51]. Leaf conducs
s
tance in subsections was scaled to the canopy
by leaf area of subsections and tree classes,
defined by similarity in size, structure and physiology, and based on structural measurements
at the site [13, 15]. A boundary layer conductance (g is considered per canopy subsection,
)
a
estimated according to Nobel [37], modified
for conifers as suggested by Jarvis et al. [28]
and adopted to the given leaf area distribution
in the canopy subsection [15]. From total
canopy conductance (gp) canopy transpiration
was calculated by multiplying
p
g with D measured above the canopy [see equation (2)]:
partial
3. RESULTS AND DISCUSSION
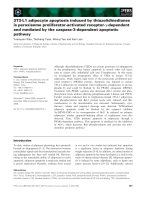
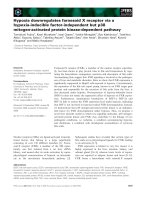
Daily courses of E and g derived from
ct
different approaches are compared in figure 3. While
p
E increased strongly with
photosynthetic photon flux density
(PPFD), the course of E was more similar
f
to the course of vapor pressure deficit of
the air (D) (figure 3A, B). A time-lag of
typically about 2 h on dry days elapsed
between the onset of PPFD or E and E
.
p f
This time-lag is related to the contribution to transpiration of easily available
water extracted from extensible tissue of
needles, bark and young xylem [9, 42, 45,
53, 59]. Rapid diurnal depletions of water
are mainly related to changes in water content of the crown biomass, while seasonal
depletions of stored water can be observed
in the stem [6, 54, 55].
For the old spruce stand, a potential
of 9 mm (280 L per tree)
3
extractable water in the stem (154 m
blc
*
-1
ha
0.6, for conversion of total
SWV into available water according to
Waring and Running [54]) and 2 mm (sum
of water content in needles and branches)
in the crown biomass is estimated. About
0.45 mm (on average 14 L per tree) of the
crown pool would be easily available
water (assuming 120 % rel. water content
of needle dry mass, 80 % rel. water content
of branch dry mass and 10 % of total water
content as easily extractable water; see
table II for biomass estimates). Time-lags
between leaf transpiration and water flow
sensed in the xylem are determined by tissue storage capacity while hydraulic
resistences influence the flux rate (e.g.
[29]). Higher hydraulic resistances are
usually observed in branches compared
to the stem of Norway spruce [49].
Roberts [43] reported that hydraulic resistance of cut trees (Pinus sylvestris) placed
in water pots was only half that of control
trees with intact root systems. Further,
contribution of water stored in the trunk
to transpiration was less for the trees in
amount
blc
SWV
water pots, obviously due to the lacking
of root resistance. However, a temporary
removal of stored water in the upper stem
was also observable in the cut trees, suggesting that most easily available reservoirs of water are transpired first.
In our case, the sum of E during the
p
first 2-3 h of summer days did not exceed
0.2-0.3 mm (on average 6-9 L per tree),
which is less than the estimated amount
of easily available water in the crown.
There is no strong evidence that artificial
time-lags of thermoelectric heat balance
systems caused by heat storage in the stem
[22, 34, 58] play an important role. The
variable power input of the THB system as
well as the low power input of the constant heating system are probably less sensitive to artificial thermal effects compared to systems which apply constant
heat around the whole stem [23]. There
was also no apparent difference between
time-lags measured with the constant heating system and the variable heating system.
For calculation of canopy conductance
from stand sapflow, the course of E was
f
shifted to the onset of E (figure 3B, E).
p
Conductance values derived from nonshifted E (g result in significantly lower
f ns
)
values during morning and midday (figure 3C, F). We are aware that simple shifting of the sapflow values cannot account
for effects of internal water storage on
canopy transpiration during the whole
daily course. This would require direct
measurements and appropriate modelling
of changes in water content and potential
gradients [10]. Since conductance derived
from sapflow inherently includes stomatal, hydraulic and aerodynamic features,
it should be understood as a particular,
specific measure. Nevertheless, for a useful practical description good qualitative
characteristics of g are obtained in comf
parison to g of the gas exchange model.
p
Maximum values (see below) or values
of higher temporal integration [41] are
useful for comparative or complementary
studies.
In figure4 daily courses of E and E
f
p
shown for May and August 1995. Pro-
are
nounced differences between measured
and predicted values occurred during May.
Water uptake of trees during spring could
be referred to refilling of storage capacities
[54, 55]. In spring after rainy days up to 20
April, initial sapflow started with increasing temperature (> 20 °C) and increasing
D (> 15 hPa). During this period, sapflow
did not reach zero during night compared
to lowest or no apparent flux on cold
(< 5 °C) or rainy days in the middle of
May. During August, hourly maxima of
measured flux rates were lower than predicted ones while more similar flux rates
were obtained during July. In August,
sapflow rates sensed during nights with
relatively high D (10-15 hPa) did not
reach minimum values as observed dur-
ing rainy days.
Differences between
decreased with
f
E and Ep
increasing temporal inte-
of the data. While discrepancies
remained quite large on a daily basis (figure 5A), differences declined on a monthly
basis (figure 5B). High water uptake of
trees measured by xylem sapflow during
-1
spring resulted in 26 mm month measured in May compared to18 mm month
-1
the model. In contrast, E was
predicted by
f
slightly lower in August compared to E
p
-1
(21 and 25 mm month for measured and
predicted values). Very similar estimates
c
of E were obtained in June (13), July (28
and 29), September (8 and 7) and October (4 mm month for measured and pre-1
dicted values, respectively). Over the
whole season from April to October, E
c
of both approaches agreed well but was
generally relatively low (108 and 103 mm
-1
seasonfor measured and predicted values). Low rates of Ep resulted from low
predicted light interception due to needle
clumping in the modelled canopy sections.
No seasonal changes in leaf physiology
were included in the model and no drought
effects were considered in the model prediction. There is no strong evidence that E
c
gration
was restricted by soil drought, although
effects of increased soil resistance on tree
water uptake during summer cannot be
fully excluded. Maximum soil suction
(400-600 hPa) occurred for short periods
in late July and August in the upper soil
horizon (20 cm depth) but remained low
during the rest of the year (< 200 hPa),
while soil suction never exceeded 100 hPa
in 90 cm depth (Lischeid, pers. comm.).
The relationship between g and D
t
derived from stand sapflow and predicted
from STANDFLUX is shown in figure 6.
t
Generally, g from both approaches was
in the same range. In some cases, higher
tree water uptake measured by sapflow in
May (cf. discussion on figure 4) resulted in
higher maximum conductances compared
to modelled conductance. Different
responses of g to D between May and
tmax
August are also explained by lower air
temperature in May resulting in lower values of predicted photosynthesis
p
and g in
May for the same value of D as compared
to
August. Daily mean temperature ranged
from 2 to 17 °C and from 13 to 21 °C in
May and August, respectively. In August,
f
g was more reduced with increasing D
than g showing a stronger curvilinear
p
decline of g Although the determination
.
f
of canopy conductance from stand sapflow
remains critical without correction of
changes in capacity throughout the daily
course (cf. discussion on figure 3 C, F),
the values are comparable to the range of
values for Picea abies summarized by
Schulze et al. [48].
During this study of old Norway spruce
frequent sapflow was monitored during
night (E This water uptake is related
).
dark
to refilling of tissues and to transpiration
during night when stomata are not completely closed. Predicted night transpiration of STANDFLUX, based on empirical
estimates of minimum conductance (g
)
min
[14] was not necessarily zero during the
night but it was generally much less than
measured sapflow during the night (see
below). The amount of water taken up by
trees during the dark period (E was
)
dark
calculated for the different seasons by
adding the flow rate from sunset to sunrise
-2 -1
(defined as PPFD < 25 μmol m s
).
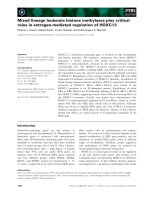
Typical amounts of xylem sapflow during the night of dry summer days ranged
between 0.2 and 0.4 mm. E was posidark
correlated with the total daily
of E (figure 7A) but did not
f
exceed a certain threshold (ca 0.5 mm) in
summer. Although, the estimation of E
dark
is critical owing to uncertainties of thermoelectric methods in determining the
zero line of sapflux, the values of E
dark
are reasonable in relation to estimations
of easily available water storage in extensible tissue. E was also correlated with
dark
increasing D in the night (D up to ca
)
dark
5 hPa but no further increase of E with
dark
increasing D was observed (figure 7B).
dark
The ratio of E during dry summer
f
/E
dark
)
-1
days (for E > 0.5 mm d was on average
f
30 % while low rates of E rainy, foggy
f
on
or cold days were associated with a high
tively
amount
range of E values from10 to 140 %
f
/E
dark
(figure 7C). However, the absolute amount
of E was not related to the amount of
dark
precipitation indicating no strong effect
of soil moisture on tree water uptake during the night. Under conditions of higher
soil water depletion, rain events during
the night may play a more important role
in stem refilling [41 ]. Further, an increase
of g with increasing E ratio was
fmax
f
/E
dark
observed (figure 7D). The relationship
also holds if E is correlated to g
f
/E
dark
tmax
of the following day. This demonstrates
that the status of actual tree water storage
could control maximum conductance
reached during the day [53].
4. CONCLUSIONS
Tree sapflow rates scaled to the stand
level and canopy transpiration predicted
by a stand-level model based on canopy
gas exchange were used to analyse principle differences in tree water uptake and
canopy transpiration. Considering uncertainties in estimating stand sapflow both
approaches agreed on a daily basis
throughout the season. Relative differences between the approaches occurred
over the season. We conclude that differences in spring are influenced by changes
in tree water storage due to higher tree
uptake compared to canopy transpiration. On the other hand, model parameterization might not correctly reflect seasonal trends in leaf physiology.
Changes in tree water storage are also
involved in estimating canopy conductance
from stand sapflow compared to conductance derived from canopy photosynthesis.
As a practical approximation the course of
sapflow rates can be shifted to the onset of
transpiration to obtain useful estimates of g
f
comparable to predicted estimates. But
because conductance from sapflow data
inherently includes stomatal, hydraulic and
aerodynamic features, it should be understood as a specific measure complemenwater
sapflow methodology monitoring water
uptake during the night to investigate
decoupling of bulk water flow in large
trees
ditions.
ACKNOWLEDGEMENTS
We thank A. Suske and G. Müller for their
technical assistance and two reviewers for their
helpful comments on the manuscript. Financial support was provided by the German Ministry for Research and Technology (BEO 510339476 A) and the Bavarian Climate Research
Program BayFORKLIM.
REFERENCES
[1]
[2]
[3]
In
recorded
confined to a certain threshold (ca
0.5 mm), we conclude that it indicates
storage capacities rather than night transpiration. The high ratio of E (up to
f
/E
dark
50 %) during dry summer days stresses
the importance of storage capacities. In
future research more emphasis should be
laid on the dynamics and quantification
of storage capacities at the tree and stand
level [10] and on the improvement of
was
Alsheimer M., Köstner B., Tenhunen J.D.,
Canopy transpiration of Norway spruce stands
tary to leaf or surface conductance.
large trees water uptake was
during the entire night period
indicating refilling of xylem and extensible tissues, and possible transpiration during the night. Because maximum water
uptake during night increased with D, but
from canopy water vapor flux driven
by short-term changes in atmospheric con-
[4]
[5]
[6]
[7]
[8]
(Picea abies [L.] Karst.): seasonal trends and
stand differences, Ann. Sci. For. 55 (1998).
Ball J.T., Woodrow I.E., Berry J.A., A model
predicting stomatal conductance and its contribution to the control of photosynthesis
under different environmental conditions, in:
Binggins I. (Ed.), Progress in Photosynthesis Research, Vol IV.5, Proc. of the VII International Photosynthesis Congress, 1987, pp.
21-224.
Bernhofer C., Gay L.W., Granier A., Joss U.,
Kessler A., Köstner B., Siegwolf R., Tenhunen J.D., Vogt R., The HartX-Synthesis:
An experimental approach to water and carbon exchange of a Scots pine plantation, Theoret. Appl. Climatol. 53 (1-3) (1996)
173-183.
Cermák J., Cienciala E., Kucerá J., Lindroth
A.. Bednárová, Individual variation of sapflow rate in large pine and spruce trees and
stand transpiration: a pilot study at the central
NOPEX site, J. Hydrol. 168 (1995) 17-27.
Cermák J., Deml M., Penka M., A new
method of sap flow determination in trees,
Biol. Plant 15 (1973) 171-178.
Clark J., Gibbs R.D., Studies in tree physiology.
IV. Further investigations of seasonal changes
in moisture contents of certain Canadian forest
trees, Can J. Botany 35 (1957) 219-253.
Deutscher Wetterdienst (Ed.), AspirationsPsychrometer-Tafeln, 5, Auflg., Vieweg,
Braunschweig, 1976.
Diawara A., Loustau D., Berbigier P., Comparison of two methods for estimating the
evaporation of a Pinus pinaster (Ait.) stand:
[9]
[10]
[11]
sap flow and energy balance with sensible
heat flux measurements by an eddy covariance method, Agric. For. Meteorol. 54 (1991)
49-66.
Dobbs R.C., Scott D.R.M., Distributions of
diurnal fluctuations in stem circumference of
Douglas fir, Can J. For. Res. 1 (1971) 80-83.
Domec J.C., Bosc A., Loustau D., An analysis of the spatial variability of sap flow density in maritime pine, Ann. Sci. For. (1998).
Edwards W.R.N., Jarvis P.G., Relations
between water content, potential and permeability in stems of conifers, Plant Cell Envi-
[22]
Grime V.L., Morison J.I.L., Simmonds L.P.,
Including the heat storage term in sap flow
measurements with the stem heat balance
method, Agric. For. Meteorol. 74 (1995)
1-25.
[23]
Grime V.L., Morison J.I.L., Simmonds L.P.,
Sap flow measurements from stem heat balances: a comparison of constant with variable power methods, Agric. For. Meteorol., 74
[24]
photosynthetic response of C leaves to envi3
ronmental factors, in: Boote K.J., Loomis
R.S. (Eds.), Modeling Crop Photosynthesis
from Biochemistry to Canopy, ASA (Am.
Soc. Agron. and Crop Science Society of
5 (1982) 271-277.
Eiden R., Air pollution and deposition, in:
Schulze E.-D., Lange O.L., Oren R. (Eds.),
Forest Decline and Air Pollution, Ecological
Studies 77, Springer, Berlin, 1989, pp.
ron.
[12]
57-103.
[13]
Falge E.M., Berechnung der Kronendachtranspiration von Fichtenbeständen
-
America) Symposium, Madison, Wisconsin,
[25]
[14]
[15]
[ 16]
[17]
[18]
[19]
[20]
[21]
response of Picea abies to habitat conditions,
Trees 10 (1996) 277-287.
Falge E.M., Ryel R.J., Alsheimer M., Tenhunen J.D., Effects of stand structure and
physiology on forest gas exchange: A simulation study for Norway spruce, Trees 11
(1997) 436-448.
Farquhar G.D., von Caemmerer S., Modelling
of photosynthetic response to environment,
in: Lange O.L., Nobel P.S., Osmond C.B.,
Ziegler H. (Eds.), Water Relations and Carbon
Assimilation, Encyclopedia of Plant Physiology, NS vol. 12B, Physiological Plant Ecology II, Springer, Berlin, 1982, pp. 549-587.
Farquhar G.D., von Caemmerer S., Berry
J.A., A biochemical model of photosynthetic
2
CO assimilation in leaves of C species,
3
Planta 149 (1980) 78-90.
Granier A., Une nouvelle méthode pour la
mesure du flux de sève brute dans le tronc
des arbres, Ann. Sci. For. 42 (1985) 193-200.
Granier A., Evaluation of transpiration in a
Douglas-fir stand by means of sap flow measurements, Tree Physiol. 3 (1987) 309-320.
Granier A., Biron P., Köstner B., Gay L.W.,
Najjar G., Comparisons of xylem sap flow
and water vapour flux at the stand level and
derivation of canopy conductance for Scots
pine, Theoret. Appl. Climatol. 53 (1-3) (1996)
115-122.
Granier A., Bobay V., Gash J.H.C., Gelpe J.,
Saugier B., Shuttleworth W.J., Vapour flux
density and transpiration rate comparisons in
a stand of Maritime pine (Pinus pinaster Ait.)
in Les Landes forest, Agric. For. Meteorol.
51 (1990) 309-319.
1991, pp. 17-39.
Herzog K.M., Häsler R., Thum R., Diurnal
changes in the radius of a subalpine Norway
spruce stem: their relation to the sap flow and
their use to estimate transpiration, Trees 10
(Picea abies (L.) Karst.) mit unterschiedlichen
Modellierungsansätzen, thesis, University
Bayreuth (1997).
Falge E.M., Graber W., Siegwolf R., Tenhunen J.D., A model of the gas exchange
(1995) 27-40.
Harley P.C., Tenhunen J.D., Modeling the
(1995) 94-101.
Kelliher F.M., Schulze E.D., Köstner B.M.M., Coupling of tree transpiration to atmopsheric turbulence, Nature
[26]
Hollinger D.Y.,
[27]
Jarvis P.G., Coupling of carbon and water
interactions in forest stands, Tree Physiol. 2
[28]
Jarvis P.G., James G.B., Landsberg J.J.,
Coniferous forest, in: Monteith J.L. (Ed.),
Vegetation and Atmosphere Vol. 2, Case
Studies, Academic Press, London, 1976, pp.
171-240.
[29]
Jones H.G., Plants and Microclimate, 2nd
371 (1994) 60-62.
(1986) 347-368.
ed., Cambridge University Press, Cambridge,
1992.
[30]
Joss U., Graber W., Profiles and simulated
exchange of, O NO between the atmoO H,
232
sphere and the HartX Scots pine plantation,
Theoret. Appl. Climatol. 53 (1996) 157-172.
[31]
Kelliher F.M., Köstner B.M.M.,
Hollinger
D.Y., Byers J.N., Hunt J.E., McSeveny T.M.,
Meserth R., Weir P.L., Schulze E.-D., Evaporation, xylem sap flow, and tree transpiration
in a New Zealand broad-leaved forest, Agric.
For. Meteorol. 62
(1992) 53-73.
[32]
Köstner B.M.M., Schulze E.-D., Kelliher F.M.,
Hollinger D.Y., Byers J.N., Hunt J.E., McSeveny T.M., Meserth R., Weir P.L., Transpiration
and canopy conductance in a pristine broadleaved forest of Nothofagus: an analysis of
xylem sap flow and eddy correlation measurements, Oecologia 91 (1992) 350-359.
[33]
Köstner B., Alsheimer M., Tenhunen J.D.,
Water fluxes in a spruce forest ecosystem:
tree canopy transpiration at different sites,
Verhandlungen der Gesellschaft für Ökologie
26 (1996) 61-68.
[34]
[35]
Köstner B., Granier A., Cermák J., Sapflow
measurements in forest stands methods and
uncertainties, Ann. Sci. For. 55 (1998) 13-27.
Kucera J., Cermák J., Penka M., Improved
thermal method of continual recording the
transpiration flow rate dynamics, Biol. Plant
Picea
Manderscheid B., Göttlein A., Wassereinzugsgebiet ’Lehstenbach’ - das BITÖKUntersuchungsgebiet am Waldstein (Fichtelgebirge, NO-Bayern), Bayreuther Forum
Ökologie 18 (1995) 84.
[37]
[38]
[39]
Nobel P.S., Biophysical Plant Physiology and
Ecology, W.H. Freeman and Company, San
Francisco, 1983, p. 608.
Oren R., Phillips N., Katul G., Ewers B.E.,
Pataki D.E., Scaling xylem sap flux and soil
water balance, and calculation variance: a
method for partitioning water flux in forests,
Ann. Sci. For. 55 (1998) 191-216.
Oren R., Schulze E.-D., Matyssek R., Zimmermann
[40]
[49]
Sellin A.A., Hydraulic architecture of Norway spruce, Sov. Plant Physiol. 35 (1989)
839-845.
[50]
Smithsonian Institution, Smithsonian Mete-
orological Tables, 6th revised edition, Washington D.C., 1966.
[51]
Tenhunen J.D., Hanano R., Abril M., Weiler
E.W., Hartung W., Above- and belowground
controls on leaf conductance of Ceanothus
thyrsiflorus growing in a chaparral environment: The role of abscisic acid, Oecologia
99 (1994) 306-314.
[52]
Thom A.S., Momentum,
[43]
[44]
Roberts J., An examination of the quantity
of water stored in mature Pinus sylvestris L.
trees, J. Exp. Bot. 27 (1976) 473-479.
Roberts J., The use of tree-cutting techniques
in the study of the water relations of mature
Pinus sylvestris L, J. Exp. Bot. 28 (1977)
751-767.
[53]
Waring R.H., Running S.W., Water uptake,
storage and transpiration by conifers: a physiological model, in: Lange O.L., Kappen L.,
Schulze E.-D. (Eds.), Water and Plant Life,
Ecological Studies 19, Springer, Berlin, 1976,
[54]
pp. 189-202.
Waring R.H., Running J.W., Sapwood water
storage: its contribution to transpiration and
effect upon water conductance through the
stems of old-growth Douglas-fir, Plant Cell
Environ. 1
conifers:
[46]
[47]
computer simulation model,
Oecologia 18 (1975) 1-18.
Schulze E.-D., The regulation of plant transpiration: interactions of feedforward, feedback, and futile cycles, in: Schulze E.-D.
(Ed.), Flux Control in Biological Systems,
Academic press, 1994, pp. 203-235.
Schulze E.-D., Cermák J., Matyssek R., Penka
M., Zimmermann R., Vasicek F., Gries W.,
Kucera J., Canopy transpiration and water
fluxes in the xylem of the trunk of Larix and
(1978) 131-140.
[55]
Waring R.H.. Whitehead D., Jarvis P.G., The
contribution of stored water to transpiration in
Scots pine, Plant Cell Environ. 2 (1979)
[56]
Wedler M., Heindl B., Hahn S.C., Köstner
B., Tenhunen J.D., Model-based estimates of
water loss from ’patches’ of the understory
mosaic of the Hartheim Scots pine plantation, Theoret. Appl. Climatol. (1996)
135-144.
[57]
Wedler M., Köstner B., Tenhunen J.D., Water
fluxes in a spruce forest ecosystem: estimates
of forest understory evapotranspiration, Verhandlungen der Gesellschaft für Ökologie 26
[58]
Weibel F.P., Boersma K., An improved stem
heat balance method using analog heat control, Agric. For. Meteorol. 75 (1995) 191-208.
[59]
Wronski E.B., Holmes J.W., Turner N.C.,
Phase and amplitude relations between tran-
309-317.
Running S.W., Relating plant capacitance to
Running S.W., Waring R.H., Rydell R.A.,
Physiological control of water flux in
and heat
Met.
Soc. 98 (1972) 124-134.
the water relations of Pinus contorta, For.
Ecol. Manag. 2 (1980) 237-252.
[45]
mass
exchange of vegetation, Quart J. Roy.
(1998) 217-235.
[42]
xylem flow,
Schulze E.-D., Kelliher F.M., Körner C.,
Lloyd J., Leuning R., Relationships between
plant nitrogen nutrition, carbon assimilation
rate, and maximum stomatal and ecosystem
surface conductances for evaporation: A
global ecology scaling exercise, Ann. Rev.
Ecol. System 25 (1994) 629-660.
-
[41]
of
cuvette measurements,
Oecologia 66 (1985) 475-483.
R., Estimating photosynthetic rate
and annual carbon gain in conifers from specific leaf weight and leaf biomass, Oecologia 70 (1986) 187-193.
Peters K., Gerchau J., Klima und luftchemische Situation des Fichtelgebirges unter besonderer Berücksichtigung des Einzugsgebietes
Lehstenbach, in: Manderscheid B., Gưttlein
A. (Ed.), Wassereinzugsgebiet ’Lehstenbach’
das BITƯK-Untersuchungsgebiet am Waldstein (Fichtelgebirge, NO-Bayern), Bayreuther
Forum Ökologie 18 (1995) 15-39.
Phillips N., Oren R., A comparison of daily
representations of canopy conductance based
on two conditional time-averaging methods
and the dependence of daily conductance on
environmental factors, Ann. Sci. For. 55
comparison
[48]
19 (1977) 413-420.
[36]
trees -
porometer and
a
(1996) 69-77.
spiration,
water
potential
age, Plant Cell Environ. 8
and stem shrink-
(1985) 613-622.