Báo cáo lâm nghiệp: "Diagnosing plant water status as a tool for quantifying water stress on a regional basis in Mediterranean drylands" pdf
Bạn đang xem bản rút gọn của tài liệu. Xem và tải ngay bản đầy đủ của tài liệu tại đây (223.94 KB, 13 trang )
Original article
Diagnosing plant water status as a tool for quantifying
water stress on a regional basis
in Mediterranean drylands
Moreno Vertovec
a
, Serdal Sakçali
b
, Munir Ozturk
b
, Sebastiano Salleo
a,*
,
Paola Giacomich
a
, Enrico Feoli
a
, Andrea Nardini
a
a
Dipartimento di Biologia, Università degli Studi di Trieste, Via L. Giorgieri 10, 34127 Trieste, Italy
b
Department of Biology, Fatih University, Buyukcekmece, 34900 Istanbul, Turkey
(Received 17 May 2000; accepted 24 August 2000)
Abstract – This study reports measurements of stomatal conductance, relative water content and water potential (Ψ
L
) from three
dominant evergreens (
Ceratonia siliqua L., Quercus coccifera L. and Olea oleaster Hoffmgg. et Link) growing in four coastal sites
of Turkey. In particular, a fully vegetated site (H) was selected and compared for the above parameters to three degraded sites (D1,
D2 and D3) with decreasing vegetation covers. From the integral of the diurnal time course of
Ψ
L
, the water stress impact on each
species (WSIS) was calculated.
C. siliqua and Q. coccifera showed similar WSIS’s, increasing significantly from H to D3. O. oleast-
er
was sensitive both to summer drought and to increasing site degradation. The impact of water stress was scaled up from the
species to the vegetation level (WSIV) as WSIV =
Σ WSIS
S
(1–f
s
) where f
s
was the relative frequency of the species studied. WSIV
was rather sensitive to the impoverishment of vegetation and was correlated to vegetation density as estimated both by field observa-
tions and remotely sensed Normalized Difference Vegetation Index.
desertification / leaf water potential / Mediterranean evergreens / Normalized Difference Vegetation Index / water stress
impact
Résumé – Diagnostiquer l’état de l’eau dans la plante : un outil pour quantifier le stress hydrique au niveau régional dans les
régions sèches méditerranéennes.
Cette étude rapporte les mesures de conductance stomatique, de la teneur relative en eau et du
potentiel hydrique (
Ψ
L
) d’arbres à feuilles persistantes (Ceratonia siliqua L., Quercus coccifera L. et Olea oleaster Hoffmgg. Et
Link) croissant sur 4 sites côtiers de Turquie. En particulier, un site totalement recouvert de végétation (H) a été sélectionné et com-
paré, pour les paramètres ci-dessus, à 3 sites dégradés (D1, D2 et D3) ayant une couverture végétale de plus en plus faible. A partir
de l’intégrale de
Ψ
L
, pour le cycle diurne, l’impact du stress hydrique de chaque espèce (WSIS) a été calculé. C. siliqua et Q. coc-
cifera
montrent des WSIS similaires, augmentant significativement de H à D3. O. oleoaster a été sensible à la fois à la sécheresse
estivale et à l’accroissement de la dégradation du site. Un changement d’échelle, du niveau de l’espèce à celui de la végétation, a été
réalisé pour l’impact du stress hydrique (WSIV) par la transformation WSIV =
Σ WSISs (1–f
s
) ou f
s
est la fréquence relative de
l’espèce étudiée. WSIV est particulièrement sensible à l’appauvrissement de la végétation et est corrélé à la densité de la végétation
estimée à la fois par des observations aux champs et par l’indice normalisé de différentiation de la végétation par observation satelli-
taire.
désertification / potentiel hydrique des feuilles / arbre à feuilles persistantes méditerranéen / index normalisé de différentia-
tion des espèces / impact du stress hydrique
Ann. For. Sci. 58 (2001) 113–125 113
© INRA, EDP Sciences, 2001
* Correspondence and reprints
Tel. +39 040 6763875; Fax. +39 040 568855. e-mail:
M. Vertovec et al.
114
1. INTRODUCTION
Today, most Mediterranean countries have to face
progressive degradation of their vegetation cover due to
increasing anthropic pressure [13, 31, 33, 57] leading to
improper use of resources. Overgrazing, repeated fire
events and indiscriminate urbanization are common fac-
tors [21, 32] contributing to impoverishment of
Mediterranean forests and grasslands and, hence, to
increasing environmental aridity.
Whenever evapotranspiration increases beyond given
limits, water availability to plants becomes insufficient
to sustain the transpirational and physiological demand
and water stress develops in plants; these plants then
react by reducing gas exchange and, hence, CO
2
fixation
and productivity [11, 29, 55]. A problem arising when
large areas are considered in this regard, is how to quan-
tify the impact of water stress on a regional scale, based
on the response of a few individuals of a single or sever-
al species. The aim of such scaling exercises are to: a)
discriminate drought resistant from vulnerable species;
b) select the species more suitable for reforestation
and/or cultivation; c) derive an index describing the
impact of water stress on plant and system processes;
and d) use such an index to assess larger scale trends and
patterns (i.e. degradation, recovery, etc.).
Water stress is usually estimated in terms of plant
water relations parameters such as leaf relative water
content (RWC), water potential (
Ψ
L
) and conductance to
water vapour (g
L
) [2, 42, 47] as well as in terms of loss
of hydraulic conductance (
K
WL
) of the soil-to-leaf path-
way [25, 30]. In spite of some known limits in the inter-
pretation of pressure chamber-derived Ψ
L
measurements
[14, 51, 59], Ψ
L
is easily and rapidly measured in the
field and provides a reliable measure of plant water sta-
tus, especially for comparative purposes. Nonetheless,
field measurements of
Ψ
L
require some caution in their
use. Common reference parameters used to estimate the
extent to which plants suffer water deficit stress are pre-
dawn leaf water potential (Ψ
pd
), minimum diurnal leaf
water potential (
Ψ
min
) and maximum diurnal water
potential drop (
∆Ψ = Ψ
pd
– Ψ
min
) [43]. In turn, whole-
plant hydraulic conductance (K
WL
) is usually estimated
in terms of the Ohm’s law analogue i.e. as:
K
WL
= E
L
/ (Ψ
soil
– Ψ
min
) (1)
where E
L
is the transpiration rate and Ψ
soil
is the soil
water potential, usually assumed to be in equilibrium
with Ψ
L
when measured as Ψ
pd
[58].
The significance of both Ψ
pd
and Ψ
min
as indicators of
plant water status has been questioned. As an example,
Ψ
pd
has been reported not to coincide with soil water
potential [3, 8, 43] during dry periods due to an air gap
between roots and soil [53]. In other cases (e.g. in
Eucalyptus grandis Hill ex Maiden [5]) plants lose sig-
nificant amounts of water in the night so that Ψ
pd
no
longer equilibrates with Ψ
soil
. In turn, Ψ
min
provides use-
ful information of whether leaves reach their turgor loss
point (Ψ
tlp
) at which growth is stopped [18, 47, 60] or
the cavitation threshold (Ψ
cav
) at which whole-plant
hydraulic conductance is reduced due to xylem
embolism [6, 52]. Nonetheless, mere Ψ
min
measurements
are unable to give information of the true impact of
water stress on plant growth and productivity. This is
because it is the duration of the minimum levels of Ψ
L
that determines the extent to which plant growth is limit-
ed. In other words, the longer the time plant organs
remain at low water potentials, the greater the likelihood
of damage to living cells and of extensive xylem
embolism [29].
More detailed information of the impact of water
stress on plants might be provided by the entire diurnal
time course of Ψ
L
, expressed in the integrated form as
suggested by Mishio and Yokoi [23] or:
WSIS =
t
o
∫
t
x
Ψ
L
.
dt (2)
where WSIS is the impact of water stress on individuals
of a given species and d
t is the time interval when Ψ
L
measurements are performed (usually between pre-dawn,
t
0
, and sunset, t
x
). In this form, diurnal changes of leaf
water potential can be used to estimate the amount of the
“environmental pressure” exerted on plants by water
stress [23].
The present study reports measurements of water rela-
tions parameters in woody species dominant in different
sites of the Mediterranean coastal area of Turkey. Sites
were chosen to reflect increasing degradation of the veg-
etation cover (see below). The specific objectives of our
study were to: a) quantify the impact of water stress on
three different Mediterranean evergreen sclerophylls as
typical components of vegetation of Mediterranean dry-
lands; and b) assess the reliability of a relatively easily
measured ecophysiological parameter to estimate the
degree and duration (or intensity) of water stress. A sec-
ondary objective was to evaluate the use of remotely
sensed spectral vegetation indices such as NDVI
(Normalized Difference Vegetation Index) to estimate
vegetation density.
To this purpose, a reference area was selected in the
Dilek Yarimadasi Milli Park, characterized by optimal
development of vegetation cover. Three more areas were
added to the study, with decreasing vegetation cover. In
all the study sites, three typical Mediterranean evergreen
sclerophylls [9, 24] were selected i.e. Ceratonia siliqua L.
Diagnosing plant water status in Mediterranean drylands
115
(Carob tree), Quercus coccifera L. (Kermes oak) and Olea
oleaster Hoffmgg. et Link (wild olive tree).
2, MATERIALS AND METHODS
2.1. Description of study sites
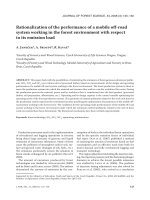
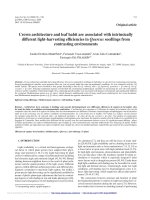
Four study sites were selected in two different regions
of Turkey (figure 1a) i.e. in the Dilek peninsula (figure
1b) and in the Mersin State (figure 1c). In particular, the
reference site was selected in the northern part of Dilek
Yarimadasi Milli Park, near the city of Güzelçamli
(37°41' N, 27°08' E, altitude 30 m) showing optimal,
undisturbed development of vegetation consisting of sev-
eral woody species among which the evergreen sclero-
phylls C. siliqua, Q. coccifera and O. oleaster were
dominant. This site was considered as “healthy” (site H,
figure 1b) and taken as a reference status of vegetation in
comparison with the other three “degraded” sites (sites
D, figures 1b and 1c). These, showed decreasing devel-
opment of vegetation cover because of concurrent effects
of climatic factors and anthropogenic pressure. Site D1
(figure 1c) was located along the coastal area of the State
of Mersin, near the city of Kuyuluk (36°46' N, 34°31' E,
altitude 3m); site D2 (figure 1b) was located in the
southern part of the Dilek peninsula, facing the coast of
Karine (37°38' N, 27°07' E, altitude 20 m) and site D3
(figure 1c) was located in the State of Mersin, near the
city of Mut (36°34' N, 33°19' E, altitude 270 m). In all
the three D sites, the dominant species were the same as
in site H (i.e. C. siliqua, Q. coccifera and O. oleaster).
Both Dilek and Mersin regions have a typical
Mediterranean climate, characterized by dry, warm sum-
mers and mild, humid winters. The mean annual precipi-
tation in the Dilek peninsula (1961–1991) is about 645
mm. Between June and September the rainfall is as low
as 20 mm. The Mersin region is somewhat drier, with a
mean annual precipitation of about 595 mm and about 30
mm rainfall during the summer period.
Measurements in site H were performed in May 1998
and repeated in September 1998. Measurements in the
spring were aimed at providing reference values of the
water relations parameters, because in this month plants
were actively growing and water availability was likely
high after winter rains. Total precipitation during March,
April and May 1998 at site H was about 130 mm and air
temperatures were between 15 and 25 °C. In contrast,
September is the driest period in the Mediterranean
Basin region and therefore, represents the peak of
drought stress likely suffered by plants. Measurements at
sites D1, D2 and D3 were performed in September 1998,
with the aim of estimating the maximum annual impact
of water stress in areas at different levels of landscape
degradation.
Istanbul
Bursa
Izmir
Antalya
Adana
Ankara
Site H (Güzelçamli)
Site D2 (Karine)
Site D1 (Kuyuluk)
Site D
3
(Mut)
North
a
b
c
Figure 1. a) The two study areas, located in the
Dilek peninsula near Izmir and in the State of
Mersin, between the cities of Antalya and
Adana, respectively; b) reference site (H) near
the city of Güzelçamli and degraded site (D2)
near the village of Karine, both within the
Dilek peninsula; c) degraded sites D2 and D3
near the city of Kuyuluk and Mut, respectively.
M. Vertovec et al.
116
2.2. Estimating vegetation density
Vegetation cover was estimated both by direct obser-
vations in the field and by remotely sensed satellite
images. Field measurements of vegetation cover were
made in September 1998. The percentage vegetation
cover was estimated by laying ten 4 × 4 m square
quadrats in each of the four sites studied. The frequency
of the three species selected was estimated by counting
the number of individuals of each species growing in the
selected 16 m
2
areas.
Remotely sensed images were acquired from the
NOAA-14 satellite equipped with the AVHRR sensor
[22, 39, 54]. Images with a resolution of 1×1 km were
taken of Turkey on September 18, 1998, i.e. in the same
period when field measurements of vegetation cover and
water relations were performed. September 18 was a
clear sunny day in all the areas selected for the study.
Images were obtained from USGS (United States
Geological Survey) already georeferenced and radiomet-
rically calibrated. Images were then processed in Trieste
and corrected for the atmospheric effect [22]. Channel 1
(Red reflectance, RED, λ = 0.58–0.68 µm) and channel 2
(Near-infrared reflectance, NIR, λ = 0.725–1.00 µm)
were used to estimate the NDVI (Normalized Difference
Vegetation Index) from the equation:
NDVI = (NIR – RED) / (NIR + RED). (3)
In this form, NDVI ranges between –1 and +1. In partic-
ular, clouds, snow and water produce negative NDVI
values. Rocky and bare soil areas result in vegetation
indices near zero, while positive values of NDVI corre-
spond to vegetated areas [16]. NDVI has been reported
to provide a reliable estimate of vegetation cover and is
widely used to study changes in several vegetation fea-
tures such as seasonal dynamics of vegetation, tropical
forest clearance, and biomass. In turn, these vegetation
attributes have been used in different models to study
photosynthesis, carbon budgets and water balance [16,
41, 46, 54].
2.3. Field measurements of g
L
, Ψ
L
and RWC
Leaf conductance to water vapour (g
L
), water poten-
tial (Ψ
L
) and relative water content (RWC) were mea-
sured every 90 min between 05:30 and 20:30.
Measurements were repeated every 60 min in the time
interval between 10:00 and 14:00 to provide more
detailed information on minimum diurnal Ψ
L
(Ψ
min
),
minimum RWC and mid-day g
L
. All the measurements
were performed on one-year-old leaves from at least
three different plants per species in May and September
1998 at site H and in September 1998 at D sites (see
above).
In particular,
g
L
was measured on at least 20 leaves
per species each daytime while still attached to the tree,
using a steady-state porometer (LI-1600, LI-COR Inc.,
Lincoln, NE, USA). Each measurement was completed
within about 30 s. Air temperature and relative humidity
were also estimated using the porometer cuvette held at
about 1 m from the plant crown.
Relative water content (RWC) of at least 15 leaves
per species each daytime was measured from different
trees. Leaves were cut off while within plastic bags,
placed in zip-lock plastic sacks and kept in a thermal bag
at about 4 °C. At the end of the experiments, leaves were
brought to the laboratory and weighed on a digital bal-
ance to obtain their fresh weights (fw). Leaves were then
resaturated with water to full turgor by immersing their
petioles in distilled water, covering the leaf blades with
plastic film and leaving them in the dark, overnight.
Leaves were reweighed to get their turgid weight (tw)
and then dried at 70 °C for 3 days to get their dry weight
(dw). Finally, RWC was calculated as 100 × (fw-dw) /
(tw-dw).
Leaf water potential (Ψ
L
) was measured on six to ten
leaves per species each daytime, using a portable
Scholander-Hammel pressure chamber (PMS 1000, PMS
Instrument Company, Corvallis, OR, USA) [45]. All the
leaves sampled grew on the southern part of the crown
and were sun leaves.
2.4. Estimating the impact of water deficit stress on
single species (WSIS) and vegetation (WSIV)
The curve describing the pattern of diurnal leaf water
potential was used to calculate the integrated water stress
for each species according to equation (2). In order to
describe the amount of water stress suffered by the three
species relative to their frequency in the different sites,
WSIS was multiplied by (1 – f
s
) where f
s
is the relative
frequency of the species i.e. the ratio of the number of
individuals of each species to the total number of indi-
viduals of all the three species studied. Each individual
was then combined to give a weighted site stress (WSIV,
water stress of vegetation) from:
WSIV = Σ (1 – f
S
)
.
WSIS
S
= (1 – f
CS
)
.
WSIS
CS
+ (1 – f
QC
)
.
WSIS
QC
+ (1 – f
OO
)
.
WSIS
OO
(4)
where CS, QC and OO are C. siliqua, Q. coccifera and
O. oleaster, respectively.
Diagnosing plant water status in Mediterranean drylands
117
3. RESULTS
3.1. Vegetation cover and species relative
frequencies
The vegetation cover as estimated by direct field
observations was 78.5, 76.5, 65.0 and 56.5% for sites H,
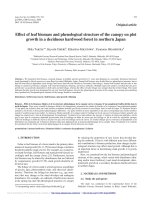
D1, D2 and D3, respectively (table I) whereas calculated
NDVI was 0.615, 0.317, 0.241 and 0.190, respectively
(figures 2a and 2b). A highly significant, non-linear rela-
tionship was noted between the percentage vegetation
cover and NDVI (
figure 3). However, nearly equal vege-
tation covers estimated for sites H and D1 corresponded
to very different NDVI’s (almost double at site H versus
site D1,
figure 3) whereas covered changed by only 2%.
This was likely the effect of the dominant growth form
changing from tree at site H to shrub at site D1 (and also
D2 and D3,
table I). The relative frequencies of C. sili-
qua also decreased from site H (about 34%) to sites D
(12 to 17%). At site D1 (the least degraded site), C. sili-
qua was apparently replaced by O. oleaster and at sites
D2 and D3 by
Q. coccifera (table I).
Table I. Percentage vegetation cover, relative frequency and growth form as estimated by field observations in a well developed vegetation site (H) and
in three degraded sites (D1, D2 and D3).
Site Vegetation
C. siliqua Q. coccifera O. oleaster
Cover, % Frequency / Growth form Frequency / Growth form Frequency / Growth form
H 78.5 0.34 / Tree 0.31 / Tree 0.34 / Tree
D1 76.5 0.12 / Tree 0.34 / Shrub 0.54 / Shrub
D2 65.0 0.17 / Shrub 0.49 / Shrub 0.33 / Shrub
D3 56.5 0.17 / Shrub 0.49 / Shrub 0.34 / Shrub
a
Site H (Güzelçamli)
37°41’N
27°08’E
NDVI=0.615
Site D2 (Karine)
37°38’N
27°07’E
NDVI=0.241
b
Site D1 (Kuyuluk)
36°46’N
34°31’E
NDVI=0.317
Site D
3
(Mut)
3
3
6°34’N
33°19’E
NDVI=0.190
Figure 2. Images from NOAA-14
satellite. Resolution 1x1 km. For each
of the four sites studied (H, D1, D2
and D3, respectively), latitude and lon-
gitude as well as the satellite derived
Normalized Difference Vegetation
Index (NDVI) are reported.
M. Vertovec et al.
118
3.2. Leaf water status
The mean of mid-day (i.e. 1000–1400 h) g
L
values in
the three study species for the four sites is reported in
figure 4. In May, mid-day g
L
’s varied between 280 mmol
m
–2
s
–1
in Q. coccifera and 550 mmol m
–2
s
–1
in O.
oleaster. In September (site H), both Q. coccifera and O.
oleaster reduced their mid-day g
L
’s (by 43 and 33%,
respectively), while C. siliqua maintained either the
same or slightly higher g
L
’s with respect to the spring.
Mid-day g
L
’s, measured in September at the three D
sites, were progressively lower with respect to those
recorded in the spring for both Q. coccifera and O.
oleaster. A less clear pattern of g
L
changes was observed
for C. siliqua where plants growing at site D2 had maxi-
mum g
L
’s very close to those recorded in site H. A
noticeable reduction in maximum g
L
(by about 85%) was
recorded in C. siliqua plants growing in the most degrad-
ed site (D3).
RWC’s measured between 10:00 and 14:00 (mini-
mum diurnal RWC’s) are reported in figure 5. Leaves of
C. siliqua showed minimum diurnal RWC’s as high as
between 90 and 95% at sites H and D1, and lower but
still high values at sites D2 (85%) and D3 (82%). Similar
RWC’s were recorded in O. oleaster at sites H and D1
i.e. between 89 and 92%. In contrast, O. oleaster plants
growing in sites D2 and D3 had RWC’s as low as 70 to
72%. A progressive decrease in RWC was recorded in
Q. coccifera plants from site H (May) to site D2.
Interestingly, plants growing at site D3 (the most degrad-
ed site) had higher RWC’s (about 87%) with respect to
those recorded in plants growing at less degraded sites.
In
figure 6, pre-dawn leaf water potential (Ψ
pd
) as
well as Ψ
min
are illustrated for the three species studied.
It can be noted that O. oleaster plants showed progres-
sively lower values of both Ψ
pd
and Ψ
min
at sites H to
D3, with the only exception of Ψ
pd
measured in plants
growing at site D3 where Ψ
pd
in September was very
similar to that recorded at site H in the same month. The
maximum decrease in Ψ
L
(i.e. Ψ
pd
– Ψ
min
) was recorded
in leaves of plants growing in site D3 and was impres-
sive with a diurnal ∆Ψ of 4 MPa (Ψ
pd
= –2.5 MPa and
Ψ
min
= –6.5 MPa). In C. siliqua, Ψ
pd
was about
–0.6 MPa in May (site H) and decreased to –1.2 MPa at
sites H, D1 and D2 (September), and further to –1.7 MPa
at site D3. For C. siliqua, Ψ
min
ranged between –1.8 MPa
at site H and –3.0 MPa at site D3. In Q. coccifera, Ψ
pd
changed similarly to that in C. siliqua except for plants
growing at site D3 where Ψ
pd
was consistently more
negative. Surprisingly, Ψ
min
recorded in Q. coccifera
dropped to –2.8 MPa in site H (September) with a ∆Ψ of
1.4 MPa.
It is of interest to note that the degraded sites were
warmer and drier than site H. In September 1998, maxi-
mum air temperatures recorded during the measurements
were 28.9, 32.4, 34.5 and 35.4 °C in sites H, D1, D2 and
D3, respectively. Minimum air relative humidity was
36.4, 34.2, 25.9 and 16.6 in sites H, D1, D2 and D3,
respectively.
3.3. Impact of water stress on single species (WSIS)
and vegetation (WSIV)
The integrals of the curves describing the diurnal pat-
tern of Ψ
L
change (WSIS) calculated for the three
species at the different study sites, are shown in figure 7.
The calculated WSIS’s were similar for the three species
in May, i.e. between 10 and 17 MPa h. In September,
WSIS’s distinctly increased, especially in Q. coccifera
and O. oleaster (to 25 and 32 MPa h, respectively). O.
oleaster plants showed impressively increasing impacts
of water stress in more degraded areas (sites D) with
respect to those growing in the reference site H.
When Ψ
pd
, Ψ
min
and ∆Ψ (= Ψ
pd
– Ψ
min
), were plotted
versus WSIS, linear relationships were observed
(figure8). The correlation between ∆Ψ and WSIS was
the poorest (r
2
= 0.44), with increased scatter of data at
high WSIS values. The best correlation was found
between Ψ
min
and WSIS (r
2
= 0.99) whereas the correla-
tion between Ψ
pd
and WSIS was intermediate
(r
2
= 0.75).
NDVI
0.0 0.1 0.2 0.3 0.4 0.5 0.6 0.7 0.8
Vegetation cover, %
55
60
65
70
75
80
85
H
D1
D2
D3
y=(a-b)
-cx
+b
a=
1
e-12
b=81.59
c=6.75
r
2
=0.906
Figure 3. Relationship between percentage vegetation cover
and remotely sensed Normalized Difference Vegetation Index
(NDVI). The curve represents the regression line to the equa-
tion and
r
2
is the correlation coefficient. Study sites are labelled
as H (well developed vegetation site), D1, D2 and D3 (degrad-
ed sites).
Diagnosing plant water status in Mediterranean drylands
119
The WSIV values (water stress impact weighed for
the relative frequencies of the three species studied), cal-
culated for the four study sites in September 1998, are
illustrated in
figure 9. Vegetation at sites H and D1 had
the lowest water stress (WSIV was about 50 MPA h);
WSIV increased for vegetation growing at sites D2 and
D3 (up to about 90 MPa h).
When the WSIV’s calculated for all the sites under
study were plotted versus NDVI values (
figure 10a), an
exponential relationship was noted between the two vari-
ables (
r
2
= 0.95). The correlation between WSIV and the
estimated vegetation cover of the four sites was highly
significant (r
2
= 0.963) (figure 10b).
Ceratonia siliqua
g
L
, mmol m
-2
s
-1
0
100
200
300
400
500
600
700
H May
H Sept
D1 Sept
D2 Sept
D3 Sept
Quercus coccifera
H May
H Sept
D1 Sept
D2 Sept
D3 Sept
Olea oleaster
H May
H Sept
D1 Sept
D2 Sept
D
3
Sept
Ceratonia siliqua
RWC, %
50
60
70
80
90
100
H May
H Sept
D1 Sept
D2 Sept
D3 Sept
Quercus coccifera
H May
H Sept
D1 Sept
D2 Sept
D3 Sept
Olea oleaster
H May
H Sept
D1 Sept
D2 Sept
D
3
Sept
Figure 4. Maximum diurnal leaf conductance to water vapour (g
L
) as recorded in the well developed vegetation site (H) in May and
September 1998 and in degraded sites in September 1998.
Figure 5. Minimum leaf relative water content (RWC) as recorded in the well developed vegetation site (H) in May and September
1998 and in degraded sites in September 1998.
M. Vertovec et al.
120
4. DISCUSSION
The close relationship observed between the directly
estimated and the remotely sensed vegetation cover (fig-
ure 3) suggests that NDVI was a sufficiently reliable
expression of vegetation density or leaf area in the four
sites under study. Because NDVI is a measure of the
reflectance of the red wavelengths by vegetation, it is
related to the total photosynthetic surface area (PhA).
Therefore, NDVI is sensitive to the dominant growth
form (grass, shrubs or trees) in an area. As an example,
at equal vegetation covers, a forest will show more PhA
than a shrub or grass vegetation so that NDVI will be
much higher in the former than in the latter case [7, 46].
This helps to explain why at 76 to 78% vegetation cover
as estimated in sites H and D1, respectively, NDVI was
almost double in site H (0.615) with respect to site D1
(0.317). Site H was dominated by trees whereas site D1
was dominated by shrubs. In other words, NDVI can be
conveniently used in cases of different vegetation densi-
ties with similar dominant growth forms but requires to
be corrected for large differences in this variable.
Ψ
L
,
MPa
-3.5
-3.0
-2.5
-2.0
-1.5
-1.0
-0.5
0.0
pre-dawn
minimum
H May
H Sept
D1 Sept
D2 Sept
D3 Sept
Ceratonia siliqua
-3.5
-3.0
-2.5
-2.0
-1.5
-1.0
-0.5
0.0
Quercus coccifera
H May
H Sept
D1 Sept
D2 Sept
D3 Sept
-7
-6
-5
-4
-3
-2
-1
0
Olea oleaster
H May
H Sept
D1 Sept
D2 Sept
D
3
Sept
Figure 6. Predawn and minimum diurnal leaf water potential (Ψ
L
) as recorded in the well developed vegetation site (H) in May and
September 1998 and in degraded sites in September 1998.
Ceratonia siliqua
0
10
20
30
40
50
60
70
80
H May
H Sept
D1 Sept
D2 Sept
D3 Sept
Quercus coccifera
H May
H Sept
D1 Sept
D2 Sept
D3 Sept
Olea oleaster
H May
H Sept
D1 Sept
D2 Sept
D3 Sept
WSIS, MP
a h
Figure 7. Water Stress Impact on Species (WSIS) calculated as the integral of the diurnal time course of leaf water potential between
predawn and sunset, as recorded in the well developed vegetation site (H) in May and September 1998 and in degraded sites in
September 1998.
Diagnosing plant water status in Mediterranean drylands
121
In previous studies [18, 19, 48], C. siliqua growing in
Sicily has been reported to behave like a typical drought
avoiding water spender [15]. A similar drought resis-
tance strategy was adopted by this species growing in
Turkey in that plants combined high maximum g
L
’s (fig-
ure 4) with high RWC’s (between 86 and 92%, figure 5)
as recorded in sites H, D1 and D2, and by relatively con-
stant Ψ
min
’s and Ψ
pd
’s as measured in the same sites.
This suggests that plants lost relatively large amounts of
water (high g
L
); however, leaves were able to maintain
relatively high RWC even in the warmest hours of the
day so that Ψ
min
was buffered to relatively constant val-
ues. A typical water spender is defined as a species capa-
ble of maintaining hydraulic equilibrium between water
loss and uptake [15, 18, 26]. In this sense, C. siliqua
behaved like a very efficient water spender. In the most
degraded site (D3), however, C. siliqua was no longer
capable of compensating for water loss. An almost com-
plete stomatal closure (g
L
dropped to 50 mmol m
–2
s
–1
)
could not prevent a further decrease in RWC (to 82%)
causing Ψ
min
to drop to –3.0 MPa. Under these condi-
tions, C. siliqua switched to a water saving strategy [15].
The consistent decrease of the frequency of the species
in sites D1 and D2, however, combined with the healthy
aspect of existing plants as well as with their high
RWC’s and g
L
’s, suggests that other factors like soil
nutrient content or wind could have limited the spatial
expansion of C. siliqua.
Species belonging to the genus Quercus are generally
considered as drought resistant as a group [1]. Several
studies have shown that different Quercus species can
adopt quite different resistance strategies to withstand
water shortage [2, 25, 26, 30, 49]. Nonetheless, the most
common strategy adopted by Quercus sp. to withstand
aridity is drought avoidance based on water saving. This
appeared to be true also in the case of Q. coccifera grow-
ing in different areas of Turkey. In fact, when growing in
degraded sites, this species reduced g
L
, thus maintaining
high RWC’s (over 80%) and preventing Ψ
L
to drop to
critical values. A similar strategy was reported by Lösch
et al. [20] for Q. coccifera plants growing in Portugal. It
is worth noting that a partial stomatal closure was suffi-
cient to reduce water loss in this species. In fact, plants
growing in the most degraded site (D3) were able to
maintain RWC’s at similar levels with respect to those
recorded in site H, by reducing g
L
by only about 60%. In
turn, Ψ
min
never dropped beyond about –3.0 MPa, a
value similar to Ψ
L
levels recorded in C. siliqua. Q. coc-
cifera was very competitive in degraded areas where this
species increased its relative frequency by about 50%
and, in fact, became dominant in sites D2 and D3
(tableI). The competitiveness of Q. coccifera in degrad-
ed areas might well be also due to ability to resprout
after fire or severe grazing.
O. oleaster plants appeared to be unable to prevent
dehydration in spite of consistent decrease of g
L
, when
-
Ψ
pd
, MPa
0
1
2
3
4
Coefficients:
b[0]=0.222
b[1]=0.048
r
2
=0.751
-
Ψ
min
, MPa
0
1
2
3
4
5
6
7
Coefficients:
b[0]=0.665
b[1]=0.079
r
2
=0.987
WSIS, MPa h
0 1020304050607080
∆Ψ MPa
0
1
2
3
4
Coefficients:
b[0]=0.443
b[1]=0.030
r
2
=0.437
,
Figure 8. Relationships between minimum leaf water potential
(
Ψ
min
), predawn leaf water potential (Ψ
pd
), maximum diurnal
leaf water potential drop (
∆Ψ = Ψ
pd
– Ψ
min
) and Water Stress
Impact on Species (WSIS) calculated for all the species under
study on the basis of equation (2). Solid lines are the linear
regressions and the dotted curves are the 95% confidence inter-
vals.
M. Vertovec et al.
122
subjected to increasing water stress. Stomatal closure, in
fact, was not sufficient to prevent water loss and RWC
dropped to about 70% in the most degraded sites (D2
and D3). Accordingly, Ψ
L
reached very negative values
(down to –6.8 MPa in site D3, figure 6), i.e. well below
the turgor loss point reported for this species by Lo
Gullo and Salleo [18] and by Duhme and Hinckley [9].
Because O. oleaster maintained its relative frequency
approximately the same for site D3 as for the other sites
(table I), on the basis of our data and in accordance with
previous reports [12, 18, 50], this species can be regard-
ed as a drought tolerant species [15].
It has been suggested [25, 26, 56] that the capability
of a given species to maintain high root hydraulic con-
ductance might represent one of the most important fac-
tors in determining the drought resistance strategy that
can be adopted by the species. In other words, the water
spending strategy as adopted by C. siliqua, would be
only possible if a sufficient amount of water can be
extracted from the soil and conducted to the leaves even
during the dry periods. This was likely to be the case for
C. siliqua, on the basis of a study by Nardini, Salleo and
Lo Gullo [27] conducted on C. siliqua plants growing in
Sicily. Here, plants were able to maintain or even
increase the hydraulic efficiency of the root system dur-
ing summer. In contrast, the root system of O. oleaster
proved to be extremely vulnerable to drought due to a
large reduction in root hydraulic conductance as mea-
sured in this species when exposed to drought stress [17,
27]. These results explain why O. oleaster, when grow-
ing in arid sites, underwent consistent dehydration even
at quite low g
L
levels. This, in turn, would cause a pro-
portional reduction in gas exchange and, hence, in bio-
mass production.
Calculating the integral of diurnal Ψ
L
changes for the
three study species, proved to be a useful method to
assess the impact of water stress on these species
(figure7). In particular, WSIS did not increase substan-
tially in plants of C. siliqua and Q. coccifera growing at
sites D1 and D2 versus those at site H. This suggested
that these species were able to limit the negative effects
of water shortage. Plants of C. siliqua and Q. coccifera
growing on the most degraded site (D3), however, were
under water stress and WSIS increased, accordingly. In
contrast, WSIS calculated for O. oleaster increased
markedly from site H to site D3; this species was unable
to prevent the negative effects of prolonged water
shortage.
Measurement of changes in water relations parameters
and, especially, WSIS suggested that C. siliqua and Q.
coccifera are species well adapted to aridity as induced
by environmental degradation. As a consequence, both
C. siliqua and Q. coccifera can be considered as suitable
candidates to natural reforestation of degraded areas of
the Mediterranean Basin region. Moreover, Carob tree is
a species of increasing economic interest for industrial
use of seeds and fruits [10, 35, 61, 62]. Although O.
oleaster was very sensitive to aridity, this species was a
suitable indicator of the degree of degradation of the dif-
ferent areas under study and, hence, it could be conve-
niently used as a “field biomonitor” [34, 40].
When comparing WSIS to some of the most common-
ly used
Ψ
L
reference parameters (i.e. Ψ
min
, Ψ
pd
and ∆Ψ),
the best correlation existed between WSIS and Ψ
min
. It
should be noted, however, that Ψ
min
was calculated as
the mean of Ψ
L
levels recorded during the warmest
hours of the day (i.e. between 10:00 and 14:00) and not
as the minimum diurnal Ψ
L
as measured at one point in
the day as more typically done. Some Mediterranean
species such as Laurus nobilis L. [18] reach a minimum
diurnal Ψ
L
that is maintained for less than one hour i.e.
Ψ
L
raises again quite rapidly. In this case, Ψ
min
may not
be the true expression of the impact of water stress on a
plant. Therefore, we feel that the most reliable method to
assess the impact of water stress on different species is to
measure the whole curve of Ψ
L
diurnal changes and then
calculating WSIS on the basis of equation (2).
Site H Site D1 Site D2 Site D3
WSIV, MP
a h
0
20
40
60
80
100
Figure 9. Water Stress Impact on Vegetation (WSIV) calculat-
ed on the basis of equation (4) as the sum of the Water Stress
Impact on Species (WSIS) measured in September 1998, times
the species relative frequency. Sites are labelled as H (well
developed vegetation site), D1, D2 and D3 (degraded sites).
Diagnosing plant water status in Mediterranean drylands
123
In our opinion, an interesting result emerging from the
present study is the possibility of scaling up the impact
of water stress from the single-species level to the level
of vegetation as represented by one or more selected
dominant species i.e. calculating WSIV on the basis of
equation (4). In our case, WSIV (figure 9) was very sim-
ilar for species growing at sites H and D1, but it
increased significantly for more degraded sites (WSIV
increased by 36 and 76% for species growing in sites D2
and D3, respectively).
Recent ecological research has related the amount of
different abiotic stresses suffered by plants to remotely
sensed features of vegetation [4, 28, 36, 37, 38, 41, 44,
63]. In the present study, the possibility of using field
measurements of leaf water potential as a tool for relat-
ing the amount of water stress suffered by vegetation to
simple satellite-derived indices, like NDVI, was investi-
gated. A negative, exponential relationship appeared to
exist between WSIV and NDVI (figure 10a) whereas a
linear relationship was noted between WSIV and percent
vegetation cover (figure 10b). In particular, our data sug-
gest, at least for Mediterranean sclerophyllous vegetation
growing in coastal regions of Turkey, that NDVI’s
smaller than about 0.3 indicate a critical transition point
in vegetation status below which the risk of desertifica-
tion increases dramatically and that, therefore, such areas
need to be monitored more frequently and accurately
and, if possible, promptly restored.
We are aware that the small number of the sites stud-
ied (only four sites) does not provide a fully adequate
evaluation of a number of the relationships explored in
this study. In this view, our results have to be seen as a
preliminary approach to the problem. Nonetheless, the
close relationship of WSIV to NDVI appears sufficiently
promising to deserve more studies. Such studies might
include: a) more sites per region, in order to confirm the
validity of equation (4); b) a more comprehensive evalu-
ation of growth form, density and leaf area index.
Acknowledgements: The present study was funded
by EU in the frame of the project entitled:
“Desertification in Mediterranean Drylands:
Development of a monitoring System based on Plant
Ecophysiology” (DEMOS, Contract No. IC18-CT97-
0153).
REFERENCES
[1] Abrams M.D., Adaptations and responses to drought in
Quercus species of North America, Tree Physiol. 7 (1990)
227–238.
[2] Acherar M., Rambal S., Comparative water relations of
four Mediterranean oak species, Vegetatio 99/100 (1992)
177–184.
[3] Améglio T., Archer P., Cohen M., Valancogne C.,
Daudet F.A., Dayau S., Cruiziat P., Significance and limits in
the use of predawn leaf water potential for tree irrigation, Plant
Soil 207 (1999) 155–167.
[4] Baret F., Use of spectral reflectance variation to retrieve
canopy biophysical characteristics, in: Danson F.M., Plummer
S.E. (Eds.), Advances in Environmental Remote Sensing, John
Wiley & Sons, New York, 1995, pp. 33–51.
[5] Benyon R.G., Nighttime water use in an irrigated
Eucalyptus grandis plantation, Tree Physiol. 19 (1999)
853–859.
[6] Bond B.J., Kavanagh K.L., Stomatal behavior of four
woody species in relation to leaf-specific hydraulic
NDVI
0.0 0.1 0.2 0.3 0.4 0.5 0.6 0.7 0.8
WSIV, MPa h
40
50
60
70
80
90
100
H
D1
D2
D3
y=a+b
-x/c
a=47.97
b=1119.78
c=0.057
r
2
=0.949
Vegetation cover, %
55 60 65 70 75 80
WSIV, MPa h
40
50
60
70
80
90
100
y = -1.77x
+
185.94
r
2
=0.963
D3
D2
D1
H
Figure 10. Relationship between Water Stress Impact on
Vegetation (WSIV), Normalized Difference Vegetation Index
(NDVI) and percentage vegetatio cover. The regressions are
reported toghether with the correlation coefficient
r
2
. Sites are
labelled as H (well developed vegetation site), D1, D2 and D3
(degraded sites).
M. Vertovec et al.
124
conductance and threshold water potential, Tree Physiol. 19
(1999) 503–510.
[7] Danson F.M., Developments in the remote sensing of
forest canopy structure, in: Danson F.M., Plummer S.E. (Eds.),
Advances in Environmental Remote Sensing, John Wiley &
Sons, New York, 1995, pp. 53–69.
[8] Donovan L.A., Grisé D.J., West J.B., Pappert R.A.,
Alder N.N., Richards J.H., Predawn disequilibrium between
plant and soil water potentials in two cold-desert shrubs,
Oecologia 120 (1999) 209–217.
[9] Duhme F., Hinckley T.M., Daily and seasonal variation
in water relations of macchia shrubs and trees in France
(Montpellier) and Turkey (Antalya), Vegetatio 99/100 (1992)
185–198.
[10] Fenaroli L., Guida agli Alberi d’Italia, Giunti Martello,
Firenze, 1984.
[11] Fischer R.A., Turner N.C., Plant productivity in the
arid and semiarid zones, Ann. Rev. Pl. Physiol. Pl. Mol. Biol.
29 (1978) 277–317.
[12] Giorio P., Sorrentino G., d’Andria R., Stomatal behav-
iour, leaf water status and photosynthetic response in field-
grown olive trees under water deficit, Environ. Exp. Bot. 42
(1999) 95–104.
[13] Grove A.T., Desertification in Southern Europe, Clim.
Change 9 (1986) 49–57.
[14] Hardegree S.P., Xylem water holding capacity as a
source of error in water potential estimates made with the pres-
sure chamber and thermocouple psychrometer, Am. J. Bot. 76
(1989) 356–360.
[15] Levitt J., Responses of Plants to Environmental
Stresses, Academic Press, New York, 1980.
[16] Lillesand T.M., Kiefer R.W., Remote Sensing and
Image Interpretation, John Wiley & Sons, New York, 1994.
[17] Lo Gullo M.A., Nardini A., Salleo S., Tyree M.T.,
Changes in root hydraulic conductance (K
R
) of Olea oleaster
seedlings following drought stress and irrigation, New Phytol.
140 (1998) 25–31.
[18] Lo Gullo M.A., Salleo S., Different strategies of
drought resistance in three Mediterranean sclerophyllous trees
growing in the same environmental conditions, New Phytol.
108 (1988) 267–276.
[19] Lo Gullo M.A., Salleo S., Rosso R., Drought avoidance
strategy in
Ceratonia siliqua L., a mesomorphic-leaved tree in
the xeric Mediterranean area, Ann. Bot. 58 (1986) 745–756.
[20] Lösch R., Tenhunen J.D., Pereira J.S., Lange O.L.,
Diurnal courses of stomatal resistance and transpiration of wild
and cultivated Mediterranean perennials at the end of the sum-
mer dry season in Portugal, Flora 172 (1982) 138–160.
[21] Margaris N.S., Koutsidou E., Giourga C., Changes in
traditional Mediterranean land-use systems, in: Brandt J.,
Thornes J.B. (Eds.), Mediterranean Desertification and Land
Use, John Wiley & Sons, New York, 1996, pp. 29–42.
[22] Mather P.M., Computer Processing of Remotely-
Sensed Images, John Wiley & Sons, New York, 1987.
[23] Mishio M., Yokoi Y., A model for estimation of water
flow resistance in soil-leaf pathway under dynamic conditions,
J. Exp. Bot. 42 (1991) 541–546.
[24] Mooney H.A., Habitat, plant form, and plant water
relations in Mediterranean-climate regions, Ecol. Med. 8
(1982) 481–488.
[25] Nardini A., Lo Gullo M.A., Salleo S., Competitive
strategies for water availability in two Mediterranean
Quercus
species, Plant Cell Environ. 22 (1999) 109–116.
[26] Nardini A., Pitt F., Drought resistance of
Quercus
pubescens
as a function of root hydraulic conductance, xylem
embolism and hydraulic architecture, New Phytol. 143 (1999)
485–493.
[27] Nardini A., Salleo S., Lo Gullo M.A., Root hydraulic
conductance of six forest trees: possible adaptive significance
of seasonal changes, Pl. Biosys. 132 (1998) 97–104.
[28] Nemani R., Pierce L.L., Running S.W., Goward S.,
Developing satellite-derived estimates of surface moisture sta-
tus, J. Appl. Meteor. 32 (1993) 548–556.
[29] Nilsen E.T., Orcutt D.M., The Physiology of Plants
under Stress, John Wiley & Sons, New York, 1996.
[30] Oliveira G., Correia O.A., Martins-Louçao M.A.,
Catarino F.M., Water relations of cork-oak (
Quercus suber L.)
under natural conditions, Vegetatio 99/100 (1992) 199–208.
[31] Ozturk M., Recovery and rehabilitation of
Mediterranean type ecosystems: a case study from Turkish
maquis, in: Rapport D., Gaudet C.L., Calow P. (Eds.),
Evaluating and Monitoring the Health of Large-Scale
Ecosystems, Springer Verlag, Berlin, 1995, pp. 319–332.
[32] Ozturk M., Urban ecology and land degradation, in:
Farina A. (Ed.), Perpectives in Ecology, Backhuys Publishers,
Leiden, 1999, pp. 115–120.
[33] Ozturk M., Celik A., Nurlu E., Erdem U., Land degra-
dation in relation to urbanisation and industrialisation in the
West Anataolian region of Turkey, in: Kapur S. (Ed.),
International Conference on Land Degradation, Cukurova
University, Adana, 1996, p. 62.
[34] Ozturk M., Secmen O., Kondo K., Transpirational
studies on some macchia elements, Mem. Fac. Integ. Arts Sci.
Hirosh. Univ
. 8 (1983) 68–76.
[35] Ozturk M., Vardar Y., Chemical composition of Carob
seed, Phyton 33 (1975) 63–64.
[36] Peñuelas J., Filella I., Visible and near-infrared
reflectance techniques for diagnosing plant physiological sta-
tus, Trends Pl. Sci. 3 (1998) 151–156.
[37] Peñuelas J., Inoue Y., Reflectance indices indicative of
changes in water and pigment contents of peanut and wheat
leaves, Photosynthetica 36 (1999) 355–360.
[38] Pierce L.L., Running S.W., Riggs G.A., Remote detec-
tion of canopy water stress in coniferous forests using the
NS001 thematic mapper simulator and the thermal infrared
multispectral scanner, Photogram. Engin. Rem. Sens
. 56 (1990)
579–586.
[39] Plummer S.E., Danson F.M., Wilson A.K., Advances
in remote sensing technology, in: Danson F.M., Plummer S.E.
Diagnosing plant water status in Mediterranean drylands
125
(Eds.), Advances in Environmental Remote Sensing, John
Wiley & Sons, New York, 1995, pp. 1–7.
[40] Powell R.L., The use of vascular plants as “field” bio-
monitors, in: Wang W., Gorsuch J.W., Hughes J.S. (Eds.),
Plants for Environmental Studies, Lewis Publishers, New
York, 1997, pp. 335–365.
[41] Purevdorj T., Tateishi R., Ishiyama T., Honda Y.
(1998) Relationships between percent vegetation cover and
vegetation indices, Int. J. Rem. Sens. 19 (1998) 3519–3535.
[42] Richter H., The water status in the plant. Experimental
evidence, in: Lange O.L., Kappen L., Schulze E.D. (Eds.),
Water in Plant Life. Ecological Studies 19, Springer Verlag,
Berlin, 1976, pp. 42–58.
[43] Richter H., Water relations of plants in the field: some
comments on the measurement of selected parameters, J. Exp.
Bot. 48 (1997) 1–7.
[44] Riggs G.A., Running S.W., Detection of canopy water
stress in conifers using the airborne imaging spectrometer,
Rem. Sens. Environ. 35 (1991) 51–68.
[45] Ritchie G.A., Hinckley T.M., The pressure chamber as
an instrument for ecological research, Adv. Ecol. Res. 9 (1975)
165–254.
[46] Running S.W., Estimating terrestrial primary produc-
tivity by combining remote sensing and ecosystem simulation,
in: Hobbs R.J., Mooney H.A. (Eds.), Remote Sensing of
Biosphere Functioning, Springer Verlag, New York, 1990, pp.
65–86.
[47] Salleo S., Water relations parameters of two Sicilian
species of
Senecio (Groundsel) measured by the pressure bomb
technique, New Phytol. 95 (1983) 178–188.
[48] Salleo S., Lo Gullo M.A., Different aspects of cavita-
tion resistance in Ceratonia siliqua, a drought-avoiding
Mediterranean tree, Ann. Bot. 65 (1989) 259–270.
[49] Salleo S., Lo Gullo M.A., Sclerophylly and plant water
relations in three Mediterranean
Quercus species, Ann. Bot. 65
(1990) 259–270.
[50] Salleo S., Lo Gullo M.A., Drought resistance strategies
and vulnerability to cavitation of some Mediterranean sclero-
phyllous trees, in: Borghetti M., Grace J., Raschi A. (Eds.),
Water Transport in Plants under Climatic Stress, Cambridge
University Press, Cambridge, 1993, pp. 99–113.
[51] Salleo S., Nardini A., Lo Gullo M.A., Is sclerophylly of
Mediterranean evergreens and adaptation to drought? New
Phytol. 135 (1997) 603–612.
[52] Salleo S., Nardini A., Lo Gullo M.A., Pitt F., Xylem
cavitation and hydraulic control of stomatal conductance in
Laurel (
Laurus nobilis L.), Plant Cell Environ. 23 (2000)
71–79.
[53] Stirzaker R.J., Passioura J.B., The water relations of the
root-soil interface, Plant Cell Environ. 19 (1996) 201–208.
[54] Stoms D.M., Hargrove W.W., Potential NDVI as a
baseline for monitoring ecosystem functioning, Int. J. Remote
Sens. 21 (2000) 401–407.
[55] Stuart Chapin III F., Integrated responses of plants to
stress, Bioscience 41 (1991) 29–36.
[56] Terradas J., Savé R., The influence of summer and
winter stress and water relationships on the distribution of
Quercus ilex L., Vegetatio 99/100 (1992) 137–145.
[57] Thornes J.B., Introduction, in: Brandt J., Thornes J.B.
(Eds.), Mediterranean Desertification and Land Use, John
Wiley & Sons, New York, 1996, pp. 1–11.
[58] Tyree M.T., Ewers F.W., The hydraulic architecture of
trees and other woody plants, New Phytol. 119 (1991)
345–360.
[59] Tyree M.T., Hammel H.T., The measurement of the
turgor pressure and water relations of plants by the pressure
bomb technique, J. Exp. Bot., 23 (1972) 267–282.
[60] Tyree M.T., Karamanos A.J., Water stress as an eco-
logical factor, in: Grace J., Ford E.D., Jarvis P.G. (Eds.), Plants
and their Atmospheric Environment, Blackwell, Oxford, 1980,
pp. 237–261.
[61] Vardar Y., Secmen O., Ozturk M., Preliminary results
on the chemical composition of the Turkish carob beans, Qual.
Plant. Mat. Veget
. 21 (1972) 367–379.
[62] Vardar Y., Secmen O., Ozturk M., Some distributional
problems and biological characteristics of
Ceratonia in Turkey,
Acta Biol. Portug. 16 (1980) 75–86.
[63] Waring R.H., Lessons learned while extending physio-
logical principles from growth chambers to satellite studies,
Tree Physiol. 18 (1998) 491–497.