Báo cáo lâm nghiệp: "2 CO response curves can be a measured with field-portable closed-loop photosynthesis system" doc
Bạn đang xem bản rút gọn của tài liệu. Xem và tải ngay bản đầy đủ của tài liệu tại đây (290.1 KB, 5 trang )
CO
2
response
curves
can
be
measured
with
a
field-portable
closed-loop
photosynthesis
system
D.K.
McDermitt
T.J.
Arkebauer
2
J.M.
Norman
2
*,
J.M.
Welles
1
J.T.
Davis
3
nd
S.R.
Rc
T.M.
Ball
2
mer
1
T.J.
Arkebauer
J.M.
Welles
S.R.
Roerner
1
1
LI-COR,
Inc.,
Lincoln,
NE
68504,
2
Department
of
Agronomy,
University
of
Nebraska,
Lincoln,
NE
68583,
3
Department
of
Forestry,
Fisheries
and
Wildlife,
University
of
Nebras!ka,
Lincoln,
NE
68583,
and
4
Carnegie
Institution
of
Washington,
Stanford,
CA
94305,
U.S.A.
Introduction
Assimilation
rate
versus
internal
C0
2
re-
sponse
curves
provide
an
important
tool
for
assessing
the
efficiency
and
capacity
of
the
photosynthetic
system.
Until
recent-
ly,
measurement
of
C0
2
response
curves
was
limited
to
laboratory
studies,
where
elaborate
gas
exchange
systems
were
available,
or
to
mobile
field
laboratories.
Here
we
report
the
use
of
a
portable
pho-
tosynthesis
system
(LI-6200,
LI-COR,
Inc.)
for
measurement
of
response
curves.
The
LI-6200
uses
a
closed-loop
design
in
which
varying
C0
2
concentrations
are
pro-
vided
as
the
leaf
removes
C0
2
from
the
system.
A
typical
measurement
requires
10-25
min,
depending
upon
chamber
volume,
leaf
area
and
assimilation
rate.
Response
curves
measured
on
well-
watered
soybean
and
cotton
with
the
LI-
6200
are
compared
to
those
measured
*
Present
address:
Department
of
Soils,
University
of
Wis
with
a
fully
controlled
steady
state
system.
The
effects
of
system
leaks
and
control
of
leaf
temperature
are
discussed.
Materials
and
Methods
Data
of
Fig.
1
were
obtained
on
well-watered
soybeans
(Glycine
max
(L.)
Merrill,
cv
Hobbit)
grown
in
soil
and
12
in
pots
in
a
temperature-
controlled
(27
±
3°C)
greenhouse
in
Lincoln,
NE.
Measurements
were
made
on
upper
cano-
py
fully
exposed
leaves
when
the
plants
were
in
the
early
pod-filling
stage.
PAR
was
supplied
by
one
Metalarc
400
W
lamp
and
one
Lucolux
400
W
lamp
in
a
single
water-cooled
luminaire
(Sun-
brella,
Environmental
Growth
Chambers,
Cha-
grin
Falls,
OH).
1’he
1
I chamber
of
the
LI-6200
was
mounted
on
a
tripod
and
placed
at
a
dis-
tance
beneath
the
lamp
which
gave
the
desired
light
intensity.
Radiation
from
the
lamp
was
fil-
tered
with
1/4
in
plexiglas
and
external
air
flow
was
provided
by
a
small
110
V
fan.
Response
curves
were
constructed
as
described
in
results.
consin,
Madison.
Wl
53706.
U.S.A.
*
Present
address:
Department
of
Soils,
University
of
Wisconsin,
Madison.
Wl
53706.
U.S.A.
**
Present
address:
Systems
Ecology
Group,
California
State
University,
San
Diego,
CA
92t 20,
U.S.A.
Data
of
Figs.
2,
3
and
4
were
obtained
on
vegetative
soybeans
grown
in
vermiculite
and
8
in
pots
in
the
greenhouse
at
Carnegie
Institu-
tion,
Stanford,
CA.
Measurements
were
made
in
an
adjacent
laboratory
with
the
steady
state
system
described
by
Ball
(1987),
and
with
the
LI-6200. Relative
humidity
sensor
and
IRGA
calibrations
were
carefully
compared
and
checked
prior
to
measurement.
PAR
(1200-1300
UMO
I-
M-2-S-1)
was
supplied
by
a
high
intensity
projector
lamp
filtered
with
a
dichroic
mirror.
Comparative
measurements
were
made
on
the
same
leaflets.
Data
reported
in
Figs.
2,
3
and
4
were
obtained
with
chamber
relative
humidity
(RH)
above
72%
in
both
sys-
tems.
A
response
curve
measured
on
soybean
with
the
LI-6200
at
ambient
humidity
(32%)
deviated
from
a
concomitant
curve
measured
with
the
steady
state
system
at
about
70%
RH.
The
pattern
of
photosynthesis
rates
and
internal
C0
2
concentrations
suggested
that
stomatal
conductance
was
not
uniform
across
the
leaf
at
the
lower
humidity
(Terashima
et
al.,
1988;
data
not
shown).
Data
of
Fig.
5
were
obtained
on
vegetative
cotton
grown
in
nutrient
solution
at
33°C,
about
35%
RH
and 600
llmol
’
m-
2’
s-
1
light
intensity.
Further
details
pertaining
to
the
measurements
are
given
in
the
text.
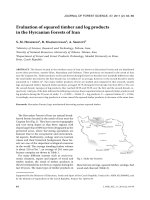
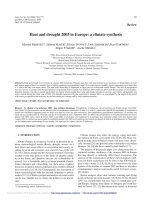
Results
A
baseline
C0
2
response
curve
was
mea-
sured
by
placing
a
single
soybean
leaflet
in
the
1
I assimilation
chamber
of
the
LI-
6200
and
allowing
the
leaflet
to
remove
C0
2
until
the
compensation
point
was
reached.
Assimilation
rate,
conductance
and
internal
C0
2
concentration
were
com-
puted
every
5
ppm
or
so
as
the
chamber
C0
2
mole
fraction
declined.
This
was
repeated
2
more
times
and
all
curves
were
coincident
(data
not
shown).
A
4th
curve
was
prepared
in
which
the
C0
2
mole
fraction
was
held
constant
(±
5
pmol
’
mol-
1)
for
5
min
at
7
different
levels
using
a
C0
2
injector.
Assimilation,
conductance
and
C,
were
then
measured
in
transient
mode
by
allowing
the
C0
2
mole
fraction
to
decline
a
few
ppm
from
each
of
the
preset
levels
(Fig.
1
Since
the
curve
measured
by
continuous
draw-
down
is
coincident
with
that
measured
after
a
5
min
equilibration
at
each
C0
2
level,
we
conclude
that
the
2
methods
are
equivalent.
Soybean
leaflets
are
evidently
able
to
maintain
a
quasi-steady
state
with
a
slowly
declining
(0.01-1
ppm-s-
1)
ex-
ternal
C0
2
concentration.
Three
other
experiments
gave
the
same
result.
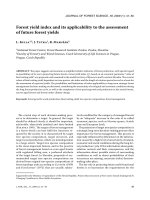
To
further
evaluate
results
obtained
with
the
LI-6200,
response
curves
were
mea-
sured
on
soybeans
with
a
steady
state
system
described
by
Ball
(1987)
and
side-
by-side
measurements
were
made
on
the
same
leaves
under
similar
conditions
with
the
LI-6200
(Fig.
2).
Correspondence
be-
tween
the
2
methods
is
generally
excellent
except
that
the
C0
2
compensation
point
is
slightly
overestimated
by
the
LI-6200.
At
low
chamber
C0
2
mole
fractions,
a
large
C0
2
gradient
exits
between
chamber
air
and
ambient
air
exaggerating
chamber
leaks
that
are
normally
small.
Leaks
cause
an
underestimation
of
the
assimilation
rate,
and
consequently,
an
overestimation
of
the
compensation
point.
Chamber
leaks
can
be
modeled
by
the
following
expression:
(
dccham
b
er
/dt
)
(Cambient-
G
chamber
/
’l’);
where
dCcnamber!dtis
the
C0
2
change
rate
due
to
chamber
leaks
(s-!),
C
amb
i
ent
is
the
C0
2
mole
fraction
of
ambient
air
sur-
rounding
the
chamber
(pmol
’
mol-
1
or
pp
m),
Gchamber
is
the
chamber
C0
2
mole
fraction,
and
r
is
the
leak
rate
time
constant
(s).
A
simple
leak
test
can
be
performed
by
first
reducing
the
chamber
C0
2
mole
fraction
to
50-100
ppm
using
the
system
C0
2
scrubber,
and
then
measuring
the
rate
of
C0
2
increase
(dCcnamber!dn
with
a
filter
paper
leaf
rep-
lica
in
the
chamber.
Since
the
chamber
C0
2
mole
fraction
is
always
known,
and
the
ambient
C0
2
mole
fraction
is
constant
and
easily
measured,
r can
be
computed.
We
have
found
that
a
is
constant
and
in-
dependent
of
the
C0
2
gradient
for
a
given
set
of
conditions.
Once
r,
G
chamber
and
C
amb
i
en
t
are
known,
the
leak
rate
can
be
computed
and
subtracted
from
the
mea-
sured
C0
2
change
rate.
The
LI-6200
can
be
programmed
to
calculate
the
leak
rate
and
correct
each
assimilation
measure-
ment
as
the
chamber
C0
2
mole
fraction
declines.
Both
corrected
and
uncorrected
data
can
be
stored.
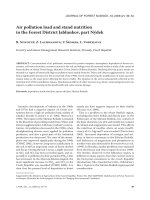
As
the
experiments
reported
in
Figs.
2-5
progressed,
r
declined
from
about
15
000
s
to
about
7000
s,
presumably
due
to
chamber
gasket
deterioration.
The
effects
of
leaks
on
the
LI-6200
data
from
Fig.
2
are
shown
in
Fig.
3
for
2
values
of
a.
Chamber
leaks
have
important
effects
at
low
chamber
C0
2
mole
fractions,
but
negligible
effects
at
ambient
levels.
In
ordi-
nary
photosynthesis
measurements
where
C0
2
concentrations
are
near
ambient,
only
small
gradients
exist
to
drive
C0
2
dif-
fusion
into
the
chamber,
so
chamber
leaks
are
not
a
problem.
However,
when
C0
2
response
curves
are
being
measured,
leak
tests
should
be
performed
regularly,
and
the
data
corrected
accordingly.
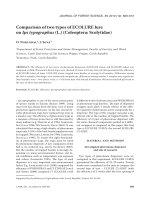
Fig.
4
shows
the
LI-6,200
data
from
Fig.
2
after
the
leak
correction
was
applied.
The
cor-
respondence
between
the
steady
state
and
LI-6200
results
is
excellent.
Similar
results
were
obtained
in
a
2nd
experiment.
C0
2
response
curves
for
2
separate
leaves
of
chamber-grown
cotton
were
measured
late
in
the
afternoon.
Leaves
were
trimmed
symmetrically
about
the
mid-vein
prior
to
measurement.
LI-6200
data
were
first
obtained
in
the
growth
room,
and
then
the
plants
were
trans-
ferred
into
fresh
growth
solution,
taken
down
a
cool,
dimly
lit
outside
hallway
and
into
the
laboratory,
where
steady
state
measurements
were
performed.
Results
for
both
the
steady
state
system
and
LI-
6200
are
shown
in
Fig.
5.
Compensation
points
and
initial
slopes
are
in
excellent
agreement,
but
maximum
rates
were
higher
when
measured
in
situ
with
the
LI-
6200.
There
is
little
doubt
that
the
time
of
day
and
prior
treatment
of
the
plants
affec-
ted
maximal
rates
measured
with
the
stea-
dy
state
system.
Discussion
These
and
other
experiments
support
the
conclusion
that
well-watered
C-3
plant
leaves
are
able
to
maintain
a
quasi-steady
state
with
respect
to
C0
2
mole
fractions
which
change
at
the
rates
observed
in
typical
experiments
(e.g.,
0.01-1
ppm-s-
1
).
Under
these
conditions,
the
transient
approach
provides
a
valid
method
for
measuring
C0
2
response
curves.
It
is
rapid
and
convenient
inas-
much
as
it
does
not
require
a
series
of
mixed
gasses
or
long
equilibration
times,
and
it
can
be
performed
with
a
compact
and
portable
instrument.
However,
a
major
question
which
remains
is
leaf
tempera-
ture
control.
Leaf
temperature
control
in
the
LI-6200
chamber
relies
on
evaporative
cooling
of
the
leaf
and
passive
heat
exchange
with
the
environment.
Since
there
is
no
active
temperature
control,
leaf
temperature
increases,
which
might
occur
during
a
measurement
lasting
20
min
or
more,
are
a
matter
of
concern.
As
indicated
in
the
figure
legends,
leaf
temperature
control
in
artificial
environments
is
not
a
serious
problem.
High
intensity
incandescent
lamps
which
produce
a
narrow
light
beam
can
be
filtered
with
a
dichroic
mirror.
Such
a
light
source
was
used
to
produce
the
data
of
Figs.
3-5.
Clear
plexiglas
makes
an
excellent
IR
filter
for
high
intensity
discharge
lamps.
A
plexiglas
filter,
along
with
an
external
fan
and
water-cooled
luminaire,
effectively
controlled
leaf
tem-
perature
increases
under
our
HID
lamp.
The
problem
is
more
serious
in
the
field,
although
it
is
not
insurmountable.
Davis
et
al.
(1987)
reported
a
chamber
tempera-
ture
increase
of
only
1.3°C
while
mea-
suring
a
C0
2
response
curve
on
green
ash
under
full
sun
(1750
j1mol
’
m-
2’
s-
1,
35°C).
In
many
cases,
moderate
chamber
and
leaf
temperature
increases
of
2-3°C
occur
during
a
measurement
in
full
sun.
Under
unfavorable
conditions,
tempera-
ture
increases
of
up
to
6°C
have
been
observed;
this,
of
course,
is
unacceptable.
Keeping
the
chamber
cool
and
shaded
when
not
in
use,
and
adequate
transpi-
ration
rates,
help
to
moderate
temperature
increases.
The
infrared
filters
that
work
so
well
under
artificial
lights
do
not
help
very
much
in
the
field
because
plant
leaves
have
relatively
little
absorptance
in
the
near
IR,
and
the
solar
spectrum
has
rela-
tively
little
energy
in
the
longer
wave
regions.
However,
an
external
fan
does
a
surprisingly
good
job
of
moderating
cham-
ber
temperature
increases.
One
of
us
(JMN)
found
that
when
a
Big
Blue
Stem
(Andropogon
gerardii
Vitman)
leaf
of
about
5
cm
2
was
enclosed
in
the
1/4
I chamber
at
an
outside
air
temperature
of
40°C,
the
chamber
air
temperature
remained
near
41 °C
with
an
external
fan,
whereas
the
chamber
air
temperature
gradually
in-
creased
to
44°C
without
the
fan.
With
proper
techniques,
temperature
increases
can
often
be
held
to
under
2-3°C.
The
data
of
Brooks
and
Farquhar
(1985)
on
spinach
indicate
that
a
2°C
temperature
increase
at
30°C
would
cause
a
7%
increase
in
the
photorespiratory
C0
2
com-
pensation
point.
References
Ball
J.T.
(1987)
Calculations
related
to
gas
exchange.
In:
Stomatal
Function.
(Zeiger
E.,
Farquhar
G.D.
t3<
Cowan
I.R.,
eds.),
Stanford
University
Press,
Stanford,
CA
Brooks
A.
&
Farquhar
G.D.
(1985)
Effect
of
temperature
on
the
C0
2
/0
2
specificity
of
ribu-
los-1,5-bisphosphate
carboxylase/oxygenase
and
the
rate
of
respiration
in
the
light.
Planta
165, 397
Davis
J.E.,
Arkebauer
T.J.,
Norman
J.M.
&
Brandle
J.R.
(19137)
Rapid
field
measurement
of
the
assimilatiorn
rate
versus
internal
C0
2
concentration
relationship
in
green
ash
(Fraxi-
nus
pennsylvan:ica
Marsh.):
the
influence
of
light
intensity.
Tree
PhysioL
3,
387
Terashima
I.,
Wong
S.C.,
Osmond
C.B.
&
Far-
quhar
G.D.
(1988)
Characterisation
of
non-
uniform
photosynthesis
induced
by
abscisic
acid
in
leaves
having
different
mesophyll
anatomies.
Plant
Cell
Physiol.
29,
385