Linux Server Hacks Volume Two phần 8 doc
Bạn đang xem bản rút gọn của tài liệu. Xem và tải ngay bản đầy đủ của tài liệu tại đây (5.51 MB, 41 trang )
Searching for sniffer's logs, it may take a while… nothing found
Searching for HiDrootkit's default dir… nothing found
Searching for t0rn's default files and dirs… nothing found
Searching for t0rn's v8 defaults… nothing found
Searching for Lion Worm default files and dirs… nothing found
Searching for RSHA's default files and dir… nothing found
Searching for RH-Sharpe's default files… nothing found
Searching for Ambient's rootkit (ark) default files and dirs…nothing found
Searching for suspicious files and dirs, it may take a while…
/usr/lib/jvm/java-1.4.2-sun-1.4.2.08/jre/.systemPrefs
/usr/lib/perl5/5.8.6/x86_64-linux-thread-multi/.packlist
Searching for LPD Worm files and dirs… nothing found
Searching for Ramen Worm files and dirs… nothing found
Searching for Maniac files and dirs… nothing found
Searching for RK17 files and dirs… nothing found
Searching for Ducoci rootkit… nothing found
Searching for Adore Worm… nothing found
Searching for ShitC Worm… nothing found
Searching for Omega Worm… nothing found
Searching for Sadmind/IIS Worm… nothing found
Searching for MonKit… nothing found
Searching for Showtee… nothing found
Searching for OpticKit… nothing found
Searching for T.R.K… nothing found
Searching for Mithra… nothing found
Searching for OBSD rk v1… nothing found
Searching for LOC rootkit… nothing found
Searching for Romanian rootkit… nothing found
Searching for Suckit rootkit… nothing found
Searching for Volc rootkit… nothing found
Searching for Gold2 rootkit… nothing found
Searching for TC2 Worm default files and dirs… nothing found
Searching for Anonoying rootkit default files and dirs… nothing found
Searching for ZK rootkit default files and dirs… nothing found
Searching for ShKit rootkit default files and dirs… nothing found
Searching for AjaKit rootkit default files and dirs… nothing found
Searching for zaRwT rootkit default files and dirs… nothing found
Searching for Madalin rootkit default files… nothing found
Searching for Fu rootkit default files… nothing found
Searching for ESRK rootkit default files… nothing found
Searching for anomalies in shell history files… nothing found
Checking 'asp'… not infected Checking 'bindshell'… not infected
Checking 'lkm'… chkproc: nothing detected
Checking 'rexedcs'… not found
Checking 'sniffer'…
eth0: not promisc and no PF_PACKET sockets
vmnet8: not promisc and no PF_PACKET sockets
vmnet1: not promisc and no PF_PACKET sockets
Checking 'w55808'… not infected
Checking 'wted'… chkwtmp: nothing deleted
Checking 'scalper'… not infected
Checking 'slapper'… not infected
Checking 'z2'… chklastlog: nothing deleted
Checking 'chkutmp'… chkutmp: nothing deleted
It seems like I'm clean, and that's a lot of tests! As you can see, chkrootkit first checks a variety of system
binaries for strings that would indicate that they've been hacked, then checks for the indicators of known
rootkits, checks network ports for spurious processes, and so on. I feel better already.
If you are running additional security software such as PortSentry
( you may get false positives (i.e., reports
286
286
of problems that aren't actually problems) from the bindshell test, which looks for
processes that are monitoring specific ports.
If you want to be even more paranoid than chkrootkit's normal behavior, you can run chkrootkit with its -x
(expert) option. This option causes chkrootkit to display detailed test output in order to give you the
opportunity to detect potential problems that may be evidence of rootkits that the version of chkrootkit that
you're using may not (yet) be able to identify.
7.7.4. Automating chkrootkit
Running chkrootkit "every so often" is a good idea, but running it regularly via cron is a better one. To run
chkrootkit automatically, log in as root, su to root, or use sudo to run crontab -e and add chkrootkit to
root's list of processes that are run automatically by cron. For example, the following entry would run
chkrootkit every night at 1 A.M. and would mail its output to :
03***(cd /path/to/chkrootkit; ./chkrootkit 2>&1 | mail -s "chkrootkit \
output" )
7.7.5. Summary
A basic problem in rootkit detection is that any system on which a rootkit has been installed can't be trusted to
detect rootkits. Even if you follow the instructions in this hack and run chkrootkit via cron, you only have a
small window of opportunity before the clever cracker checks root's crontab entry and either disables or hacks
chkrootkit itself. The combination of chkrootkit and software such as Tripwire or Afick can help make this
window as small as possible, but regular system security checks of externally facing machines from a
bootable CD that includes chkrootkit, such as Inside Security's Insert Security Rescue CD
( is your best solution for identifying rootkits so that you can restore
compromised systems.
7.7.6. See Also
•
"Tame Tripwire" [Hack #66]•
"Verify Fileystem Integrity with Afick" [Hack #67]•
Insert Security Rescue CD:
Rootkit Hunter: •
Windows users:
Windows users:
Chapter 8. Troubleshooting and Performance
Section 8.1. Hacks 6977: Introduction
287
287
Hack 69. Find Resource Hogs with Standard Commands
Hack 70. Reduce Restart Times with Journaling Filesystems
Hack 71. Grok and Optimize Your System with sysctl
Hack 72. Get the Big Picture with Multiple Displays
Hack 73. Maximize Resources with a Minimalist Window Manager
Hack 74. Profile Your Systems Using /proc
Hack 75. Kill Processes the Right Way
Hack 76. Use a Serial Console for Centralized Access to Your Systems
Hack 77. Clean Up NIS After Users Depart
8.1. Hacks 6977: Introduction
You'd be amazed at how often "optimizing performance" really translates into "troubleshooting." If something
is misconfigured or otherwise broken, it's likely that your first inkling that something is wrong is a result of
poor performance, either of the service in question or the host on which it's running.
Performance is a relative term. It's important to know what a system looks like when it's running under no
load in order to be able to measure the impact of adding incrementally more users and services.
In this chapter, we'll give you the tools and techniques to troubleshoot your way to better performance, to
optimize resources the system reserves for its slated tasks, and to deal with resource hogs on your systems and
networks.
Hack 69. Find Resource Hogs with Standard Commands
You don't need fancy, third-party software or log analyzers to find and deal with a crazed user on a resource binge.
There are times when users will consume more than their fair share of system resources, be it CPU, memory, disk space, file handles, or network
bandwidth. In environments where users are logging in on the console (or invoking the login utility by some other means), you can use pam_limits,or the
ulimit utility to keep them from going overboard.
In other environments, neither of these is particularly useful. On development servers, for example, you could be hosting 50 developers on a single machine
where they all test their code before moving it further along toward a production rollout. Machines of this nature are generally set up to allow for things like
cron jobs to run. While it's probably technically possible to limit the resources the cron utility can consume, that might be asking for trouble, especially
when you consider that there are many jobs that run out of cron on behalf of the system, such as makewhatis and LogWatch.
In general, the developers don't want to hog resources. Really, they don't. It makes their work take longer, and it causes their coworkers to unleash a ration
of grief on them. On top of that, it annoys the system administrators, who they know can make their lives, well, "challenging." That said, resource hogging
288
288
is generally not a daily or even weekly occurrence, and it hardly justifies the cost of third-party software, or jumping through hoops to configure for every
conceivable method of resource consumption.
Usually, you find out about resource contention either through a monitoring tool's alert email or from user email complaining about slow response times or
login shells hanging. The first thing you can do is log into the machine and run the top command, which will show you the number of tasks currently
running, the amount of memory in use, swap space consumption, and how busy the CPUs are. It also shows a list of the top resource consumers, and all of
this data updates itself every few seconds for your convenience. Here's some sample output from top:
top - 21:17:48 up 26 days, 6:37, 2 users, load average: 0.18, 0.09, 0.03
Tasks: 87 total, 2 running, 83 sleeping, 2 stopped, 0 zombie
Cpu(s): 14.6% us, 20.6% sy, 0.0% ni, 64.1% id, 0.0% wa, 0.3% hi, 0.3% si
Mem: 2075860k total, 1343220k used, 732640k free, 216800k buffers
Swap: 4785868k total, 0k used, 4785868k free, 781120k cached
PID USER PR NI VIRT RES SHR S %CPU %MEM TIME+ COMMAND
3098 jonesy 25 0 4004 1240 956 S 8.7 0.1 0:11.42 hog.sh
30033 jonesy 15 0 6400 2100 1656 S 0.7 0.1 0:02.57 sshd
8083 jonesy 16 0 2060 1064 848 R 0.3 0.1 0:00.06 top
1 root 16 0 1500 516 456 S 0.0 0.0 0:01.91 init
As you can see, the top resource consumer is my hog.sh script. It's been running for about 11 seconds (shown in the TIME+ column), has a process ID of
3098, and uses 1240K of physical memory. A key field here is the NI field. This is referred to as the nice value. Users can use the renice utility to give
their jobs lower priorities, to help ensure that they do not get in the way of other jobs scheduled to be run by the kernel scheduler. The kernel runs jobs
based on their priorities, which are indicated in the PR field. As an administrator in the position of trying to fix problems without stepping on the toes of
your usership, a first step in saving resources might be to renice the hog.sh script. You'll need to run top as root to renice a process you don't own. You
can do this by hitting R on your keyboard, at which point top will ask you which process to reprioritize:
top - 21:19:07 up 26 days, 6:38, 2 users, load average: 0.68, 0.26, 0.09
Tasks: 88 total, 4 running, 82 sleeping, 2 stopped, 0 zombie
Cpu(s): 19.6% us, 28.9% sy, 0.0% ni, 49.8% id, 0.0% wa, 1.0% hi, 0.7% si
Mem: 2075860k total, 1343156k used, 732704k free, 216800k buffers
Swap: 4785868k total, 0k used, 4785868k free, 781120k cached
PID to renice: 3098
PID USER PR NI VIRT RES SHR S %CPU %MEM TIME+ COMMAND
3098 jonesy 25 0 4004 1240 956 R 14.3 0.1 0:22.37 hog.sh
Typing in the process ID and pressing Enter will cause top to ask you what value you'd like to nice the process to. I typed in 15 here. On the next refresh,
notice the change in my script's statistics:
top - 21:20:22 up 26 days, 6:39, 2 users, load average: 1.03, 0.46, 0.18
Tasks: 87 total, 1 running, 84 sleeping, 2 stopped, 0 zombie
Cpu(s): 1.3% us, 22.3% sy, 13.6% ni, 61.5% id, 0.0% wa, 0.7% hi, 0.7% si
Mem: 2075860k total, 1343220k used, 732640k free, 216800k buffers
Swap: 4785868k total, 0k used, 4785868k free, 781120k cached
PID USER PR NI VIRT RES SHR S %CPU %MEM TIME+ COMMAND
3098 jonesy 39 15 4004 1240 956 S 12.0 0.1 0:31.34 hog.sh
Renicing a process is a safety precaution. Since you don't know what the code does, you don't know how much pain it will cause the user if you kill it
outright. Renicing will help make sure the process doesn't render the system unusable while you try to dig for more information.
The next thing to check out is the good old ps command. There are actually multiple ways to find out what else a given user is running. Try this one:
289
289
$ ps ef | grep jonesy
jonesy 28820 1 0 Jul31 ? 00:00:00 SCREEN
jonesy 28821 28820 0 Jul31 pts/3 00:00:00 /bin/bash
jonesy 30203 28821 0 Jul31 pts/3 00:00:00 vim XF86Config
jonesy 30803 1 0 Jul31 ? 00:00:00 SCREEN
jonesy 30804 30803 0 Jul31 pts/4 00:00:00 /bin/bash
jonesy 30818 1 0 Jul31 ? 00:00:00 SCREEN -l
jonesy 30819 30818 0 Jul31 pts/5 00:00:00 /bin/bash
This returns a full listing of all processes that contain the string jonesy. Note that I'm not selecting by user here, so if some other user is running a script
called "jonesy-is-a-horrible-admin," I'll know about it. Here I can see that the user jonesy is also running a bunch of other programs. The PID of each
process is listed in the second column, and the parent PID (PPID) of each process is listed in the third column. This is useful, because I can tell, for
example, that PID 28821 was actually started by PID 28820, so I can see here that I'm running an instance of the bash shell inside of a screen session.
To get an even better picture that shows more clearly the relationship between child and parent processes, try this command:
$ ps fHU jonesy
This will show the processes owned by user jonesy in hierarchical form, like this:
UID PID PPID C STIME TTY TIME CMD
jonesy 25760 25758 0 15:34 ? 00:00:00 sshd: jonesy@notty
jonesy 25446 25444 0 Jul29 ? 00:00:06 sshd: jonesy@notty
jonesy 20761 20758 0 16:28 ? 00:00:03 sshd: jonesy@pts/0
jonesy 20812 20761 0 16:28 pts/0 00:00:00 -tcsh
jonesy 12543 12533 0 12:11 ? 00:00:00 sshd: jonesy@notty
jonesy 12588 12543 0 12:11 ? 00:00:00 tcsh -c /usr/local/libexec/sft
jonesy 12612 12588 0 12:11 ? 00:00:00 /usr/local/libexec/sftp-serv
jonesy 12106 12104 0 10:49 ? 00:00:01 sshd: jonesy@pts/29
jonesy 12135 12106 0 10:49 pts/29 00:00:00 -tcsh
jonesy 12173 12135 0 10:49 pts/29 00:00:01 ssh livid
jonesy 10643 10641 0 Jul28 ? 00:00:07 sshd: jonesy@pts/41
jonesy 10674 10643 0 Jul28 pts/41 00:00:00 -tcsh
jonesy 845 10674 0 15:49 pts/41 00:00:06 ssh newhotness
jonesy 7011 6965 0 10:15 ? 00:01:39 sshd: jonesy@pts/21
jonesy 7033 7011 0 10:15 pts/21 00:00:00 -tcsh
jonesy 17276 7033 0 11:01 pts/21 00:00:00 -tcsh
jonesy 17279 17276 0 11:01 pts/21 00:00:00 make
jonesy 17280 17279 0 11:01 pts/21 00:00:00 /bin/sh -c bibtex paper;
jonesy 17282 17280 0 11:01 pts/21 00:00:00 latex paper
jonesy 17297 7033 0 11:01 pts/21 00:00:00 -tcsh
jonesy 17300 17297 0 11:01 pts/21 00:00:00 make
jonesy 17301 17300 0 11:01 pts/21 00:00:00 /bin/sh -c bibtex paper;
jonesy 17303 17301 0 11:01 pts/21 00:00:00 latex paper
jonesy 6820 6816 0 Jul28 ? 00:00:03 sshd: jonesy@notty
jonesy 6209 6203 0 22:15 ? 00:00:01 sshd: jonesy@pts/31
jonesy 6227 6209 0 22:15 pts/31 00:00:00 -tcsh
As you can see, I have a lot going on! These processes look fairly benign, but this may not always be the case. In the event that a user is really spawning
lots of resource-intensive processes, one thing you can do is renice every process owned by that user in one fell swoop. For example, to change the priority
of everything owned by user jonesy to run only when nothing else is running, I'd run the following command:
$ renice 20 -u jonesy
1001: old priority 0, new priority 19
290
290
Doing this to a user who has caused the system load to jump to 50 or so can usually get you back down to a level that makes the system usable again.
8.2.1. What About Disk Hogs?
The previous commands will not help you with users hogging disk space. If your user home directories are all on the same partition and you're not
enforcing quotas, anything from a runaway program to a penchant for music downloads can quickly fill up the entire partition. This will cause common
applications such as email to stop working altogether. If your mail server is set up to mount the user home directories and deliver mail to folders in the
home directories, it won't be amused!
When a user calls to say email is not working, the first command you'll want to run is this one:
$ df h
Filesystem Size Used Avail Use% Mounted on
fileserver:/export/homes
323G 323G 0G 100% /.autofs/u
Well, that's a full filesystem if I ever saw one! The df command shows disk usage/free disk statistics for all mounted filesystems by default, or for
whatever filesystems it receives as arguments. Now, to find out the identity of our disk hog, become root, and we'll turn to the du command:
# du s B 1024K /home/* | sort n
The du command above produces a summary (-s) for each directory under /home, presenting the disk usage of each directory in 1024K (1 MB) blocks.
We then pipe the output of the command to the sort command, which we've told to sort it numerically instead of alphabetically by feeding it the n flag.
With this output, you can see right away where the most disk space is being used, and you can then take action in some appropriate fashion (either by
contacting the owner of a huge file or directory, or by deleting or truncating an out-of-control log file [Hack #51].
8.2.2. Bandwidth Hogging
Users who are hogging network bandwidth are rarely difficult to spot using the tools we've already discussed. However, if the culprit isn't obvious for some
reason, you can lean on a core fundamental truth about Unix-like systems that goes back decades: everything is a file.
You can probe anything that can be represented as a file with the lsof command. To get a list of all network files (sockets, open connections, open ports),
sorted by username, try this command:
$ lsof i -P| sort k3
The i flag to lsof says to select only network-related files. The -P flag says to show the port numbers instead of trying to map them to service names.
We then pipe the output to our old friend sort, which we've told this time to sort based on the third field or "key," which is the username. Here's some
output
sshd 1859 root 3u IPv6 5428 TCP *:22 (LISTEN)
httpd 1914 root 3u IPv6 5597 TCP *:80 (LISTEN)
sendmail 16643 root 4u IPv4 404617 TCP localhost.localdomain:
25 (LISTEN)
httpd 1914 root 4u IPv6 5598 TCP *:443 (LISTEN)
dhcpd 5417 root 6u IPv4 97449 UDP *:67
291
291
sshd 24916 root 8u IPv4 4660907 TCP localhost.localdomain:
6010 (LISTEN)
nmbd 7812 root 9u IPv4 161622 UDP *:137
snmpd 25213 root 9u IPv4 4454614 TCP *:199 (LISTEN)
sshd 24916 root 9u IPv6 4660908 TCP localhost:6010 (LISTEN)
COMMAND PID USER FD TYPE DEVICE SIZE NODE NAME
These are all common services, of course, but in the event that you catch a port or service here that you don't recognize, you can move on to using tools
such as an MRTG graph [Hack #79], ngrep, tcpdump, or snmpget/snmpwalk [Hack #81] to try to figure out what the program is doing, where its traffic is
headed, how long it has been running, and so on. Also, since lsof shows you which processes are holding open which ports, problems that need
immediate attention can be dealt with using standard commands to renice or kill the offending process.
Hack 70. Reduce Restart Times with Journaling Filesystems
Large disks and filesystem problems can drag down the boot process unless you're using a journaling
filesystem. Linux gives you plenty to choose from.
Computer systems can only successfully mount and use filesystems if they can be sure that all of the data
structures in each filesystem are consistent. In Linux and Unix terms, consistency means that all of the disk
blocks that are actually used in some file or directory are marked as being in use, all deleted blocks aren't
linked to anything other than the list of free blocks, all directories in the filesystem actually have parent
directories, and so on. This check is done by filesystem consistency check applications, the best known of
which is the standard Linux/Unix fsck application. Each filesystem has its own version of fsck (with names
like fsck.ext3, fsck.jfs, fsck.reiserfs, and so on) that understands and "does the right thing" for that particular
filesystem.
When filesystems are mounted as part of the boot process, they are marked as being in use ("dirty"). When a
system is shut down normally, all its on-disk filesystems are marked as being consistent ("clean") when they
are unmounted. When the system reboots, filesystems that are marked as being clean do not have to be
checked before they are mounted, which saves lots of time in the boot process. However, if they are not
marked as clean, the laborious filesystem consistency check process begins. Because today's filesystems are
often quite large and therefore contain huge chains of files, directories, and subdirectories, each using blocks
in the filesystem, verifying the consistency of each filesystem before mounting it is usually the slowest part of
a computer's boot process. Avoiding filesystem consistency checks is therefore the dream of every sysadmin
and a goal of every system or filesystem designer. This hack explores the basic concepts of how a special type
of filesystem, known as a journaling filesystem, expedites system restart times by largely eliminating the need
to check filesystem consistency when a system reboots.
8.3.1. Journaling Filesystems 101
Some of the more inspired among us may keep a journal to record what's happening in our lives. These come
in handy if we want to look back and see what was happening to us at a specific point in time. Journaling
filesystems operate in a similar manner, writing planned changes to a filesystem in a special part of the disk,
called a journal or log, before actually applying them to the filesystem. (This is hard to do in a personal
journal unless you're psychic.) There are multiple reasons journaling filesystems record changes in a log
before applying them, but the primary reason for this is to guarantee filesystem consistency.
292
292
Using a log enforces consistency, because sets of planned changes are grouped together in the log and are
replayed transactionally against the filesystem. When they are successfully applied to the filesystem, the
filesystem is consistent, and all of the changes in the set are removed from the log. If the system crashes while
transactionally applying a set of changes to the filesystem, the entries remain present in the log and are
applied to the filesystem as part of mounting that filesystem when the system comes back up. Therefore, the
filesystem is always in a consistent state or can almost always quickly be made consistent by replaying any
pending transactions.
I say "almost always" because a journaling filesystem can't protect you from
bad blocks appearing on your disks or from general hardware failures, which
can cause filesystem corruption or loss. See "Recover Lost Partitions" [Hack
#93], "Recover Data from Crashed Disks" [Hack #94], and "Repair and
Recover ReiserFS Filesystems" [Hack #95] for some suggestions if fsck
doesn't work for you.
8.3.2. Journaling Filesystems Under Linux
Linux offers a variety of journaling filesystems, preintegrated into the primary kernel code. Depending on the
Linux distribution that you are using, these may or may not be compiled into your kernel or available as
loadable kernel modules. Filesystems are activated in the Linux kernel on the File Systems pane of your
favorite kernel configuration mechanism, accessed via make xconfig or (for luddites) make
menuconfig. The options for the XFS journaling filesystem are grouped together on a separate pane, XFS
Support.
The journaling filesystems that are integrated into the Linux kernel at the time this book was written are the
following:
ext3
ext3 adds high-performance journaling capabilities to the standard Linux ext2 filesystem on which it's
based. Existing ext2 filesystems can easily be converted to ext3, as explained later in this hack.
JFS
The Journaled File System (JFS) was originally developed by International Business Machines (IBM)
for use on their OS/2 and AIX systems. JFS is a high-performance journaling filesystem that allocates
disk space as needed from pools of available storage in the filesystem (known as allocation groups)
and therefore creates inodes as needed, rather than preallocating everything as traditional Unix/Linux
filesystems do. This provides fast storage allocation and also removes most limitations on the number
of inodes (and therefore files and directories) that can be created in a JFS filesystem.
ReiserFS
Written by Hans Reiser and others with the financial support of companies such as SUSE, Linspire,
mp3.com, and many others, ReiserFS is a high-performance, space-efficient journaling filesystem that
is especially well suited to filesystems that contain large numbers of files. ReiserFS was the first
journaling filesystem to be integrated into the Linux kernel code and has therefore been popular and
stable for quite a while. It is the default filesystem type on Linux distributions such as SUSE Linux.
293
293
Reiser4
Written by Hans Reiser and others with the financial support of the Defense Advanced Research
Projects Agency (DARPA), Reiser4 is the newest of the journaling filesystems discussed in this hack.
Reiser4 is a very high-performance, transactional filesystem that further increases the extremely
efficient space allocation provided by ReiserFS. It is also designed to be extended through plug-ins
that can add new features without changing the core code.
XFS
Contributed to Linux by Silicon Graphics, Inc. (SGI), XFS (which doesn't really stand for anything) is
a very high-performance journaling filesystem that dynamically allocates space and creates inodes as
needed (like JFS), and supports a special (optional) real-time section for files that require
high-performance, real-time I/O. The combination of these features provides a fast filesystem without
significant limitations on the number of inodes (and therefore files and directories) that can be created
in an XFS filesystem.
Each of these filesystem has its own consistency checker, filesystem creation tool, and related administrative
tools. Even if your kernel supports the new type of filesystem that you've selected, make sure that your
filesystems also include its administrative utilities, installed separately through your distribution's package
manager, or you're in for a bad time the next time you reboot and a filesystem check is required.
The purpose of this hack is to explain why journaling filesystems are a good idea for most of the local storage
that is attached to the systems you're responsible for, and to provide some tips about integrating journaling
filesystems into existing systems. I can't really say more about these here without turning this hack into a tome
on Linux filesystemswhich I already wrote a few years ago (Linux Filesystems, SAMS Publishing), though
it's now somewhat dated. All of these journaling filesystems are well established and have been used on Linux
systems for a few years. Reiser4 is the newest of these and is therefore the least time-tested, but Hans assures
us all that no one does software engineering like the Namesys team.
8.3.3. Converting Existing Filesystems to Journaling Filesystems
Traditional Linux systems use the ext2 filesystem for local filesystems. Because the journaling filesystems
available for Linux all use their own allocation and inode/storage management mechanisms, the only
journaling Linux filesystem that you can begin using with little effort is the ext3 filesystem, which was
designed to be compatible with ext2.
To convert an existing ext2 filesystem to an ext3 filesystem, all you have to do is add a journal and tell your
system that it is now an ext3 filesystem so that it will start using the journal. The command to create a journal
on an existing ext2 filesystem (you must be root or use sudo) is the following:
# tune2fs -j /dev/ filesystem
If you create a journal on a mounted ext2 filesystem, it will initially be created
as the file .journal in the root of the filesystem and will automatically be
hidden when you reboot or remount the filesystem as an ext3 filesystem.
You will need to update /etc/fstab to tell the mount command to mount your converted filesystem as an ext3
filesystem and reboot to verify that all is well.
294
294
In general, if you want to begin using any of the non-ext3 journaling filesystems discussed in this chapter with
any existing system, you'll need to do the following:
Build support for that journaling filesystem into your Linux kernel, make it available as a loadable
kernel module, or verify that it's already supported in your existing kernel.
•
Make sure you update the contents of any initial RAM disk you used during the boot process to
include any loadable kernel modules for the new filesystem(s) that you are using.
•
Install the administrative tools associated with the new filesystem type, if they aren't already available
on your system. These include a minimum of new mkfs.filesystem-type and
fsck.filesystem-type utilities, and may also include new administrative and filesystem repair
utilities.
•
Manually convert your existing filesystems to the new journaling filesystem format by creating new
partitions or logical volumes that are at least as large as your existing filesystems, formatting them
using the new filesystem format, and recursively copying the contents of your existing filesystems
into the new ones.
•
Go to single-user mode, unmount your existing filesystems, and update the entries in /etc/fstab to
reflect the new filesystem types (and the new disks/volumes where they are located unless you're
simply replacing an existing disk with one or more new ones).
•
When migrating the contents of existing partitions and volumes to new partitions and volumes in different
filesystem formats, always back up everything first and test each of the new partitions before wiping out its
predecessor. Forgetting any of the steps in the previous list can turn your well-intentioned system
improvement experience into a restart nightmare if your system won't boot correctly using its sexy new
filesystems.
8.3.4. Summary
Journaling filesystems can significantly improve system restart times, provide more efficient use of the disk
space available on your partitions or volumes, and often even increase general system performance. I
personally tend to use ext3 for system filesystems such as / and /boot, since this enables me to use all of the
standard ext2 filesystem repair utilities if these filesystems become corrupted. For local storage on SUSE
systems, I generally use ReiserFS, because that's the default there and it's great for system partitions (such as
your mail and print queues) because of its super-efficient allocation.
I tend to use XFS for physical partitions on Linux distributions other than SUSE Linux, because I've used it
for years on Linux and SGI boxes, it has always been stable in my experience, and the real-time section of
XFS filesystems is way cool. I generally use ext3 on logical volumes because the dynamic allocation
mechanisms used by JFS and XFS and ReiserFS's tree-balancing algorithms place extra overhead on the
logical volume subsystem. They all still work fine on logical volumes, of course.
8.3.5. See Also
"Recover Lost Partitions" [Hack #93]•
"Recover Data from Crashed Disks" [Hack #94]•
"Repair and Recover ReiserFS Filesystems" [Hack #95]•
man tune2fs•
ext3 home page:
JFS home page: •
ReiserFS/Reiser4 home page: •
XFS home page:
295
295
Hack 71. Grok and Optimize Your System with sysctl
Instead of interacting directly with /proc files, you can get and set kernel options in a flash with the sysctl
command.
In days of old, sysctl referred to a header file or system call that C programmers could use to change kernel
settings from a program. The files under /proc/sys/ are often collectively referred to as the sysctl interface,
because they can be written to, and changes made to the files will be picked up by the running kernel without
rebooting. This feature was implemented in the kernel as early as Version 2.0 (but don't quote me).
These days, sysctl is a kernel call, an interface, and a command that allows administrators to easily interact
with the kernel. It also allows for a proper startup configuration file, so you don't have to rebuild kernels
everywhere to disable IP forwarding, for example. Enabling and disabling IP forwarding was one of the first
things I ever used the sysctl interface for. Enabling IP forwarding for your Linux router used to be done with a
command like this:
# echo 1 > /proc/sys/net/ipv4/ip_forward
The content of the file was "0" by default, indicating that forwarding was not turned on. Echoing a "1" into the
file turned it on.
Enter the sysctl command. Now we can all easily see every single setting available to us through the
interface with a simple command:
# sysctl -a
net.ipv4.tcp_keepalive_time = 7200
net.ipv4.ipfrag_time = 30
net.ipv4.ip_dynaddr = 1
net.ipv4.ipfrag_low_thresh = 196608
net.ipv4.ipfrag_high_thresh = 262144
net.ipv4.tcp_max_tw_buckets = 180000
net.ipv4.tcp_max_orphans = 16384
net.ipv4.tcp_synack_retries = 5
net.ipv4.tcp_syn_retries = 5
net.ipv4.ip_nonlocal_bind = 0
net.ipv4.ip_no_pmtu_disc = 0
net.ipv4.ip_autoconfig = 0
net.ipv4.ip_default_ttl = 64
net.ipv4.ip_forward = 0
…
On my desktop Debian system, this returned over 400 "key=value" -formatted records. The keys on the left
are dotted representations of file paths under /proc/sys. For example, the setting for net.ipv4.ip_forward can
be found in /proc/sys/net/ipv4/ip_forward. If you know what you're looking for, though, you can specify what
you want as an argument to sysctl:
# /sbin/sysctl net.ipv4.ip_forward
net.ipv4.ip_forward = 0
296
296
So if you always wanted to know more about your kernel, consider it done. How about customizing the kernel
settings? You have choices. You can make temporary changes to the kernel using the -w flag to "write" a new
setting:
# sysctl -w net.ipv4.ip_forward=1
On the other hand, if you want to make a more permanent change, you can put your custom settings into the
/etc/sysctl.conf file, which will ensure that your settings are applied automatically when the kernel boots.
(Actually, it's not read right when the kernel is launched, per se, but at some point before a login prompt is
displayed to the console. Exactly when the variables are set varies from distribution to distribution, but if you
grep for sysctl under /etc/init.d, you're sure to find it in a hurry!)
The configuration file consists of records that look identical to the output of sysctl -a. Here's an example
configuration file:
# Controls IP packet forwarding
net.ipv4.ip_forward = 0
# Controls source route verification
net.ipv4.conf.default.rp_filter = 1
# Controls the System Request debugging functionality of the kernel
kernel.sysrq = 0
# Controls whether core dumps will append the PID to the core filename.
# Useful for debugging multi-threaded applications.
kernel.core_uses_pid = 1
# Decrease the time default value for tcp_fin_timeout connection.
net.ipv4.tcp_fin_timeout = 30
# Decrease the time default value for tcp_keepalive_time connection
net.ipv4.tcp_keepalive_time = 1800
# Turn off tcp_window_scaling
net.ipv4.tcp_window_scaling = 0
# Turn off the tcp_sack
net.ipv4.tcp_sack = 0
# Turn off tcp_timestamps
net.ipv4.tcp_timestamps = 0
# Increase transport socket buffers to improve performance of nfs (and
networking
# in general)
# 'rmem' is 'read memory', 'wmem' is 'write memory'.
net.core.rmem_max = 262143
net.core.rmem_default = 262143
net.core.wmem_max = 262143
net.core.wmem_default = 262143
net.ipv4.tcp_rmem = 4096 87380 8388608
net.ipv4.tcp_wmem = 4096 87380 8388608
# These are for both security and performance
net.ipv4.icmp_echo_ignore_broadcasts = 1
net.ipv4.icmp_ignore_bogus_error_responses = 1
297
297
When all is said and done, the hardest part of using the sysctl interface is learning what all the variables
actually mean and how they apply to your particular situation. I hope the comments in my sample file can help
out a bit. Also check out the documentation of the /proc files that comes with the kernel source distribution to
get started.
Hack 72. Get the Big Picture with Multiple Displays
Using two monitors with a single system gives you more room to work. The latest versions of the X Window
System make this easier than ever before.
Many of the hacks in this book discuss how to better monitor system and process status, how to use the Web
for basic computing infrastructure functions, and so on. This hack explains how to get enough display space
so that you can actually see all of that information by attaching two video cards and two monitors to any
Linux system and configuring the XFree86 or X.org X Window System for what is known as multi-head
display.
Whenever possible, add a second graphics card of the same type as the one that is
already in your system, or replace your existing graphics card with one that supports
two monitors. This will enable you to use the same X server to control both graphics
cards and their associated displays. Similarly, it's a good idea to add a second monitor
of exactly the same size and with exactly the same maximum display resolution as
your existing monitor. This will simplify synchronizing graphics modes across the
two monitors (and in the X Window System configuration sections for each display).
This hack creates two separate displays, one on each of your monitors. An alternate approach would be to use
the X Window System's Xinerama extension to create one single display that spans two monitors. (See
for more information about Xinerama.) With two separate
displays you cannot move windows from one to the other, though you can create windows on a specific
display by specifying the display that you want to use on an X application's command line. I find Xinerama
disconcerting because windows can be split across the two displays, which makes them a tad hard to read
because of the casing on my monitors. I find separate displays easier to use and cleaner looking. Your mileage
may vary.
X Window System configuration information is stored in the file /etc/X11/xorg.conf if you are using the X11
server from X.org, or in /etc/X11/XF86Config if you are using an XFree86-based X11 server. After adding
the hardware to your system and booting in a nongraphical, multi-user mode such as runlevel 3, the procedure
for modifying this file to use a multi-head display is as simple as the following few steps.
First, you need to create two Monitor sections in your X server's configuration file. Make sure you use a
unique Identifier name for each monitor:
Section "Monitor"
Identifier "Monitor 0"
VendorName "Monitor Vendor"
ModelName "Model X"
HorizSync 30.0 - 50.0
VertRefresh 60.0 - 60.0
EndSection
298
298
Section "Monitor"
Identifier "Monitor 1"
VendorName "Monitor Vendor"
ModelName "Model Y"
HorizSync 30.0 - 50.0
VertRefresh 60.0 - 60.0
EndSection
Next, create a Device section for each graphics card in your system. As with the monitors, be sure to use a
unique Identifier for each graphics card:
Section "Device"
Identifier "VideoCard 0"
Driver "drivername"
VendorName "Vendor"
BusID "PCI:00:15:0"
EndSection
Section "Device"
Identifier "VideoCard 1"
Driver "drivername"
VendorName "Vendor"
BusID "PCI:1:0:0"
EndSection
The BusID enables the X server to correctly and uniquely define each display in your configuration file, and
its value can be found from the output of the lspci command. The BusID can be found at the beginning of the
first line of lspci output that identifies the graphics card. The format is slightly different than what you will
need to put in your configuration file: lspci reports in hexadecimal, while you must use decimal notation in
your configuration file. The output of the lspci command is also xx:yy.z, which you must express as
xx:yy:z in your configuration filenote that the period in the lspci output must be replaced with a colon in
your configuration file.
# lspci | grep VGA
00:0f.0 VGA compatible controller: nVidia Corporation NV11 [GeForce2 MX/MX
400] (rev b2)
01:00.0 VGA compatible controller: nVidia Corporation NV15 [GeForce2 GTS/
Pro] (rev a4)
My favorite tool for converting hex to decimal is the standard Linux bc utility.
You can specify bc's input base using the ibase =base command and leave
its output set to decimal (the default). For example, the following shows how to
convert 10 hex to decimal (OK, that's not very hard, but this is an example, and
a simple example does make things clear):
$ bc q
ibase=16
10
16
299
299
After specifying the input base, you simply enter a hex value and press Return,
and bc displays the decimal equivalent. Type Ctrl-D to exit bc.
The next thing to add to your X server's configuration file is two Screen sections. Each section will use one
of the Monitor and Device stanzas that you defined previously. The resolution and color depth of the two
can be different if you so desire but are usually the same:
Section "Screen"
Identifier "Screen 0"
Device "VideoCard 0"
Monitor "Monitor 0"
DefaultDepth 24
SubSection "Display"
Depth 24
Modes "800x600" "640x480"
EndSubSection
EndSection
Section "Screen"
Identifier "Screen 1"
Device "VideoCard 1"
Monitor "Monitor 1"
DefaultDepth 24
SubSection "Display"
Depth 24
Modes "1024x768" "800x600" "640x480"
EndSubSection
EndSection
Now, you must tie all of these pieces together in the ServerLayout section (normally at the top of your
configuration file:
Section "ServerLayout"
Identifier "Multihead layout"
Screen 0 "Screen 0" 0 0
Screen 1 "Screen 1" RightOf "screen 0"
InputDevice "Mouse0" "CorePointer"
InputDevice "Keyboard0" "CoreKeyboard"
InputDevice "DevInputMice" "AlwaysCore"
EndSection
The 0 0 next to Screen 0 means that this screen will start at position 0,0. Screen 1 will be located to the right
of Screen 0.
Now that that's done, start the X Window System using your favorite startx or xinit command. If X does
not start correctly, double-check the entries that you added to your configuration file for syntax errors, paying
particular attention to the BusID values in the Device stanzas.
Redirecting the output of the startx or xinit command to a file can
help capture error messages that you can use to debug your configuration
files. Executing xinit> & x_startup.txt can be extremely useful,
unless you can read much faster than I can.
300
300
Once X is working correctly, you can start a graphical application so that it starts on the screen of your choice
by using the display option that is accepted by almost every X Window System command. For example, to
start an xterm on Screen 1, you would execute the command xterm display :0.1. This display value
specifies that the application use Screen 1 of the current display (display 0) on the current host. The general
form of a display value is the following:
hostname:displaynumber.screennumber
Using a multi-head display may be a bit disconcerting at first, especially when your mouse pointer crosses
from one monitor to the other, but you'll quickly find that the additional display real estate is well worth any
amount of acclimation.
8.5.1. See Also
"Monitor Network Traffic with MRTG" [Hack #79]•
Lance Tost
Hack 73. Maximize Resources with a Minimalist Window Manager
Using window managers rather than desktop environments can improve the performance of slower systems or
simply leave more system resources available for actual computing.
Graphical user interfaces such as KDE and GNOME are slick and easy to use, but all that eye candy has a
priceexecuting and managing all of those graphical bells and whistles requires a certain percentage of system
resources. A typical idle KDE desktop on SUSE 9 Enterprise occupies around 370 MB of RAM. For today's
servers with multiple gigabytes of RAM, this may not be an issue. However, if you're running a legacy server
that contains less than a gig of RAM, you could certainly benefit from the use of a more modest graphics
system, known as a window manager. Window managers focus on displaying and managing windows, not
drag and drop and other luxuries. One of the best lightweight window managers is Fluxbox, an open source
software package available online and derived from the Blackbox window manager, which is itself an open
source clone of the window manager used on old workstations from NeXT. Using Fluxbox can decrease the
amount of RAM required by your GUI by over 100 MB, and also eliminates the ten zillion background
processes that desktop environments such as KDE start to support things like drag and drop, automatic file
associations, and so on. This hack explains how to build and install Fluxbox so that you can devote more of
your system's memory to the applications that you actually want to run.
8.6.1. Getting and Installing Fluxbox
As usual, the easiest method of installing Fluxbox is via an RPM packaged for your distribution. These can be
found on the Fluxbox home page, . In this example, we'll compile from source
so that we can pass a few options to make Fluxbox a little more familiar. Grab the tarball from the home page,
and extract it to a working directory. Navigate into the newly created directory, and run configure as follows:
$ ./configure with kde with-gnome
301
301
This will allow Fluxbox to use the KDE and GNOME panel icons. Once the configure script has finished, run
the following command as root to build Fluxbox:
# make && make install
This will compile Fluxbox (which doesn't require root privileges) and install it for you (which requires root
privileges, since you have to be able to write to subdirectories of /usr/local). The name of the actual
executable for Fluxbox is fluxbox (no initial cap). Now we just need to configure X to start Fluxbox as your
window manager.
8.6.2. Start Me Up, Scotty!
If you installed on a SUSE or Red Hat system using an RPM, you can simply select Fluxbox as your session
type from the login screen. Otherwise, navigate to your home directory and find a file called either .xsession
or .xinitrc. If a file matching one of those names doesn't exist, you'll need to create one. Which one you create
depends largely on how your system starts Xsee the Fluxbox documentation for more information.
In this case, we'll edit .xinitrc. Open it with your favorite text editor and enter the following line:
exec /usr/local/bin/fluxbox
where /usr/local/bin is the directory in which you installed your fluxbox executable (/usr/local/bin is usually
the default installation location). You'll then need to change the file ownership properties via chmod:
$ chmod 700 .xinitrc
You can now log out and right back in. Depending on your distribution, either fluxbox will start
automatically, or you'll be able to select it as your session type from the login manager. Either way, upon
logging in you'll be greeted (very quickly!) by a plain-looking screen. Right-clicking on the desktop brings up
a menu with various options on it. If you configured it with the KDE and GNOME options as I suggested,
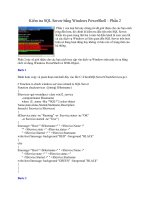
some of the tools from those environments might be available to you right away. Figure 8-1 shows a sample
Fluxbox screen running a single xterm with the Firefox web browser open, and displaying my default Fluxbox
menu as the result of a right-click on the background.
Figure 8-1. Fluxbox in all its minimal glory
302
302
8.6.3. Configure Fluxbox
The next step is to begin customizing Fluxbox to your liking. As you can see from Figure 8-1, Fluxbox is
highly configurable. The biggest piece of Fluxbox configuration is customizing its main menu. This is the
menu that is displayed whenever you click on the desktop, and it is completely configurable. The menu is
controlled via a text file called menu. This file is located in your .fluxbox directory, which is automatically
created in your home directory the first time you run Fluxbox. The layout of the file is very simple:
[begin] (Fluxbox)
[exec] (xterm) {xterm}
[exec] (mozilla) {mozilla}
[exec] (Run) {fbrun}
[submenu] (Terminals)
[exec] (xterm) {xterm}
[exec] (gnome-terminal) {gnome-terminal}
[exec] (console) {console}
[end]
[submenu] (Net)
[submenu] (Utilities)
[exec] (Ethereal) {ethereal}
[submenu] (Browsers)
[exec] (mozilla) {mozilla}
[exec] (conqueror) {kfmclient openProfile webbrowsing}
[end]
303
303
[end]
This example is a sample section from my Fluxbox menu file. As you can see, this is a fairly simple
configuration file. The top line is the title of my menu. In this example, each menu item is preceded by the
[exec] command, which tells Fluxbox that this is a system command that it should actually execute. The
first argument in the regular parentheses is the name you want displayed for the application, while the text
within the curly braces specifies the command you would run from the command line to execute the program.
Note that if the application you're trying to add to your menu isn't located within your default path, you'll need
to specify the full path to the executable. Each sequentially lower portion of your menu is marked by the
[submenu] command. Specify the end of a menu with the [end] command. Items that you want directly
available can be placed at the top, under the title.
Fluxbox startup files can also invoke internal Fluxbox commands, which are identified within square brackets
just like the [exec] instruction, as in the following example:
[exit] (Exit)
This creates an Exit menu item that executes the internal Fluxbox exit command. When deploying systems
that run Fluxbox for users and start in graphical runlevels, you may find Fluxbox menu commands like the
following to be quite handy:
[exec] (Shut Down System) {sudo shutdown h now}
[exec] (Reboot System) {sudo shutdown r now}
[exit] (Log Out)
These assume that the user has been granted certain privileges in the sudo application, and create the standard
sorts of menu items that users who may be unfamiliar with Linux typically expect to see in their graphical
user interface.
The options discussed in this section are only the tip of the Fluxbox configuration
iceberg. See the Fluxbox man page for a complete list of available Fluxbox
configuration commands and options.
8.6.4. The Slit
The Slit is one of the coolest features of Fluxbox. You can think of the Slit as a version of the OS X
Dashboard that's always available. It contains small dockable applications (commonly known as dock apps)
that are able to run in withdrawn mode, which simply means that they run independently in the background.
This is typically designated by a -w flag when running the application from the command line. Note that not
all applications can run in this manner, but many are specifically designed to run this way. I typically start any
dock apps that I want to run by putting them in my .xinitrc file, starting them in the background before
actually starting the Fluxbox window manager. The order in which applications appear in the Slit is defined
by putting their names in the desired order in the slitlist file in your .fluxbox directory.
The Slit is an exceptional way to display statistics such as memory and processor utilization using the proper
304
304
dock apps. You can find dock apps at and .
8.6.5. Make It Pretty!
There is a large community of people on the Internet who devote a lot of time to creating custom Fluxbox
themes. These themes can be found at the Fluxbox home page, as well as around the Net. Installing a theme is
as simple as downloading it and adding it to the ~/.fluxbox/styles directory. These styles will then be
selectable from the Fluxbox Menu submenu. If such a directory doesn't exist, search for your global
Fluxbox share directory (usually /usr/local/share/ Fluxbox). The location of this directory will vary depending
on your method of installation.
8.6.6. Minimal Hassle
After a little bit of configuration, you might find that you prefer the simple layout of Fluxbox to heavier
window managers such as GNOME and KDE. In addition to preserving server resources, Fluxbox is a great
application to use to extend the life of an old laptop or desktop that just can't hack the high demands of a
heavier desktop solution.
Another memory-saving tip related to GUIs is to start your system in a
nongraphical runlevel (typically, runlevel 3) and then manually start your
window manager by using the xinit or startx commands after you've
logged in. This eliminates the memory overhead of the xwm, kdm, or gdm
display managers, which are the processes that provide support for graphical
logins, and can save you another 80 MB or so of memory. See the man page
for xinit for more information.
8.6.7. See Also
•
•
man fluxbox•
man xinit•
man sudo•
Brian Warshawsky
Hack 74. Profile Your Systems Using /proc
The /proc filesystem holds a wealth of informationand with a little bit of scripting you can use it to create profiles of
your servers.
The key to recognizing anomalies on your server is to have a good understanding and knowledge of what things look
like when it's healthy. A great place to start hunting for information is the /proc filesystem. This filesystem is a portal
305
305
into the depths of what the running kernel and the system load look like, and it provides a full profile of the hardware in
use on the local system.
When I install a new server, one of the first things I do is take a sort of profile "snapshot," so that I can get a good
picture of what the system resources look like on an idle system. I also do this just before and after I install or fire up
new software or system services, so I can get a measure of an application's impact on the availability of system
resources and so that I have a "cheat sheet" for looking up the system's installed hardware.
The script I use is very rough around the edges and wasn't written for the purpose of working on any machine you might
ever run across, but it does work on a good number of Linux servers I've encountered. Let's have a look at each part of
the script, along with the output it produces.
The first thing the script does is record the hostname and kernel version information, along with the first several lines of
output from the top command, so I can see the load, number of users/processes, and so on:
#!/bin/bash
echo ""
echo "#########BASIC SYSTEM INFORMATION########"
echo HOSTNAME: `cat /proc/sys/kernel/hostname`
echo DOMAIN: `cat /proc/sys/kernel/domainname`
echo KERNEL: `uname -r`
top -b | head -8
Here's the output for this part of the script:
#########BASIC SYSTEM INFORMATION########
HOSTNAME: willy
DOMAIN: pvt
KERNEL: 2.4.21-32.0.1.ELsmp
22:53:14 up 7 days, 15:36, 12 users, load average: 0.00, 0.02, 0.00
114 processes: 113 sleeping, 1 running, 0 zombie, 0 stopped
CPU states: cpu user nice system irq softirq iowait idle
total 0.0% 0.0% 0.4% 0.0% 0.0% 6.8% 92.6%
cpu00 0.0% 0.0% 0.9% 0.0% 0.0% 7.8% 91.1%
cpu01 0.0% 0.0% 0.0% 0.0% 0.0% 7.8% 92.1%
The hostname information is there so I'll know what I'm looking at when I refer back to the output again in the future.
The domain listed here is actually the NIS domain to which the box is bound. Depending on the environment, this can
be an important bit of troubleshooting informationbut if you're in an NIS environment, you already knew that. What
you're probably wondering is why I bothered to use /proc for this instead of system commands to get the hostname and
domain name information. The answer is because I've found that using files under /proc is more reliable than assuming
that system commands are in your default path. For things like hostname, chances are it's there, but three different
tools can be installed for domain name information. A typical Red Hat host has domainname, ypdomainname, and
dnsdomainname. On Red Hat systems, these are all symlinks to the hostname command. On my Debian stable box,
there is no domainname command at all. However, the /proc/sys/kernel/domainname file is on most machines I come
across, so using it makes the script more flexible.
Next up, let's have a look at the part of the script that gathers filesystem information:
echo "######## FILESYSTEM INFORMATION #########"
echo ""
echo "SUPPORTED FILESYSTEM TYPES:"
echo
echo `cat /proc/filesystems | awk -F'\t' '{print $2}'`
306
306
echo ""
echo "MOUNTED FILESYSTEMS:"
echo
cat /proc/mounts
Again, here's the output:
SUPPORTED FILESYSTEM TYPES:
sysfs rootfs bdev proc sockfs pipefs futexfs tmpfs eventpollfs devpts ext2
ramfs iso9660 devfs mqueue usbfs ext3 reiserfs supermount vfat
MOUNTED FILESYSTEMS:
/dev/root / reiserfs rw 0 0
none /dev devfs rw 0 0
none /proc proc rw,nodiratime 0 0
sysfs /sys sysfs rw 0 0
devpts /dev/pts devpts rw 0 0
tmpfs /dev/shm tmpfs rw 0 0
usbfs /proc/bus/usb usbfs rw 0 0
none /dev/shm tmpfs rw 0 0
/dev/hdb1 /mnt/hdb1 ext3 rw,noatime 0 0
/dev/hdb2 /mnt/hdb2 reiserfs rw,noatime 0 0
This is not information that's likely to change on a standalone server, but in a large environment with many NFS mounts
and running automounters, it can be useful information to have. The supported filesystem information is also handy if
you're in a shop that builds its own kernels, because it'll let you know if your new junior admin made the novice mistake
of forgetting to add ext3 or vfat support to the kernel.
This next bit is only slightly more complex. It summarizes information about IDE devices, their model numbers, the
devices they're assigned to on the system (hda, hdb, etc.), and, in case you don't recognize the models, exactly what
kinds of devices they are. Here's the IDE device portion of the script:
echo "IDE DEVICES BY CONTROLLER"
echo
for i in `ls /proc/ide | grep ide`
do
echo $i:
for j in `ls /proc/ide/$i | grep hd`
do
echo ""
echo " $j"
echo " "
echo " model: `cat /proc/ide/$i/$j/model`"
echo " driver: `cat /proc/ide/$i/$j/driver`"
echo " device type: `cat /proc/ide/$i/$j/media`"
if [ -e /proc/ide/$i/$j/geometry ]; then
echo " geometry:" `cat /proc/ide/$i/$j/geometry`
fi
echo ""
done
done
And here's the output:
307
307
###### IDE SUBSYSTEM INFORMATION ########
IDE DEVICES BY CONTROLLER
ide0:
hdb
model: ST3200822A
driver: ide-disk version 1.18
device type: disk
ide1:
hdd
model: FX4830T
driver: ide-cdrom version 4.61
device type: cdrom
This tells me that there are two IDE controllers, a CD-ROM drive, and one IDE hard drive on the machine. I also know
that the CD drive is going to be mountable as /dev/hdd (something that might be less obvious on a machine with lots of
IDE devices). Keep in mind that I could've gotten even more information if I wanted to require root privileges to run this
script! For example, to see the settings for /dev/hdb, I need to be root. I can then run this command:
# cat /proc/ide/hdb/settings
This will give me more information than I could ever want to know about my hard drive. Here's a sampling:
name value min max mode
acoustic 0 0 254 rw
address 1 0 2 rw
bios_cyl 24321 0 65535 rw
bios_head 255 0 255 rw
bios_sect 63 0 63 rw
bswap 0 0 1 r
current_speed 66 0 70 rw
failures 0 0 65535 rw
init_speed 66 0 70 rw
io_32bit 1 0 3 rw
keepsettings 0 0 1 rw
lun 0 0 7 rw
max_failures 1 0 65535 rw
multcount 16 0 16 rw
nice1 1 0 1 rw
nowerr 0 0 1 rw
number 1 0 3 rw
pio_mode write-only 0 255 w
unmaskirq 1 0 1 rw
using_dma 1 0 1 rw
wcache 1 0 1 rw
There's a ton of information in the files under /proc. Scripts like this one can be greatly expanded upon and make a
wonderful tool for consulting administrators. Send it to a client and have him send you the output via email, or use it to
take a snapshot of a machine when you set it up so that when a client calls up you're ready with the information about
the host in question.
308
308
8.7.1. The Code
Here's a copy of the entire script in one place, for easy review:
#!/bin/bash
echo ""
echo "#########BASIC SYSTEM INFORMATION########"
echo HOSTNAME: `cat /proc/sys/kernel/hostname`
echo DOMAIN: `cat /proc/sys/kernel/domainname`
echo KERNEL: `uname -r`
top -b | head -8
echo "######## FILESYSTEM INFORMATION #########"
echo ""
echo "SUPPORTED FILESYSTEM TYPES:"
cho
echo `cat /proc/filesystems | awk -F'\t' '{print $2}'`
echo ""
echo "MOUNTED FILESYSTEMS:"
echo
cat /proc/mounts
echo "IDE DEVICES BY CONTROLLER"
echo
for i in `ls /proc/ide | grep ide`
do
echo $i:
for j in `ls /proc/ide/$i | grep hd`
do
echo ""
echo " $j"
echo " "
echo " model: `cat /proc/ide/$i/$j/model`"
echo " driver: `cat /proc/ide/$i/$j/driver`"
echo " device type: `cat /proc/ide/$i/$j/media`"
if [ -e /proc/ide/$i/$j/geometry ]; then
echo " geometry:" `cat /proc/ide/$i/$j/geometry`
fi
echo ""
done
done
Hack 75. Kill Processes the Right Way
The Linux kill command enables you to terminate processes normally or by using a sledgehammer.
If you spend much time as a Linux user or administrator, sooner or later you're going to have to end a process
(often simply a program that no longer responds to user input or that just won't seem to go away). The safest
way to kill a process is to simply use the kill command, with no modifiers or flags. First use the ps ef
command to determine the process ID (PID) of the process you want to kill, and then simply type this
command:
# kill -pid
309
309
The standard kill command usually works just fine, terminating the offending process and returning its
resources to the system. However, if your process has started child processes, simply killing the parent can
potentially leave the child processes running, and therefore still consuming system resources. In order to
prevent such so-called "zombie processes," you should make sure that you kill any and all child processes
before you kill their respective parent processes.
8.8.1. Killing Processes in the Right Order
You can identify child process and their parents by using the Linux ps -ef command and examining each
entry, looking at the column labeled PPID (parent process ID). However, if you're only interested in a
specific family of processes, using the grep command makes life easier.
Let's look at an example. If we're trying to kill the httpd process, we'll need to kill its child processes before
we can kill the parent. As a shortcut, use the following command to determine the PIDs that we'll need to
terminate:
# ps ef | grep httpd
[root@aardvark kida]# ps -ef | grep httpd
root 23739 1 0 Jun06 ? 00:00:07 /usr/sbin/httpd
apache 24375 23739 0 Jul17 ? 00:00:01 /usr/sbin/httpd
apache 24376 23739 0 Jul17 ? 00:00:00 /usr/sbin/httpd
apache 24377 23739 0 Jul17 ? 00:00:01 /usr/sbin/httpd
apache 24378 23739 0 Jul17 ? 00:00:00 /usr/sbin/httpd
apache 24379 23739 0 Jul17 ? 00:00:00 /usr/sbin/httpd
apache 24380 23739 0 Jul17 ? 00:00:01 /usr/sbin/httpd
apache 24383 23739 0 Jul17 ? 00:00:00 /usr/sbin/httpd
apache 24384 23739 0 Jul17 ? 00:00:01 /usr/sbin/httpd
The first column tells us the user that owns each process, and the second and third columns tell us their PIDs
and PPIDs, respectively. The first process listed, with the PPID of 1, is the parent process. When a process has
a PPID of 1, that means it was started by init at boot time.
The first thing to try now that we have the parent process ID is to try to gracefully take it down by using the
following command:
# kill 1 23739
The -1 option tells the kill command to attempt to end the process as if the user who started it has logged
out. When you use this option, the kill command also attempts to go through and kill child processes left
behind. This won't always work, thoughyou may still need to go through and kill child processes manually
first, before killing the parent process. To kill more than one process at a time, simply separate the PIDs with
spaces on the kill command line:
# kill 24384 24383 24380
A second option is to send a TERM signal to the parent process in an attempt to kill it and its child processes.
This can be done using the following command:
# kill TERM 23739
310
310