Báo cáo y học: "Serum protein profile in systemic-onset juvenile idiopathic arthritis differentiates response versus nonresponse to therapy" ppt
Bạn đang xem bản rút gọn của tài liệu. Xem và tải ngay bản đầy đủ của tài liệu tại đây (396.56 KB, 10 trang )
Open Access
Available online />R746
Vol 7 No 4
Research article
Serum protein profile in systemic-onset juvenile idiopathic
arthritis differentiates response versus nonresponse to therapy
Takako Miyamae
1
, David E Malehorn
2
, Bonnie Lemster
1
, Masaaki Mori
3
, Tomoyuki Imagawa
3
,
Shumpei Yokota
3
, William L Bigbee
2
, Manda Welsh
2
, Klaus Klarskov
4
, Norihiro Nishomoto
5
,
Abbe N Vallejo
1
and Raphael Hirsch
1
1
Division of Rheumatology, Children's Hospital of Pittsburgh, Department of Pediatrics, University of Pittsburgh School of Medicine, Pittsburgh, PA
15213
2
University of Pittsburgh Cancer Institute, University of Pittsburgh School of Medicine, Pittsburgh, PA 15213
3
Department of Pediatrics, Yokohama City University School of Medicine, Yokohama, Japan
4
Départment de Phamacologie, Faculté de Medicine, Université de Sherbrooke, Québec, Canada
5
Osaka University, Osaka, Japan
Corresponding author: Raphael Hirsch,
Received: 20 Jan 2005 Revisions requested: 22 Feb 2005 Revisions received: 26 Feb 2005 Accepted: 28 Feb 2005 Published: 4 Apr 2005
Arthritis Research & Therapy 2005, 7:R746-R755 (DOI 10.1186/ar1723)
This article is online at: />© 2005 Miyamae et al.; licensee BioMed Central Ltd.
This is an Open Access article distributed under the terms of the Creative Commons Attribution License ( />2.0), which permits unrestricted use, distribution, and reproduction in any medium, provided the original work is properly cited.
Abstract
Systemic-onset juvenile idiopathic arthritis (SJIA) is a disease of
unknown etiology with an unpredictable response to treatment.
We examined two groups of patients to determine whether there
are serum protein profiles reflective of active disease and
predictive of response to therapy. The first group (n = 8)
responded to conventional therapy. The second group (n = 15)
responded to an experimental antibody to the IL-6 receptor
(MRA). Paired sera from each patient were analyzed before and
after treatment, using surface-enhanced laser desorption/
ionization time-of-flight mass spectrometry (SELDI-TOF MS).
Despite the small number of patients, highly significant and
consistent differences were observed before and after response
to therapy in all patients. Of 282 spectral peaks identified, 23
had mean signal intensities significantly different (P < 0.001)
before treatment and after response to treatment. The majority
of these differences were observed regardless of whether
patients responded to conventional therapy or to MRA. These
peaks represent potential biomarkers of active disease. One
such peak was identified as serum amyloid A, a known acute-
phase reactant in SJIA, validating the SELDI-TOF MS platform
as a useful technology in this context. Finally, profiles from serum
samples obtained at the time of active disease were compared
between the two patient groups. Nine peaks had mean signal
intensities significantly different (P < 0.001) between active
disease in patients who responded to conventional therapy and
in patients who failed to respond, suggesting a possible profile
predictive of response. Collectively, these data demonstrate the
presence of serum proteomic profiles in SJIA that are reflective
of active disease and suggest the feasibility of using the SELDI-
TOF MS platform used as a tool for proteomic profiling and
discovery of novel biomarkers in autoimmune diseases.
Introduction
Systemic-onset juvenile idiopathic arthritis (SJIA) is a form of
childhood arthritis of unknown etiology, characterized by sys-
temic features in addition to arthritis, including spiking fever,
erythematous rash, articular involvement, and other, visceral
manifestations [1]. Its clinical course is associated with
changes in the levels of several serum proteins, including IL-6
[2]. Over half of children with SJIA eventually recover almost
completely [3]. The other half have severe, unremitting arthri-
tis, poorly responsive to conventional therapy, leading to poor
functional outcome and substantial morbidity [4]. In view of the
heterogeneity of clinical disease manifestations and the unpre-
dictability of treatment responses in SJIA, there would be great
IL = interleukin; IMAC-3 = immobilized metal affinity capture; LC-ESI-MS/MS-TOF = liquid chromatography electrospray ionization tandem mass
spectrometry time-of-flight; MALDI-TOF MS = matrix-associated laser desorption/ionization time-of-flight mass spectrometry; MRA = humanized anti-
IL-6 receptor monoclonal antibody; SAA = serum amyloid A; SELDI-TOF MS = surface-enhanced laser desorption/ionization time-of-flight mass spec-
trometry; SJIA = systemic juvenile idiopathic arthritis.
Arthritis Research & Therapy Vol 7 No 4 Miyamae et al.
R747
clinical benefit in the discovery of biomarkers reflective of dis-
ease activity and predictive of response to therapy.
Proteomics, or protein pattern analysis, is the characterization
and quantitation of proteins in tissues and body fluids [5]. Pro-
teomic methods can be used to compare protein expression
patterns between disease states. Although two-dimensional
gel electrophoresis has been the primary technique in conven-
tional proteomic analysis, it is relatively insensitive to proteins
of low abundance and below 10 kDa in mass, is labor inten-
sive, and has low throughput. A more recent technology
known as surface-enhanced laser desorption/ionization time-
of-flight mass spectrometry (SELDI-TOF MS), a derivative of
conventional matrix-associated laser desorption/ionization
time-of-flight mass spectrometry (MALDI-TOF MS), involves
the application of a biologic sample, such as serum, to a pro-
tein-binding chip [6]. The chip is irradiated with a laser, result-
ing in ionization of the adherent molecules. The ions travel
through a vacuum tube and their mass-to-charge ratios are cal-
culated from their time of flight through the vacuum chamber.
The technology is high throughput, rapid, and sensitive and
provides a profile of low-molecular-weight peptides and pro-
teins within a complex mixture such as serum.
SELDI-TOF MS does not directly identify specific proteins. It
has been used to differentiate disease states from nondisease
states by analysis of protein profiles in sera. Examples include
the differentiation of neoplastic from non-neoplastic breast
masses [7], prognostic and diagnostic classification of breast
cancer [8], neoplastic versus non-neoplastic disease of the
ovary [9], and prostate cancer from both men with benign
hyperplasia and healthy men [10]. SELDI-TOF MS has also
been used for the discovery of disease-related biomarkers in
sera. Examples include detection of serum amyloid α in
patients with renal cancer [11] and the quantitation of pros-
tate-specific membrane antigen in prostate cancer [12].
The present study was designed to determine whether there
are serum proteomic profiles in SJIA that are reflective of
active disease and predictive of response to therapy, as well
as to determine whether SELDI-TOF MS could be used as a
tool for proteomic profiling and for discovery of novel biomar-
kers of SJIA.
Materials and methods
Patients and study subjects
Banked sera from 23 patients (14 boys, 9 girls) with SJIA
according to the criteria established by the International
League of Association for Rheumatology [13] were obtained
from the Department of Pediatrics, Yokohama City University
School of Medicine, Yokohama, Japan. All the patients were
Asian and their mean age at the start of the study was 7.25 ±
0.92 years. Eight of them had obtained a clinical response to
conventional therapy. Clinical response was defined as the
absence of fever rash, hepatosplenomegaly, and arthritis for at
least 3 months, accompanied by normalization of serum C-
reactive protein. Briefly, conventional therapy consisted of
three doses of intravenous methylprednisolone (30 mg/kg per
day) or oral prednisolone (1 to 2 mg/kg), followed by nonster-
oidal anti-inflammatory drugs (NSAIDs) and a tapering dose of
oral prednisolone. In addition, methotrexate (2.5 to 5 mg/m
2
per week orally) was used in three patients and cyclosporin (5
mg/kg per day orally) in two. The mean period from acute sta-
tus to complete clinical response was 27.7 ± 14.6 months. Fif-
teen patients who had inadequate response to the above
therapy, as well as to the addition of azathioprine (five
patients), mizoribine (five patients), sulfasalazine (two
patients), or plasma exchange (three patients), had been
administered humanized anti-IL-6 receptor antibody (MRA;
Chugai Pharmaceuticals, a subsidiary of Roche Pharmaceuti-
cals). All 15 patients had a clinical response to MRA. The
mean period from acute status to clinical response was 11.2
± 5.1 months. Pretreatment sera were collected before start-
ing conventional treatment or giving the initial dose of MRA.
Post-treatment sera were collected 2 to 3 months after
patients achieved a clinical response. Ethical approval for this
study was granted by Yokohama University. The study was
approved by both Chugai Pharmaceuticals and Roche
Pharmaceuticals.
SELDI-TOF MS
Serum samples were thawed on ice, denatured, and proc-
essed in duplicate on IMAC-3 (immobilized metal affinity cap-
ture) copper ProteinChip
®
Arrays (Ciphergen Biosystems,
Fremont, CA, USA). ProteinChips were loaded, processed,
and prepared for mass spectrometry using a Biomek2000 liq-
uid handling robot (Beckman-Coulter, Fullerton, CA, USA) and
optimized for reproducibility using validated protocols. Pro-
teinChips were read in a PBSIIc mass spectrometer (Cipher-
gen) with mass deflection at 1 kDa and time-lag focusing. The
resulting mass spectra were examined between m/z values of
2 and 100 kDa for quantitative comparison of identifiable peak
features. The parameters used for spectral preprocessing and
peak selection were: external calibration (seven peptide cali-
brants, 1 to 7 kDa, Ciphergen), baseline subtraction by 8 ×
expected peak width and smoothing, filtering by average using
0.2 expected peak width, noise defined over 1500 Da, normal-
ization by total ion current (TIC) over 1500 Da, peaks detected
over 2000 kDa by centroid mass. Weak spectra were
excluded from analysis if the normalization factor exceeded 2
standard deviations above the mean normalization factor.
Statistical analysis
Peak clustering among sample groups was performed with the
Biomarker Wizard (Ciphergen) tool, with a peak detection
threshold of 5 for signal-to-noise ratio, and mass tolerance of
0.3%, for any peak appearing in at least 5% of experimental
spectra being compared. The Biomarker Wizard compares the
mean intensity of peak clusters, by sample group, using the
nonparametric Mann–Whitney U test (two–way comparisons)
Available online />R748
and generates P values that reflect probabilities that mean
peak intensities at a given m/z value differ by random chance.
The intensity values of the automatically clustered peaks (aver-
aged between technical replicates of each sample) were used
in classification tree analysis (CART) using Ciphergen's
Biomarker Patterns Software. This supervised learning proc-
ess uses cross-validation to optimize the minimization of clas-
sification error.
Immunoprecipitation of SAA
A pooled sample from four sera taken before conventional
treatment was incubated with either Protein A–Sepharose
beads alone or Protein A–Sepharose beads bound with 100
µg of anti-SAA antibody (Anogen, Yes Biotech Laboratories,
Mississauga, ON, Canada). After immunoprecipitation, the
depleted serum was subjected to SELDI-TOF MS.
LC-ESI-MS/MS-TOF analysis
Protein identification by MS was carried out as previously
described [14]. Briefly, serum samples were subjected to
immunoprecipitation with anti- SAA or with an IgG isotype
control. Immunoprecipitates were washed extensively in phos-
phate-buffered serum and centrifuged, and the pellet was son-
icated for 10 min in 8 M urea/400 mM NH
4
HCO
3
. The
supernatant was diluted in water to a final concentration of 2
M urea/100 mM NH
4
HCO
3
and digested overnight at 37°C
with 1 µg trypsin. The tryptic digest was subjected to nano-
LC-ESI-MS/MS analysis that was performed on a Q-TOF-2™
(Waters, Milford, MA, USA), coupled on line to a CapLC sys-
tem equipped with three separate syringe pump modules, an
auto injector, a 10-port valve and a 250-µm (inner diameter) ×
1-mm pre-column. Separations were performed on a 7-cm ×
75-µm (inner diameter) capillary column. Both columns were
packed with Microsorb C18 (Varian, Mississauga, ON, Can-
ada) reverse-phase material. Peptides were eluted at a flow
rate of 0.25 µl/min with the following linear gradient of solvent
B (80% aqueous acetonitrile with 10% isopropanol and 0.2%
formic acid) in solvent A: from 0 to 60% B in 40 min, to 90%
B in 7 min, and to 10% B in 8 min. Spectra were acquired in
auto MS/MS mode conducted using survey scans to choose
up to three precursor ions. Collision energies were selected
automatically as a function of m/z value and charge state. The
Q-TOF mass spectrometer was calibrated by infusing a solu-
tion of either NaI containing a small amount of cesium ion dis-
solved in 50% aqueous isopropanol (0.2 µg/µl) or Glu-
fibrinopeptide B (1 pmol/µl) dissolved in 30% aqueous ace-
tonitrile containing 0.2% formic acid. Protein identification was
performed using the MASCOT search program (Matrix Sci-
ence Limited,
) and the NCBI
(National Center for Biotechnology Information) (Bethesda,
MD, USA) protein database.
Results
Protein profiling by SELDI-TOF MS reveals distinct
patterns differentiating active from well-controlled SJIA
To determine whether SELDI-TOF MS could be a valuable tool
for analyzing serum protein profiles in autoimmunity, we chose
SJIA as a test model, since the disease has systemic features,
in addition to arthritis, likely to be reflected in the serum. Paired
sera were available from patients who had been followed up
for a mean of 24.4 ± 6.9 months. The availability of paired sera
from each patient allowed for longitudinal comparison and
substantially reduced sample variability between the two
groups. Sera from eight patients with SJIA who responded to
conventional therapy (therapy and definition of clinical
response are described in detail in the Materials and methods
section) were analyzed before and after therapy by SELDI-
TOF MS using Ciphergen IMAC-3 (immobilized metal affinity
capture) copper chips (Fig. 1). All samples were run in dupli-
cate. Table 1 shows the most significant differences between
mass spectra of sera before and after conventional therapy.
Only variables with nonparametric P values of <0.001 are
given. Of 282 spectral peaks identified, 23 had mean signal
intensities that were significantly different (P < 0.001) before
and after response to treatment. These peaks represent
potential biomarkers of active disease. We next performed a
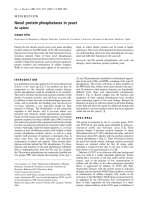
Figure 1
SELDI-TOF MS techniqueSELDI-TOF MS technique. Serum samples are spotted onto IMAC-3 copper chips
®
(Ciphergen Biosystems). The chip is irradiated with a laser,
resulting in ionization of the adherent molecules. The ions travel through a vacuum tube and their mass-to-charge ratios are calculated from their time
of flight through the vacuum chamber. IMAC-3, immobilized metal affinity capture; SELDI-TOF MS, surface-enhanced laser desorption/ionization
time-of-flight mass spectrometry.
Arthritis Research & Therapy Vol 7 No 4 Miyamae et al.
R749
similar analysis on paired sera from 15 patients who had failed
conventional therapy but responded to an experimental anti-
body to the IL-6 receptor (MRA) [15]. These sera were
obtained after failure of conventional therapy. Pre- and post-
MRA sera revealed similar profiles to those observed in the
pre- and post-conventional therapy group. Thus, substantial
consistency was observed in protein profiles, regardless of
whether patients with active disease responded to conven-
tional therapy or to MRA. Eight of the differentially expressed
peaks represent prominent, visually distinct spectral features.
These peaks are represented in Table 1 in bold, along with the
number of paired patient sera in which each peak was differ-
entially expressed by visual inspection of the spectra. Repre-
sentative examples of these peaks are shown in Fig. 2.
To determine the usefulness of the profiles in classifying active
versus controlled SJIA, the data were subjected to CART
(Biomarker Patterns Software, Ciphergen) analysis. This sam-
ple classification method is designed, through multivariate
analysis, to construct classification trees recognizing a com-
plex pattern of multiple peak intensities. The method is ideally
suited for sample sets large enough to permit cross-validation
Table 1
SELDI-TOF MS protein peaks differentially expressed in paired sera from SJIA before and after therapy
Before/after conventional therapy Before/after MRA
Mass (m/z) P Patients with visually distinct
peaks/total no. of patients
P Patients with visually distinct peaks/
total no. of patients
4504 0.0001 0.005
4758 0.0005 0.0006
5739 0.0001 0.00000008
6441 0.00009 0.0001
6947 0.0005 0.003
9510 0.0007 6/8 0.00001 12/15
9725 0.00006 0.00001
11405 0.00001 8/8 0.000000003 14/15
11520 0.000007 8/8 0.000000001 14/15
11641 0.000005 8/8 0.0000000001 14/15
11718 0.0004 0.00002
11880 0.0002 0.0000006
12703 0.0006 7/8 0.04 6/15
20816 0.0002 7/8 0.01 9/15
22389 0.0002 0.00005
23627 0.0002 0.09
28734 0.0002 0.00006
33457 0.00001 6/8 0.00001 11/15
66637 0.0001 7/8 0.000009 11/15
74886 0.0006 0.00003
75622 0.0009 0.0001
76319 0.0008 0.00002
79216 0.0007 0.000003
Differences between mass spectra of sera before and after conventional therapy. Sera from eight patients with SJIA who responded to
conventional therapy were analyzed before and after therapy by SELDI-TOF MS using Ciphergen IMAC-3 copper chips. All samples were run in
duplicate. Only variables with nonparametric P values of <0.001 are given. Of 282 spectral peaks identified, the 23 listed here had mean signal
intensities significantly different (P < 0.001) before and after response to treatment. Proteins are listed according to mass/charge ratio. Visually
distinct peaks (in bold type) refers to peaks that were clearly different between paired samples from before and after treatment upon visual
inspection of the profiles, as shown in Fig. 1. The numbers of patients in whom these peaks were visually distinct are shown in columns 3 and 5.
These peaks represent potential biomarkers of active disease. IMAC-3, immobilized metal affinity capture; MRA, humanized anti-IL-6 receptor
monoclonal antibody; SELDI-TOF MS, surface-enhanced laser desorption/ionization time-of-flight mass spectrometry; SJIA, systemic juvenile
idiopathic arthritis.
Available online />R750
internal to the 'training' data, but also the segregation of addi-
tional unused data as a validation or 'testing' set. On these rel-
atively small sample sets, CART was used in training mode
primarily as a data exploration tool. Whether using the training
set as the MRA group, or as the conventional treatment group,
the CART analysis returned simple classification trees consist-
ing of one primary splitter, either 11.4 kDa or 11.6 kDa (m/z).
The primary splitter at 11493 kDa correctly identified 13 of 14
pretreatment and 14 of 15 post-MRA treatment samples when
conventional treatment was used as the training set. When
MRA treatment was used as the training set, all of the pre- and
post-conventional treatment samples were correctly identified
as either pretreatment or post-treatment. The distinction
between these samples by CART registered at the most
extreme level of significance the program is capable of indicat-
ing. Even when forced to ignore the mass spectrum peaks at
11493 or 11650 Da, the CART program was able to effec-
tively discriminate, using secondary peaks derived from them
(at half these m/z values; attributed to doubly protonated spe-
cies). This robust classification surpasses the performance of
any other sample set being profiled and analyzed by this and
several other statistical methods at this institution (data not
shown).
Identification of serum amyloid A from SELDI-TOF MS
mass spectra
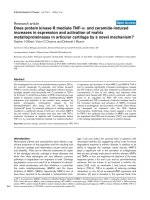
A prominent group of peaks within the range 11.4 to 11.7 kDa
m/z strongly distinguished the pre- and post-treatment sam-
ples (Fig. 3). The post-treatment groups showed an apparently
single m/z peak at 11.75 kDa, which was also routinely
observed in pooled reference sera from healthy adults (data
not shown). A previous study in nasopharyngeal cancer, using
the same SELDI-TOF technique and IMAC3 copper chip,
identified two biomarkers, of 11.6 and 11.8 kDa, as serum
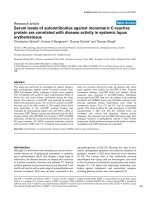
amyloid A (SAA) [16]. Since SAA is a known biomarker of
active SJIA [17], we compared the intensity of the 11.6-kDa
peak with SAA levels in the sera, as determined by latex agglu-
tination. As shown in Fig. 4, a strong correlation was observed
(R
2
= 0.74), suggesting that the 11.6-kDa peak might repre-
sent SAA. To further investigate the biochemical identity of this
peak, serum containing high levels of the 11.6-kDa peak was
subjected to immunoprecipitation using anti-SSA antibody
bound to Protein A–Sepharose beads. As shown in Fig. 5,
after immunoprecipitation and SELDI analysis, the 11.4- and
11.6-kDa peaks were markedly diminished. To confirm the
identity of the immunoprecipitated protein, anti-SAA precipi-
tates were digested with trypsin and subjected to η-scale liq-
uid chromatography electrospray ionization tandem mass
spectrometry time-of-flight (LC-ESI-MC/MS-TOF) analysis.
Over 90 peptide ions were examined and only 2 proteins were
identified, including immunoglobulin and SAA. The SAA pep-
tide ions represented approximately 51% of the SAA
sequence.
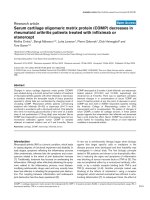
Figure 2
SELDI-TOF MS profiles for patients with SJIA treated conventionallySELDI-TOF MS profiles for patients with SJIA treated conventionally.
Six serum protein peaks can be clearly seen to have changed after con-
ventional therapy. The profiles of a representative patient are shown
here. Visually distinct peaks that were clearly different between pre- and
post-treatment paired samples upon visual inspection of the profiles (in
bold type in Table 1) are outlined in grey. Pre- and post-treatment spec-
tra are shown on the same intensity scale in each frame. SELDI-TOF
MS, surface-enhanced laser desorption/ionization time-of-flight mass
spectrometry SJIA, systemic juvenile idiopathic arthritis.
Arthritis Research & Therapy Vol 7 No 4 Miyamae et al.
R751
Protein profiling by SELDI-TOF MS reveals patterns
differentiating the responding from the nonresponding
SJIA group
The above data, using paired sera, demonstrate the ability of
SELDI-TOF MS to identify biomarkers of active disease, as
exemplified by the identification of SAA. A long-term goal is to
predict clinical outcome, based on protein profiles present in
the serum early in the disease course. To begin to approach
this challenge, we compared the pretreatment serum profiles
of the 8 patients who responded to conventional therapy with
those from the 15 patients who responded poorly to conven-
tional therapy. Similar to the preceding analysis, the latter sam-
ples were obtained after failure of conventional therapy and
before MRA treatment, when the patients still had active dis-
ease. In this initial exploratory study, the number of available
samples was too small for definitive conclusions; however,
several interesting trends were apparent. Several highly signif-
icant differences were observed in the mass spectra of these
sera, as shown in Table 2 and Fig. 6. These peaks may repre-
sent a profile predictive of response to conventional therapy.
Alternatively, they could represent the effects of conventional
therapy or differences between early versus long-standing dis-
ease. A number of peaks overlap with regions observed in
Table 1, including the region of SAA (11.6 kDa) as well as
4504 kDa and 28 kDa.
Figure 3
SELDI-TOF MS profiles for patients with SJIA before and after conven-tional or MRA treatmentSELDI-TOF MS profiles for patients with SJIA before and after conven-
tional or MRA treatment. Sera taken before conventional and MRA
treatment show similar patterns that are distinct from the post-treatment
profiles. Mean spectra of all patients are shown in the 11- to 12-kDa m/
z range. Means are compiled from 8 samples before and after conven-
tional therapy and 15 samples before and after MRA therapy, each
sample run in duplicate. Spectra were preprocessed as described in
the Materials and methods section. MRA, humanized anti-IL-6 receptor
monoclonal antibody; SELDI-TOF MS, surface-enhanced laser desorp-
tion/ionization time-of-flight mass spectrometry SJIA, systemic juvenile
idiopathic arthritis.
Figure 4
Peak intensities of the 11.6-kDa m/z SELDI peak in serum after MRA treatment in SJIAPeak intensities of the 11.6-kDa m/z SELDI peak in serum after MRA treatment in SJIA. The peak intensities correlated with the SAA titers measured
by latex agglutination. MRA, humanized anti-IL-6 receptor monoclonal antibody; SAA, serum amyloid A; SELDI, surface-enhanced laser desorption
SJIA, systemic juvenile idiopathic arthritis.
Available online />R752
We were fortunate to have pre-conventional treatment sera
available from 3 of the 15 patients who responded poorly to
conventional therapy and went on to receive MRA. These three
pretreatment sera were compared with the pretreatment sera
of the eight patients who responded to conventional therapy.
Three peaks of interest were observed. As shown in Fig. 7, all
the nonresponders had lower values for the 4825-Da feature
and higher values for the 3276-Da and 3293-Da peaks than
did the responders, with the exception of a single outlier sam-
ple. However the sample size is small and this observation
needs further validation in a larger clinical cases series; this
putative signature of nonresponse may be susceptible to sta-
tistical overfitting, even at this level of analysis.
Discussion
Current diagnostic techniques for rheumatic diseases are
based on clinical presentation and nonspecific serum markers.
Because the phenotype of a rheumatic disease such as SJIA
is largely dependent on proteins, the present study was
designed to determine whether serum protein expression pro-
filing with SELDI-TOF MS could be used to search for new
molecular diagnostic biomarkers and potential therapeutic tar-
gets. This approach has theoretical advantages over other
modalities used to identify differentially expressed proteins.
SELDI-TOF MS analysis is capable of detecting small
amounts of protein, hence the potential to detect proteins of
relatively low abundance with affinity for the ProteinChip
surface. The technique is high throughput, allowing detection
of hundreds of species in a single sample, and is capable of
analyzing large number of samples. The data presented here
show that it is possible to generate mass spectrometry protein
expression profiles from serum that can differentiate active ver-
sus controlled SJIA.
Table 2
SELDI-TOF MS unpaired serum protein peaks differentially expressed in SJIA before and after conventional therapy
Mass (m/z) P
4504 0.0004
11650 0.0003
11691 0.0002
14047 0.00001
28107 0.000002
28958 0.0000005
39871 0.0004
46175 0.0008
60806 0.0002
Differences between mass spectra of pretreatment sera of 8 patients who went on to respond to conventional therapy compared with post-
treatment sera of 15 patients who responded poorly to conventional therapy. Only variables with nonparametric P values of <0.001 are listed,
from 272 peak clusters surveyed. These peaks may represent a profile predictive of response or nonresponse to conventional therapy. SELDI-TOF
MS, surface-enhanced laser desorption/ionization time-of-flight mass spectrometry; SJIA, systemic juvenile idiopathic arthritis.
Figure 5
Immunoprecipitation of SAA in SJIA, resulting in loss of the 11.4- to 11.6-kDA peak clusterImmunoprecipitation of SAA in SJIA, resulting in loss of the 11.4- to
11.6-kDA peak cluster. A pooled sample from four sera before conven-
tional treatment (top panel) was incubated with either Protein A–
Sepharose beads alone (middle panel) or Protein A–Sepharose beads
bound with anti-SAA antibody (lower panel). After immunoprecipitation,
the depleted serum was subjected to SELDI-TOF MS. The 11.4-to
11.6-kDa m/z peak cluster is shown in grey. MRA, humanized anti-IL-6
receptor monoclonal antibody; SAA, serum amyloid A; SELDI-TOF MS,
surface-enhanced laser desorption/ionization time-of-flight mass spec-
trometry; SJIA, systemic-onset juvenile idiopathic arthritis.
Arthritis Research & Therapy Vol 7 No 4 Miyamae et al.
R753
Some of the difficulties inherent in gene or protein expression
profiling in human disease include accounting for the genetic
and environmental variability between patients and the poten-
tial for detecting chance associations when measuring large
numbers of proteins or genes. The use of paired serum sam-
ples from individual patients in the present study removes
most of these variables and makes it likely that the changes in
protein profiles after successful treatment reflect the disease
state rather than confounding variables. We found a surprising
degree of consistency in the relative abundance of a number
of serum proteins in ill versus well patients. The clear
distinction in the levels of these various ionic species between
these sample groups permits a robust classification based on
simple thresholding on any one of a number of possible
variables.
One disadvantage of the SELDI-TOF MS technology is that
protein sequences, and thus specific identifications, are not
obtained, requiring further biochemical/mass spectrometry
analysis to identify differentially-expressed proteins. A recent
study using two-dimensional gels and MALDI-TOF MS analy-
sis of plasma and synovial fluids from patients with rheumatoid
arthritis or osteoarthritis also revealed the presence of SAA in
samples from rheumatoid arthritis but not osteoarthritis [18].
Although SELDI-TOF MS is not directly quantitative, it can
detect changes in the relative abundance of proteins in a man-
ner that compares favorably to quantitative methods such as
latex agglutination or enzyme-linked immunosorbent assay.
Identification of SAA by SELDI-TOF MS helps validate our
experimental approach, since SAA is a known marker of active
SJIA.
Although we were able to identify SAA by further analysis,
there were many other peaks observed in the serum profiles
that have yet to be explored or identified. The 66.6-kDa and
33.4-kDa peaks most likely represent serum albumin and its
doubly protonated form, as they are the correct mass and they
increase after response to therapy, reflective of the known rise
in serum albumin levels in these patients (data not shown).
Identification of the other peaks is currently being investigated
and may yield novel information on the pathophysiology of
SJIA. Furthermore, the proteins observed represent only a
fraction of those present in the serum. We observed only a
subset of relatively high-abundance proteins, limited by their
concentration in the serum, their affinity with the copper matrix
of the IMAC ProteinChip, and the relative desorption/ioniza-
tion efficiencies of each protein. In addition, the fact that the
mass spectra generated in this study were from unfractionated
sera is likely to obscure many protein species that might
otherwise be detectable in the absence of high-abundance
serum proteins. Refinement of the methodologies for process-
ing serum samples, including initial depletion of high-abun-
dance proteins, is likely to substantially increase the
information that can be derived from the resulting profiles.
There are likely many more subtypes of the group of diseases
known collectively as idiopathic arthritis than have as yet been
defined by clinical criteria. The ability to differentiate
uncontrolled from controlled SJIA by serum protein profiling
raises the possibility of more specific diagnostic and prognos-
tic criteria for evaluating such patients. Furthermore, the dra-
matic mass spectral differences observed between the
sample groups led us to compare sera obtained before any
treatment, from patients who ultimately differed in their
response to conventional therapy. While the current work can
Figure 6
Differences between mass spectra of sera before and after MRA treatment for SJIADifferences between mass spectra of sera before and after MRA treatment for SJIA. Sera were taken before and after treatment with MRA from
patients for whom conventional therapy had failed. The high significance of these differences suggests a profile predictive of response to conven-
tional therapy. The values represent mean intensities. The P values of these univariate comparisons are given in Table 2. Error bars represent stand-
ard deviations. MRA, humanized anti-IL-6 receptor monoclonal antibody; SJIA, systemic-onset juvenile idiopathic arthritis.
Available online />R754
only comment on an anecdotal basis from a limited number of
these samples, some early differences were observed that
suggest that a prognostic profile might exist. Beyond the obvi-
ous clinical usefulness of such a profile, it also could provide a
discovery tool for further characterization of the pathophysiol-
ogy of SJIA.
Although SELDI-TOF MS was recently used to compare syn-
ovial fluids from patients with rheumatoid arthritis and osteoar-
thritis [19], the present study is, to our knowledge, the first to
define a serum proteomic profile of a rheumatic disease using
SELDI-TOF MS. The SELDI-TOF MS technique described
here provides a rapid, high throughput, and mass accurate
method for detecting relative quantities of multiple disease-
related proteins simultaneously. Using this platform, we identi-
fied a protein (SAA) known to be elevated in active SJIA. This
proteomic profiling approach has the potential to expand the
current repertoire of molecular targets and to provide diagnos-
tic and prognostic information useful for improving the care of
and ultimate outcome for SJIA patients.
Conclusion
This study demonstrates the presence of serum proteomic
profiles in SJIA that are reflective of active disease and sug-
gests the feasibility of using the SELDI-TOF MS platform used
as a tool for proteomic profiling in autoimmune diseases.
Furthermore, the study validates the ability of the SELDI-TOF
MS platform to identify a known biomarker of SJIA (SAA),
suggesting that it may also be useful as a screening approach
towards the discovery of novel biomarkers. To that end,
identifying the 22 unknown m/z protein species in the serum
profiles of our patients is now the focus of further investigation.
Competing interests
The author(s) declare that they have no competing interests.
Authors' contributions
TM, DM, BL, and RH participated in all experimental design,
data collection, and analysis and helped draft the manuscript.
MM, TI, SY, and NN provided patient sera and clinical data.
MW carried out the sample preparation. KK and AV carried out
the LC ESI-MS/MS-TOF analysis and helped draft the manu-
script. All authors read and approved the final manuscript.
References
1. Still GF: On a form of chronic joint disease in children. Med
Chir Trans 1897, 80:47.
2. de Benedetti F, Massa M, Robbioni P, Ravelli A, Burgio GR, Martini
A: Correlation of serum interleukin-6 levels with joint involve-
ment and thrombocytosis in systemic juvenile rheumatoid
arthritis. Arthritis Rheum 1991, 34:1158-1163.
3. Spiegel LR, Schneider R, Lang BA, Birdi N, Silverman ED, Laxer
RM, Stephens D, Feldman BM: Early predictors of poor func-
tional outcome in systemic-onset juvenile rheumatoid arthri-
tis: a multicenter cohort study. Arthritis Rheum 2000,
43:2402-2409.
4. Oen K, Malleson PN, Cabral DA, Rosenberg AM, Petty RE, Reed
M, Schroeder ML, Cheang M: Early predictors of longterm out-
come in patients with juvenile rheumatoid arthritis: subset-
specific correlations. J Rheumatol 2003, 30:585-593.
5. Petricoin EF, Zoon KC, Kohn EC, Barrett JC, Liotta LA: Clinical
proteomics: translating benchside promise into bedside
reality. Nat Rev Drug Discov 2002, 1:683-695.
6. Wright GL Jr: SELDI proteinchip MS: a platform for biomarker
discovery and cancer diagnosis. Expert Rev Mol Diagn 2002,
2:549-563.
7. Li J, Zhang Z, Rosenzweig J, Wang YY, Chan DW: Proteomics
and bioinformatics approaches for identification of serum
biomarkers to detect breast cancer. Clin Chem 2002,
48:1296-1304.
8. Laronga C, Becker S, Watson P, Gregory B, Cazares L, Lynch H,
Perry RR, Wright GL Jr, Drake RR, Semmes OJ: SELDI-TOF
serum profiling for prognostic and diagnostic classification of
breast cancers. Dis Markers 2003, 19:229-238.
9. Petricoin EF, Ardekani AM, Hitt BA, Levine PJ, Fusaro VA, Stein-
berg SM, Mills GB, Simone C, Fishman DA, Kohn EC, et al.: Use
Figure 7
Serum proteins in SJIA patients according to whether they responded to conventional therapySerum proteins in SJIA patients according to whether they responded to conventional therapy. Three most significant differences distinguishing
between pretreatment samples from conventional therapy responders (n = 8) and those from nonresponders (n = 3), suggesting a profile predictive
of response to conventional therapy. The averaged peak intensity is shown for the eight pretreatment 'responder' patient samples (left panel) com-
pared with the corresponding intensities of those same three peaks from the three pretreatment 'nonresponder' patient samples (right panel). SJIA,
systemic-onset juvenile idiopathic arthritis.
Arthritis Research & Therapy Vol 7 No 4 Miyamae et al.
R755
of proteomic patterns in serum to identify ovarian cancer. Lan-
cet 2002, 359:572-577.
10. Adam BL, Qu Y, Davis JW, Ward MD, Clements MA, Cazares LH,
Semmes OJ, Schellhammer PF, Yasui Y, Feng Z, et al.: Serum
protein fingerprinting coupled with a pattern-matching algo-
rithm distinguishes prostate cancer from benign prostate
hyperplasia and healthy men. Cancer Res 2002,
62:3609-3614.
11. Tolson J, Bogumil R, Brunst E, Beck H, Elsner R, Humeny A,
Kratzin H, Deeg M, Kuczyk M, Mueller GA, et al.: Serum protein
profiling by SELDI mass spectrometry: detection of multiple
variants of serum amyloid alpha in renal cancer patients. Lab
Invest 2004, 84:845-856.
12. Xiao Z, Adam BL, Cazares LH, Clements MA, Davis JW, Schell-
hammer PF, Dalmasso EA, Wright GL Jr: Quantitation of serum
prostate-specific membrane antigen by a novel protein bio-
chip immunoassay discriminates benign from malignant pros-
tate disease. Cancer Res 2001, 61:6029-6033.
13. Petty RE, Southwood TR, Baum J, Bettay E, Glass DN, Manners P,
Maldonado-Cocco J, Suarez-Almazor M, Orozco-Alcala J, Prieur
AM: Revision of the proposed classification criteria for juvenile
idiopathic arthritis: Durban, 1997. J Rheumatol 1998,
25:1991-1994.
14. Vallejo AN, Bryl E, Klarskov K, Naylor S, Weyand CM, Goronzy JJ:
Molecular basis for the loss of CD28 expression in senescent
T cells. J Biol Chem 2002, 277:46940-46949.
15. Choy E: Interleukin 6 receptor as a target for the treatment of
rheumatoid arthritis. Ann Rheum Dis 2003:ii68-69.
16. Cho WC, Yip TT, Yip C, Yip V, Thulasiraman V, Ngan RK, Lau WH,
Au JS, Law SC, Cheng WW, et al.: Identification of serum amy-
loid a protein as a potentially useful biomarker to monitor
relapse of nasopharyngeal cancer by serum proteomic
profiling. Clin Cancer Res 2004, 10:43-52.
17. Scheinberg MA, Hubscher O, Morteo OG, Benson MD: Serum
amyloid protein levels in South American children with rheu-
matoid arthritis: a co-operative study. Ann Rheum Dis 1980,
39:228-230.
18. Sinz A, Bantscheff M, Mikkat S, Ringel B, Drynda S, Kekow J,
Thiesen HJ, Glocker MO: Mass spectrometric proteome analy-
ses of synovial fluids and plasmas from patients suffering
from rheumatoid arthritis and comparison to reactive arthritis
or osteoarthritis. Electrophoresis 2002, 23:3445-3456.
19. Uchida T, Fukawa A, Uchida M, Fujita K, Saito K: Application of a
novel protein biochip technology for detection and identifica-
tion of rheumatoid arthritis biomarkers in synovial fluid. J Pro-
teome Res 2002, 1:495-499.