Báo cáo y học: "The determinants of change in tibial plateau bone area in osteoarthritic knees: a cohort study" doc
Bạn đang xem bản rút gọn của tài liệu. Xem và tải ngay bản đầy đủ của tài liệu tại đây (223.47 KB, 7 trang )
Open Access
Available online />R687
Vol 7 No 3
Research article
The determinants of change in tibial plateau bone area in
osteoarthritic knees: a cohort study
Yuanyuan Wang
1,2
, Anita E Wluka
1
and Flavia M Cicuttini
1
1
Department of Epidemiology and PreventiveMedicine, Monash UniversityMedical School, Alfred Hospital, Prahran, Vic 3181, Australia
2
Graduate School of IntegrativeMedicine, Swinburne University of Technology, Hawthorn, Vic 3122, Australia
Corresponding author: Flavia M Cicuttini,
Received: 8 Sep 2004 Revisions requested: 19 Oct 2004 Revisions received: 27 Jan 2005 Accepted: 2 Mar 2005 Published: 31 Mar 2005
Arthritis Research & Therapy 2005, 7:R687-R693 (DOI 10.1186/ar1726)
This article is online at: />© 2005 Wang et al.; licensee BioMed Central Ltd.
This is an Open Access article distributed under the terms of the Creative Commons Attribution License ( />2.0), which permits unrestricted use, distribution, and reproduction in any medium, provided the original work is properly cited.
Abstract
Bone is integral to the pathogenesis of osteoarthritis (OA).
Whether the bone area of the tibial plateau changes over time in
subjects with knee OA is unknown. We performed a cohort
study to describe this and identify factors that might influence
the change. One hundred and twenty-six subjects with knee OA
underwent baseline knee radiography and magnetic resonance
imaging on their symptomatic knee. They were followed up with
a repeatmagnetic resonance image of the same knee
approximately 2 years later. The bone area of the tibial plateau
was measured at baseline and follow-up. Risk factors assessed
at baseline were tested for their association with change in tibial
plateau bone area over time. One hundred and seventeen
subjects completed the study. The medial and lateral tibial
plateau bone areas increased by 2.2 ± 6.9% and 1.5 ± 4.3%
per year, respectively. Being male (P = 0.001), having a higher
body mass index (P = 0.002), and having a higher baseline
grade of medial joint-space narrowing (P = 0.01) were all
independently and positively associated with an increased rate
of enlargement of bone area of the medial tibial plateau. A larger
baseline bone area of the medial tibial plateau was inversely
associated with the rate of increase of that area (P < 0.001). No
factor examined affected the rate of increase of the bone area of
the lateral tibial plateau. In subjects with established knee OA,
tibial plateau bone area increases over time. The role of
subchondral bone change in the pathogenesis of knee OA will
need to be determined but may be one explanation for the
mechanism of action of risk factors such as body mass index on
knee OA.
Introduction
Osteoarthritis (OA) is the most common form of joint disease,
with a prevalence of 10 to 30% in persons over the age of 65
[1]. However, the pathogenesis of this degenerative joint dis-
ease is not fully understood. It affects articular cartilage,
subchondral bone, and soft tissues including synovium and lig-
aments. However, the instigating lesion remains unclear and
controversial, with proponents for both cartilage and bone
abnormalities being the initiating factor [2].
Changes in subchondral bone are well described in estab-
lished OA, in human [3-7] as well as animal [8-13] models.
These changes include remodelling of the subchondral
trabeculae [3,4,8-11], stiffening of the subchondral bone
[5,12,13], thickening of the subchondral plate [4,6,11], a
steep stiffness gradient [5], and a decrease of the ability to
absorb energy [7]. These changes affect the mechanical prop-
erties of the subchondral bone and have been proposed to
play a role in the initiation and progression of degeneration of
the overlying articular cartilage [5,13,14]. It has been sug-
gested that the changes in subchondral bone may be the initi-
ating factor in the pathogenesis of OA rather than sequelae of
cartilage damage [15]. Changes in the area of subchondral
bone may reflect the changes in its architecture. The enlarge-
ment of the bone area of the tibial plateau may attenuate the
tibial cartilage, and this attenuation may play a role in the proc-
ess of OA. However, whether the size of subchondral bone is
static or changes over time in subjects with OA is unknown.
We studied a cohort of symptomatic subjects with predomi-
nantly mild to moderate knee OA over the course of 2 years,
to determine whether the bone area of the tibial plateau
BMI = body mass index; MRI = magnetic resonance imaging/image; OA = osteoarthritis; SF-36 = 36-Item Short-Form Health Survey; WOMAC =
Western Ontario and McMaster Universities Osteoarthritis Index.
Arthritis Research & Therapy Vol 7 No 3 Wang et al.
R688
changes over time and to identify the factors that might influ-
ence this change.
Materials and methods
Patients were recruited by using a combined strategy includ-
ing advertising through local newspapers and the Victorian
branch of the Arthritis Foundation of Australia, as well as col-
laboration with general practitioners, rheumatologists, and
orthopaedic surgeons, as previously described [16]. The
study was approved by the ethics committee of the Alfred and
Caulfield hospitals inMelbourne, Australia. All the patients
gave their informed consent.
One hundred and thirty-two subjects aged over 40 years who
fulfilled American College of Rheumatology (ACR) clinical and
radiographic criteria for knee OA [17] entered the study. Sub-
jects were excluded if any other form of arthritis was present,
if there was any contraindication tomagnetic resonance imag-
ing (MRI), if a total knee replacement was planned, or if they
were unable to cooperate with study requirements. We have
previously described this population in a study of the determi-
nants of change in the volume of tibial cartilage in knee OA
[16]. Weight was measured to the nearest 0.1 kg (shoes,
socks, and bulky clothing removed) using a single pair of elec-
tronic scales. Height was measured to the nearest 0.1 cm
(shoes and socks removed) using a stadiometer. Body mass
index (BMI) (weight/height
2
in kg/m
2
) was calculated. General
health, pain, stiffness, and function were assessed using the
SF-36 (36-Item Short-Form Health Survey) [18] and WOMAC
(Western Ontario andMcMaster Universities Osteoarthritis
Index) [19]. Participants were asked to complete a question-
naire regarding demographic data and current physical activity
[20].
At baseline, each subject had a weight-bearing anteroposte-
rior tibiofemoral radiograph taken of the symptomatic knee in
full extension. All radiographs were independently scored by
two trained observers using a published atlas to classify dis-
ease in the tibiofemoral joint [21]. The radiographic features of
tibiofemoral OA in each compartment were graded on a 4-
point scale (0–3) for individual features of osteophytes and
joint-space narrowing [21]. Intraobserver reproducibility was
0.93 for osteophytes and 0.93 for joint-space narrowing. Inter-
observer reproducibility was 0.86 for osteophytes and 0.85 for
joint-space narrowing (by κ statistic) [22]. Where both knees
were symptomatic and showed changes of radiographic OA,
the knee with the least severe disease was used.
Each subject had anMRI performed on the symptomatic knee
at baseline and approximately 2 years later. Knees were
imaged in a sagittal plane on the same 1.5-T whole-body mag-
netic resonance unit (Signa Advantage HiSpeed GEMedical
Systems, Milwaukee, WI, USA) using a commercial receive-
only extremity coil. The following sequence and parameters
were used: a T
1
-weighted, fat-suppressed 3D gradient recall
acquisition in the steady state; flip angle 55 degrees; repeti-
tion time 58 ms; echo time 12 ms; field of view 16 cm; 60 par-
titions; 512 (frequency direction, superior–inferior) × 512
(phase encoding direction, anterior–posterior) matrix; one
acquisition, time 11 min 56s. Sagittal images were obtained at
a partition thickness of 1.5 mm and an in-plane resolution of
0.31 mm × 0.31 mm (512 × 512 pixels). One trained reader
made the measurements in duplicate. The bone areas of the
medial and lateral tibial plateaux were determined by means of
image processing on an independent work station using the
software program Osiris (Digital Imaging Unit, University Hos-
pital of Geneva, Geneva, Switzerland), by creating an isotropic
volume from the input images, which were reformatted in the
axial plane, and then areas were directly measured from these
axial images, as previously described [22-24]. To measure the
bone area of the tibial plateau, we selected the first image that
showed both tibial cartilage and subchondral bone. The area
of medial and lateral tibial plateau bone was measured manu-
ally on this image and the next distal image (Fig. 1). An average
of the two areas was used as an estimate of the tibial plateau
bone area. The coefficients of variation (for the repeated image
analysis) for the medial and lateral tibial plateau bone area
were 2.3% and 2.4%, respectively [22].
Descriptive statistics for characteristics of the subjects were
tabulated. Independent t-tests were used for comparison of
means. The chi-square test was used to compare nominal
characteristics between the groups. Principal outcome meas-
ures in analyses were annual change and annual percentage
change of tibial plateau bone area. Change in this area was
obtained by subtracting the bone area at baseline from that at
follow-up. The annual change was calculated by dividing this
figure by the time betweenMRI scans. The annual percentage
change was obtained by dividing annual change by the base-
line bone area and multiplying by 100 to obtain a percentage.
Stepwise multiple linear regression techniques were used to
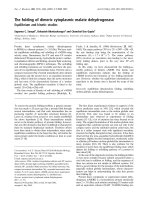
Figure 1
Axial T
1
-weighted fat-saturated 3DMRI image showing measurement of tibial plateau bone areaAxial T
1
-weighted fat-saturated 3DMRI image showing measurement of
tibial plateau bone area. The area of medial (Roi 2) and lateral (Roi 1)
tibial plateau bone is measured manually on the first image that shows
both tibial cartilage and subchondral bone (left), and on the next distal
image (right). An average of the two areas is used as an estimate of the
tibial plateau bone area. MRI, magnetic resonance image; Roi, region of
interest.
Available online />R689
explore the possible factors affecting annual percentage
change in tibial plateau bone area, including age, gender, BMI,
WOMAC score, SF-36 score, physical activity, radiographic
features (grades of osteophytes and joint-space narrowing in
the studied compartment) and baseline tibial plateau bone
area. A P value less than 0.05 (two-tailed) was regarded as
statistically significant. All analyses were performed using the
SPSS statistical package (standard version 11.5.0, SPSS,
Chicago, IL, USA).
Results
One hundred and thirty-two subjects fulfilled the study criteria
and entered this study. MR images were available for measure-
ment of tibial plateau bone area in 126 subjects (Table 1);
6MRIs were unavailable for technical reasons. Most subjects
had mild to moderate tibiofemoral OA. Compared with
women, men were significantly taller (P < 0.001) and heavier
(P = 0.01) and had lower BMI (P = 0.02), higher level of phys-
ical activity (P = 0.01), less severe medial compartment OA
(grade 0 to 1 joint-space narrowing in medial compartment) (P
= 0.04), and larger medial (P < 0.001) and lateral (P < 0.001)
tibial plateau bone area (Table 1). One hundred and seventeen
subjects completed the longitudinalMRI component of the
study. There were no significant differences between subjects
who completed the study and those who did not (results not
shown).
The medial tibial bone area increased from 2054.6 ± 363.9
mm
2
to 2128.3 ± 370.0 mm
2
(P < 0.001) and the lateral tibial
bone area, from 1407.2 ± 256.7 mm
2
to 1442.8 ± 272.4 mm
2
over the study period (P < 0.001). Medial and lateral tibial pla-
teau bone areas increased by 36.8 mm
2
(P < 0.001) and 19.1
Table 1
Characteristics of the study population
Total (n = 126) Men (n = 58) Women (n = 68) P
a
Age, years 63.6 ± 10.1 64.2 ± 10.0 63.2 ± 10.3 0.58
Height, cm 167.7 ± 9.1 174.6 ± 6.8 161.8 ± 6.1 <0.001
Weight, kg 81.4 ± 15.5 85.1 ± 14.9 78.3 ± 15.3 0.01
BMI, kg/m
2
28.9 ± 5.1 27.8 ± 3.8 29.9 ± 5.8 0.02
WOMAC score 436 ± 224 411 ± 214 457 ± 232 0.25
SF-36 score 98 ± 7 98 ± 6 99 ± 8 0.25
Physical activity 6.2 ± 1.8 6.7 ± 1.7 5.8 ± 1.8 0.01
Time between scans, years 1.95 ± 0.21 1.94 ± 0.19 1.96 ± 0.23 0.58
OA grade
b
Grade of medial osteophytes
<2 107 50 57 0.50
≥ 2 187110.35
Grade of medial JSN
<2 90 35 55 0.04
≥ 2 3522130.13
Grade of lateral osteophytes
<2 103 48 55 0.49
≥ 2 229130.39
Grade of lateral JSN
<2 116 55 61 0.58
≥ 2 9270.10
Tibial plateau area, mm
2
Medial 2054.6 ± 363.9 2331.1 ± 304.3 1860.2 ± 263.2 <0.001
Lateral 1407.2 ± 256.7 1533.4 ± 244.9 1328.2 ± 232.8 <0.001
Except where indicated otherwise, values are means ± standard deviations.
a
Men vs women, by independent t-tests or chi-square test, as
appropriate.
b
Values are the number of subjects in each grade category. One radiograph was lost after the study commenced. BMI, body mass
index; JSN, joint-space narrowing.; MRI, magnetic resonance imaging; OA, osteoarthritis; SF-36, 36-Item Short-Form Health Survey; WOMAC,
Western Ontario and McMaster Universities Osteoarthritis Index.
Arthritis Research & Therapy Vol 7 No 3 Wang et al.
R690
mm
2
(P = 0.004) per year, respectively, representing an annual
increase rate of 2.2% and 1.5% (Table 2). Although there
were no significant differences between men and women in
annual increase or percentage increase of medial or lateral tib-
ial plateau area in univariate analyses, after adjustment for
potential confounders (age, BMI, physical activity, grade of
osteophytes, grade of joint-space narrowing, and baseline tib-
ial plateau bone area), men showed a significantly greater
annual increase of medial tibial plateau bone area than women
(P = 0.002) and a significantly greater annual percentage
increase of medial tibial plateau bone area (5.4% in men com-
pared with 0.004% in women, P = 0.001) (Table 2). There
were no significant differences between men and women in
the change in lateral tibial plateau bone area.
Table 2
Annual change and rate in tibial plateau bone area
Crude analysis Adjusted analysis
Annual change Total P Men Women P
a
Men Women P
b
Increase, mm
2
Medial 36.8 ± 70.7 <0.001 38.3 ± 62.6 35.7 ± 76.1 0.85 70.8 ± 12.3 13.5 ± 9.6 0.002
Lateral 19.1 ± 60.1 0.004 16.5 ± 83.9 20.4 ± 45.1 0.77 17.2 ± 13.3 20.1 ± 8.5 0.87
Change %
Medial 2.2 ± 6.9 <0.001 1.6 ± 2.8 2.6 ± 8.7 0.49 5.4 ± 1.1 0.004 ± 0.9 0.001
Lateral 1.5 ± 4.3 0.004 1.3 ± 5.8 1.6 ± 3.4 0.79 1.6 ± 0.9 1.5 ± 0.6 0.95
Values are mean ± standard deviations, or means ± standard errors for adjusted analysis.
a
Men vs women.
b
Men vs women, adjusted for age,
body mass index, physical activity, grade of osteophytes, grade of joint-space narrowing, and baseline tibial plateau bone area.
Table 3
Factors affecting annual percentage change in tibial plateau bone area
Tibial plateau area factors
a
Univariate analysis Regression
coefficient (95% CI)
P Multivariate analysis
b
Regression
coefficient (95% CI)
P
Medial tibial plateau area
Age -0.10 (-0.23, 0.03) 0.13 -0.07 (-0.18, 0.05) 0.26
Gender 0.94 (-1.78, 3.66) 0.49 -5.42 (-8.67, -2.18) 0.001
BMI 0.43 (0.17, 0.70) 0.002 0.42 (0.16, 0.67) 0.002
Physical activity -0.85 (-1.58, -0.11) 0.02 -0.30 (-1.00, 0.40) 0.40
Grade of medial osteophytes 0.02 (-1.78, 1.83) 0.98 0.27 (-1.53, 2.07) 0.77
Grade of medial JSN 0.35 (-1.10, 1.80) 0.63 1.88 (0.43, 3.33) 0.01
Baseline medial tibial area -0.006 (-0.010, -0.003) <0.001 -0.012 (-0.017, -0.008) <0.001
Lateral tibial plateau area
Age -0.02 (-0.10, 0.07) 0.67 -0.01 (-0.11, 0.08) 0.80
Gender 0.25 (-1.62, 2.12) 0.79 -0.08 (-2.51, 2.36) 0.95
BMI -0.02 (-0.19, 0.15) 0.82 -0.04 (-0.23, 0.16) 0.72
Physical activity -0.05 (-0.57, 0.48) 0.85 -0.16 (-0.74, 0.41) 0.57
Grade of lateral osteophytes -0.63 (-1.68, 0.42) 0.24 -0.18 (-1.70, 1.35) 0.82
Grade of lateral JSN -0.87 (-2.35, 0.61) 0.25 -0.42 (-2.31, 1.48) 0.66
Baseline lateral tibial area -0.003 (-0.007, 0.001) 0.11 -0.002 (-0.008, 0.003) 0.38
a
Factors were defined as follows: age = percentage change per 1-year increase in age; gender = men compared with women; BMI = percentage
change per unit increase in body mass index; physical activity = percentage change per unit increase in physical activity level; grade of
osteophytes = percentage change per increase 1 in grade of osteophytes; grade of JSN=percentage change per increase 1 in grade of joint-
space narrowing; baseline tibial area = percentage change per 1 mm
2
increase in baseline tibial plateau bone area.
b
Includes age, gender, BMI,
physical activity, grade of osteophytes, grade of JSN, and baseline tibial plateau bone area in regression equation. BMI, body mass index; JSN,
joint-space narrowing.
Available online />R691
In univariate analyses, a positive association was found
between BMI and annual percentage increase in medial tibial
plateau area (P = 0.002) (Table 3). There was an inverse asso-
ciation between physical activity (P = 0.02) and baseline
medial tibial plateau area (P < 0.001) and annual percentage
increase in medial tibial plateau area (Table 3).
In multivariate analyses, gender explained 7.6% of the variance
in the annual percentage change in medial tibial bone area;
being male was significantly associated with a higher annual
percentage increase of medial tibial plateau area (P = 0.001),
after adjustment for age, BMI, physical activity, grade of oste-
ophytes, grade of joint-space narrowing, and baseline tibial
plateau bone area (Table 3). In these analyses, BMI explained
7.3% of the variance in annual percentage change in medial
tibial bone area, and grade of medial joint-space narrowing
explained 4.6% of variance in annual percentage change in
medial tibial bone area. BMI and grade of medial joint-space
narrowing were independently and positively associated with
the annual percentage increase of medial tibial plateau area (P
= 0.002 and P = 0.01, respectively). Baseline medial tibial pla-
teau area remained inversely associated with the rate of medial
tibial plateau area increase (P < 0.001) with baseline medial
tibial plateau area explaining 19.3% of the variance in annual
percentage change in medial tibial bone area. However, the
association with physical activity was no longer statistically
significant (P = 0.40). No significant associations were found
between the assessed factors and annual percentage
increase of lateral tibial plateau area in multivariate analyses
(Table 3).
Adjustment for WOMAC score and SF-36 score did not affect
these results (results not shown).
Discussion
In this 2-year longitudinal study, we found that there was a sig-
nificant increase in tibial plateau bone area in symptomatic
subjects with predominantly mild to moderate knee OA. The
rate of increase in medial tibial plateau bone area was greater
in men than in women. Higher BMI and higher baseline grade
of medial joint-space narrowing were positively associated
with an increased rate of enlargement of medial tibial plateau
bone area, while a larger baseline medial tibial plateau bone
area was inversely associated with the rate of increase of that
area. None of the assessed factors were associated with the
rate of increase of lateral tibial plateau bone area.
No previous longitudinal studies have examined the change in
tibial plateau bone area in subjects with knee OA. In this study,
we showed that subjects with symptomatic, mild to moderate
knee OA had a significant increase in medial tibial plateau
bone area over the 2 years of follow-up. In a cross-sectional
study, Jones and colleagues [25] showed that grade 1 medial
osteophytosis was associated with a 10 to 16% increase in
both medial and lateral tibial bone areas after adjustment for
age, sex, and BMI. Similar results have been shown in a study
of hip OA, where men with hip OA had larger femoral neck size
as assessed byMRI than healthy controls matched for age and
sex [26]. In that study, femoral neck size was greater in the hip
with higher OA grade [26]. In this study, we found that increas-
ing grade of medial joint-space narrowing was associated with
an increased rate of medial tibial plateau bone area increase.
However, baseline tibial bone area was inversely associated
with the rate of tibial bone area increase. This suggests that
the rate of increase of tibial plateau bone area may be more
rapid early in knee OA, when the tibial plateau bone area is
smaller, and that as the tibial plateau bone area enlarges, the
rate of increase slows down. All these associations were dem-
onstrated in the medial compartment of tibial plateau, which is
a more common site for knee OA than the lateral compartment
[27]. The causes for the differences between the compart-
ments are unknown.
In general, the factors affecting the change in tibial plateau
bone area over the period of our observations were consistent
with those factors previously described to be associated with
tibial plateau bone size in cross-sectional studies
[23,25,28,29]. However, in most studies tibial bone size has
been measured using different tools [23,25,28-30]. A number
of cross-sectional studies have shown that men have larger
tibial bone size than women as measured by tibial plateau area
[23], bone area at 4% of the tibial length [28], or articular sur-
face area [29]. Although in our longitudinal study we found
that BMI was associated with an increased rate of increase in
tibial plateau bone area, Dacre and colleagues [30] did not
show that BMI was significantly correlated with tibial plateau
width measured on radiographs. These differences may be
attributable to the different measures used for assessing tibial
plateau bone size.
Our measurement of tibial plateau bone area byMRI is aver-
aged on a two-dimensional projection of the tibia. This poten-
tial source of systematic error may become especially
important when individuals of different body size are com-
pared. The measurement has high reproducibility [22-25].
However, small positional changes in the longitudinal study
may have resulted in overestimation of the measurement error
and underestimation of longitudinal change. Our results can-
not be simply explained by positing an increase in tibial bone
size due to the presence of osteophytes, because adjustment
for grade of osteophytes did not alter the findings. Indeed, the
rate of tibial bone expansion was associated with an increased
grade of joint-space narrowing, not of osteophytes. In this
study, we measured only bone size and not bone mineral den-
sity, which may be important in the initiation and progression
of OA [31-33]. It has been well known that normal bone
metabolism depends on the presence of vitamin D. Low intake
and low serum levels of vitamin D have been shown to be
associated with an increased risk for progression of knee OA
[34], or increased incidence of radiographically identified hip
Arthritis Research & Therapy Vol 7 No 3 Wang et al.
R692
OA characterized by joint-space narrowing [35]. However, we
did not take serum levels or intake of vitamin D into account in
this study.
Here we have shown an expansion in medial tibial plateau
bone over 2 years in subjects with mild to moderate knee OA.
Consistent with this finding, previous human studies have
shown changes in density and architecture of the subchondral
bone in established OA [3-7]. Animal models support these
findings [8-13]. In a guinea pig model of OA, trabecular
remodelling was detected deep within the femoral head when
only mild cartilage abnormalities were present [8,9]. In the cru-
ciate-deficient-dog model of OA, by the time the dogs were 3
months old the articular cartilage in the unstable knee showed
both the histologic changes typical of early OA and loss of
trabecular bone [11]. These changes progressed over a
period of 18 to 54 months, with subchondral sclerosis and
increased thickness of the subchondral plate. By then, the
differences in trabecular thickness and in surface-to-volume
ratio were greater than at 3 months [11]. These changes affect
the mechanical properties of the subchondral bone and may
affect the initiation and progression of cartilage degeneration
[5,13,14]. However, at this stage it is unclear which abnormal-
ity occurs first. In addition, factors, such as knee adduction
moment, which have been shown to affect the progression of
knee OA, are also associated with increased medial tibial pla-
teau area [36]. This raises the possibility that changes in tibial
bone size may mediate the effect of biomechanical factors on
the pathogenesis of knee OA. Similarly, it may be that the
effect of obesity on risk of knee OA is mediated via an effect
on tibial bone.
We have previously reported that bone size was an independ-
ent predictor of knee cartilage volume [23]. However, average
tibial plateau bone area was not associated with the rate of tib-
ial cartilage loss [16]. Subjects with knee OA experience a
loss of tibial cartilage volume, independent of tibial bone size,
and an increase of tibial plateau bone area in the knee. This
would tend to result in attenuation of articular cartilage over
time. This may result in biomechanical changes at the knee as
OA progresses, which may further contribute to the pathoge-
netic process. The mechanism for the bone changes is not
known but may be a combination of biomechanical and sys-
temic factors. For example, higher levels of transforming
growth factor β and of insulin-like growth factors 1 and 2 may
provide a 'bone-forming' stimulus in subjects with OA [37-39],
which could explain the larger bone size in OA.
Conclusion
In subjects with established knee OA, tibial plateau bone area
increases over time. The role of subchondral bone change in
the pathogenesis of knee OA will need to be determined but
may be one explanation for the mechanism of action of risk fac-
tors such as BMI on knee OA.
Competing interests
The author(s) declare that they have no competing interests.
Authors' contributions
All authors participated in the design of the study. YW carried
out the measurement of the tibial plateau bone areas, per-
formed the statistical analysis, and drafted the manuscript. AW
and FC reviewed the manuscript. All authors read and
approved the final manuscript.
References
1. Felson DT: Osteoarthritis. Rheum Dis Clin North Am 1990,
16:499-512.
2. Burr DB: The importance of subchondral bone in
osteoarthrosis. Curr Opin Rheumatol 1998, 10:256-262.
3. Matsui H, Shimizu M, Tsuji H: Cartilage and subchondral bone
interaction in osteoarthrosis of human knee joint: a histologi-
cal and histomorphometric study. Microsc Res Tech 1997,
37:333-342.
4. Buckland-Wright C: Subchondral bone changes in hand and
knee osteoarthritis detected by radiography. Osteoarthritis
Cartilage 2004:S10-19.
5. Radin EL, Rose RM: Role of subchondral bone in the initiation
and progression of cartilage damage. Clin Orthop Relat Res
1986, 213:34-40.
6. Grynpas MD, Alpert B, Katz I, Lieberman I, Pritzker KP: Subchon-
dral bone in osteoarthritis. Calcif Tissue Int 1991, 49:20-26.
7. Radin EL, Paul IL, Tolkoff MJ: Subchondral bone changes in
patients with early degenerative joint disease. Arthritis Rheum
1970, 13:400-405.
8. Layton MW, Goldstein SA, Goulet RW, Feldkamp LA, Kubinski DJ,
Bole GG: Examination of subchondral bone architecture in
experimental osteoarthritis by microscopic computed axial
tomography. Arthritis Rheum 1988, 31:1400-1405.
9. Dedrick DK, Goulet R, Huston L, Goldstein SA, Bole GG: Early
bone changes in experimental osteoarthritis using micro-
scopic computed tomography. J Rheumatol Suppl 1991,
27:44-45.
10. Brandt KD, Myers SL, Burr D, Albrecht M: Osteoarthritic changes
in canine articular cartilage, subchondral bone, and synovium
fifty-four months after transection of the anterior cruciate
ligament. Arthritis Rheum 1991, 34:1560-1570.
11. Dedrick DK, Goldstein SA, Brandt KD, O'Connor BL, Goulet RW,
Albrecht M: A longitudinal study of subchondral plate and
trabecular bone in cruciate-deficient dogs with osteoarthritis
followed up for 54 months. Arthritis Rheum 1993,
36:1460-1467.
12. Brown TD, Radin EL, Martin RB, Burr DB: Finite element studies
of some juxtarticular stress changes due to localized
subchondral stiffening. J Biomech 1984, 17:11-24.
13. Hayami T, Pickarski M, Wesolowski GA, McLane J, Bone A, Deste-
fano J, Rodan GA, Duong le T: The role of subchondral bone
remodeling in osteoarthritis: reduction of cartilage degenera-
tion and prevention of osteophyte formation by alendronate in
the rat anterior cruciate ligament transection model. Arthritis
Rheum 2004, 50:1193-1206.
14. Radin EL, Paul IL, Rose RM: Role of mechanical factors in
pathogenesis of primary osteoarthritis. Lancet 1972,
1:519-522.
15. Dieppe P: Subchondral bone should be the main target for the
treatment of pain and disease progression in osteoarthritis.
Osteoarthritis Cartilage 1999, 7:325-326.
16. Wluka AE, Stuckey S, Snaddon J, Cicuttini FM: The determinants
of change in tibial cartilage volume in osteoarthritic knees.
Arthritis Rheum 2002, 46:2065-2072.
17. Altman R, Asch E, Bloch D, Bole G, Borenstein D, Brandt K,
Christy W, Cooke TD, Greenwald R, Hochberg M, et al.: Develop-
ment of criteria for the classification and reporting of osteoar-
thritis. Classification of osteoarthritis of the knee. Diagnostic
and Therapeutic Criteria Committee of the American Rheuma-
tism Association. Arthritis Rheum 1986, 29:1039-1049.
Available online />R693
18. Ware JJ, Snow K, Kosinski M, Grandek B: SF-36. In Health Survey:
Manual and Interpretation Guide Boston: The Health Institute,
New England Medical Center; 1993.
19. Bellamy N, Buchanan WW, Goldsmith CH, Campbell J, Stitt LW:
Validation study of WOMAC: a health status instrument for
measuring clinically important patient relevant outcomes to
antirheumatic drug therapy in patients with osteoarthritis of
the hip or knee. J Rheumatol 1988, 15:1833-1840.
20. Spector TD, Harris PA, Hart DJ, Cicuttini FM, Nandra D, Ethering-
ton J, Wolman RL, Doyle DV: Risk of osteoarthritis associated
with long-term weight-bearing sports: a radiologic survey of
the hips and knees in female ex-athletes and population
controls. Arthritis Rheum 1996, 39:988-995.
21. Altman RD, Hochberg M, Murphy WA Jr, Wolfe F, Lequesne M:
Atlas of individual radiographic features in osteoarthritis. Oste-
oarthritis Cartilage 1995:3-70.
22. Wluka AE, Davis SR, Bailey M, Stuckey SL, Cicuttini FM: Users of
oestrogen replacement therapy have more knee cartilage than
non-users. Ann Rheum Dis 2001, 60:332-336.
23. Cicuttini F, Forbes A, Morris K, Darling S, Bailey M, Stuckey S:
Gender differences in knee cartilage volume as measured by
magnetic resonance imaging. Osteoarthritis Cartilage 1999,
7:265-271.
24. Jones G, Glisson M, Hynes K, Cicuttini F: Sex and site differ-
ences in cartilage development: a possible explanation for
variations in knee osteoarthritis in later life. Arthritis Rheum
2000, 43:2543-2549.
25. Jones G, Ding C, Scott F, Glisson M, Cicuttini F: Early radio-
graphic osteoarthritis is associated with substantial changes
in cartilage volume and tibial bone surface area in both males
and females. Osteoarthritis Cartilage 2004, 12:169-174.
26. Arokoski JP, Arokoski MH, Jurvelin JS, Helminen HJ, Niemitukia LH,
Kroger H: Increased bone mineral content and bone size in the
femoral neck of men with hip osteoarthritis. Ann Rheum Dis
2002, 61:145-150.
27. Ledingham J, Regan M, Jones A, Doherty M: Radiographic pat-
terns and associations of osteoarthritis of the knee in patients
referred to hospital. Ann Rheum Dis 1993, 52:520-526.
28. Russo CR, Lauretani F, Bandinelli S, Bartali B, Di Iorio A, Volpato
S, Guralnik JM, Harris T, Ferrucci L: Aging bone in men and
women: beyond changes in bone mineral density. Osteoporos
Int 2003, 14:531-538.
29. Faber SC, Eckstein F, Lukasz S, Muhlbauer R, Hohe J, Englmeier
KH, Reiser M: Gender differences in knee joint cartilage thick-
ness, volume and articular surface areas: assessment with
quantitative three-dimensional MR imaging. Skeletal Radiol
2001, 30:144-150.
30. Dacre JE, Scott DL, Da Silva JA, Welsh G, Huskisson EC: Joint
space in radiologically normal knees. Br J Rheumatol 1991,
30:426-428.
31. Zhang Y, Hannan MT, Chaisson CE, McAlindon TE, Evans SR,
Aliabadi P, Levy D, Felson DT: Bone mineral density and risk of
incident and progressive radiographic knee osteoarthritis in
women: the Framingham Study. J Rheumatol 2000,
27:1032-1037.
32. Hart DJ, Cronin C, Daniels M, Worthy T, Doyle DV, Spector TD:
The relationship of bone density and fracture to incident and
progressive radiographic osteoarthritis of the knee: the
Chingford Study. Arthritis Rheum 2002, 46:92-99.
33. Bruyere O, Dardenne C, Lejeune E, Zegels B, Pahaut A, Richy F,
Seidel L, Ethgen O, Henrotin Y, Reginster JY: Subchondral tibial
bone mineral density predicts future joint space narrowing at
the medial femoro-tibial compartment in patients with knee
osteoarthritis. Bone 2003, 32:541-545.
34. McAlindon TE, Felson DT, Zhang Y, Hannan MT, Aliabadi P,
Weissman B, Rush D, Wilson PW, Jacques P: Relation of dietary
intake and serum levels of vitamin D to progression of oste-
oarthritis of the knee among participants in the Framingham
Study. Ann Intern Med 1996, 125:353-359.
35. Lane NE, Gore LR, Cummings SR, Hochberg MC, Scott JC, Wil-
liams EN, Nevitt MC: Serum vitamin D levels and incident
changes of radiographic hip osteoarthritis: a longitudinal
study. Study of Osteoporotic Fractures Research Group. Arthri-
tis Rheum 1999, 42:854-860.
36. Jackson BD, Teichtahl AJ, Morris ME, Wluka AE, Davis SR, Cicut-
tini FM: The effect of the knee adduction moment on tibial car-
tilage volume and bone size in healthy women. Rheumatology
(Oxford) 2004, 43:311-314.
37. Uchino M, Izumi T, Tominaga T, Wakita R, Minehara H, Sekiguchi
M, Itoman M: Growth factor expression in the osteophytes of
the human femoral head in osteoarthritis. Clin Orthop Relat
Res 2000, 377:119-125.
38. Pujol JP: TGF-beta and osteoarthritis: in vivo veritas? Osteoar-
thritis Cartilage 1999, 7:439-440.
39. Dequeker J, Mohan S, Finkelman RD, Aerssens J, Baylink DJ: Gen-
eralized osteoarthritis associated with increased insulin-like
growth factor types I and II and transforming growth factor
beta in cortical bone from the iliac crest. Possible mechanism
of increased bone density and protection against
osteoporosis. Arthritis Rheum 1993, 36:1702-1708.