Advanced Control Engineering - Chapter 6 doc
Bạn đang xem bản rút gọn của tài liệu. Xem và tải ngay bản đầy đủ của tài liệu tại đây (341.54 KB, 53 trang )
//SYS21/D:/B&H3B2/ACE/REVISES(08-08-01)/ACEC06.3D ± 145 ± [145±197/53] 9.8.2001 2:31PM
6
Classical design in the
frequency domain
6.1 Frequency domain analysis
Control system design in the frequency domain can be undertaken using a purely
theoretical approach, or alternatively, using measurements taken from the compon-
ents in the control loop. The technique allows transfer functions of both the system
elements and the complete system to be estimated, and a suitable controller/compen-
sator to be designed.
Frequency domain analysis is concerned with the calculation or measurement of
the steady-state system output when responding to a constant amplitude, variable
frequency sinusoidal input. Steady-state errors, in terms of amplitude and phase
relate directly to the dynamic characteristics, i.e. the transfer function, of the system.
Consider a harmonic input
i
(t) A
1
sin !t (6:1)
This can be expressed in complex exponential form
i
(t) A
1
e
j!t
(6:2)
The steady-state response of a linear system will be
o
(t) A
2
sin(!t À )(6:3)
or
o
(t) A
2
e
j(!tÀ)
(6:4)
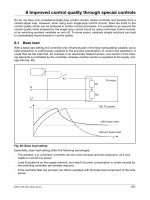
where is the phase relationship between the input and output sinewaves as shown in
Figure 6.1. The amplitude ratio A
2
/A
1
is called the modulus and given the symbol jGj.
Thus
A
2
A
1
jGj (6:5)
or
A
2
A
1
jGj (6:6)
//SYS21/D:/B&H3B2/ACE/REVISES(08-08-01)/ACEC06.3D ± 146 ± [145±197/53] 9.8.2001 2:31PM
Substituting equation (6.6) into (6.3)
o
(t) A
1
jGje
j(!tÀ)
A
1
jGje
j!t
e
Àj
(6:7)
θ
o
()
t
θ
i
()
t
–1.5
–1
–0.5
0
0.5
1
1.5
0 0.1 0.2 0.3 0.4 0.5 0.6 0.7 0.8 0.9 1
θ
i
1
( ) = sin
tA t
ω
A
1
ω
t
(rad)
φ
θωφ
o
sin( – )
t
( )
tA
=
2
A
2
Fig. 6.1 Steady-state input and output sinusoidal response.
Re
Im
P
3
()ω
P
2
ω)
P
1
()ω
||
G
1
||
G
2
||
G
3
–φ
3
–
2
φ
–
1
φ
Fig. 6.2 Harmonic response diagram.
146 Advanced control engineering
//SYS21/D:/B&H3B2/ACE/REVISES(08-08-01)/ACEC06.3D ± 147 ± [145±197/53] 9.8.2001 2:31PM
o
(t) (A
1
e
j!t
)(jGje
Àj
)
i
(t)jGje
Àj'
(6:8)
Since jGj and are functions of !, then equation (6.8) may be written
o
i
(!) jG(!)je
Àj(!)
(6:9)
For a given value of !, equation (6.9) represents a point in complex space P(!). When
! is varied from zero to infinity, a locus will be generated in the complex space. This
locus, shown in Figure 6.2, is in effect a polar plot, and is sometimes called a
harmonic response diagram. An important feature of such a diagram is that its shape
is uniquely related to the dynamic characteristics of the system.
6.2 The complex frequency approach
Relationship between s and j!. From equation (6.2)
i
(t) A
1
e
j!t
d
dt
j!(A
1
e
j!t
) j!
i
(t)
Taking Laplace transforms
s
i
(s) j!
i
(s)(6:10)
or
s j! (6:11)
Hence, for a sinusoidal input, the steady-state system response may be calculated by
substituting s j! into the transfer function and using the laws of complex algebra
to calculate the modulus and phase angle.
6.2.1 Frequency response characteristics of first-order systems
From equation (3.23)
o
i
(s) G(s)
K
1 Ts
(6:12)
For a sinusoidal input, substitute equation (6.11) into (6.12).
o
i
(j!) G(j!)
K
1 j!T
(6:13)
Rationalize, by multiplying numerator and denominator of equation (6.13) by the
conjugate of (6.13), i.e.
G(j!)
K(1 À j!T)
(1 j!T)(1 À j!T)
K(1 À j!T)
1 !
2
T
2
(6:14)
Classical design in the frequency domain 147
//SYS21/D:/B&H3B2/ACE/REVISES(08-08-01)/ACEC06.3D ± 148 ± [145±197/53] 9.8.2001 2:31PM
Equation (6.14) is a complex quantity of the form a jb where
Real part a
K
1 !
2
T
2
(6:15)
Imaginary part b
ÀK!T
1 !
2
T
2
(6:16)
Hence equation (6.14) can be plotted in the complex space (Argand Diagram) to
produce a harmonic response diagram as shown in Figure 6.3.
In Figure 6.3 it is convenient to use polar co-ordinates, as they are the modulus and
phase angle as depicted in Figure 6.2. From Figure 6.3, the polar co-ordinates are
jG(j!)j
a
2
b
2
p
K
1 !
2
T
2
2
ÀK!T
1 !
2
T
2
2
s
(6:17)
which simplifies to give
jG(j!)j
K
1 !
2
T
2
p
(6:18)
Comparing equations (6.14) and (6.18), providing there are no zeros in the transfer
function, it is generally true to say
jG(j!)j
K
Denominator of G(j!)
p
(6:19)
K
a
=
1 ω
22
T
+
1
ω
22
T
+
–
K
ω
T
b
=
G
(j )ω
||ω)
G
(j
G
(jω)
Re
Im
∠
Fig. 6.3 A point in complex space for a first-order system.
148 Advanced control engineering
//SYS21/D:/B&H3B2/ACE/REVISES(08-08-01)/ACEC06.3D ± 149 ± [145±197/53] 9.8.2001 2:31PM
The argument, or phase angle is
G(j!) tan
À1
b
a
(6:20)
tan
À1
ÀK!T
1 !
2
T
2
K
1 !
2
T
2
@A
which gives
G(j!) tan
À1
À!T (6:21)
K
Re
Im
–45°
0.707
K
(a) Polar Plot
(c)
(b) Rectangular Plot (Frequency Response)
(degrees)
0
– 45
– 90
∠
G
(j )ω
K
0.707
K
ω (rad/s) ω (rad/s)
l
T
l
T
l
T
ω =0
ω = ∞
ω =
G
(j )ω
Fig. 6.4 Graphical display of frequency domain data for a first-order system.
Table 6.1 Modulus and phase for a first-order system
! (rad/s) jG(j!)jG(j!) (degrees)
0 K À0
1/TK/
p
2 À45
I 0 À90
Classical design in the frequency domain 149
//SYS21/D:/B&H3B2/ACE/REVISES(08-08-01)/ACEC06.3D ± 150 ± [145±197/53] 9.8.2001 2:31PM
Using equations (6.18) and (6.21), values for the modulus and phase angle may be
calculated as shown in Table 6.1. The results in Table 6.1 may be represented as a
Polar Plot, Figure 6.4(a) or as a rectangular plot, Figures 6.4(b) and (c). Since the
rectangular plots show the system response as a function of frequency, they are
usually referred to as frequency response diagrams.
6.2.2 Frequency response characteristics of second-order
systems
From equation (3.42) the standard form of transfer function for a second-order
system is
G(s)
K
1
!
2
n
s
2
2
!
n
s 1
(6:22)
Substituting s j!
G(j!)
K
1
!
2
n
(j!)
2
2
!
n
(j!) 1
(6:23)
or
G( j!)
K
1 À
!
!
n
2
&'
j2
!
!
n
no
(6:24)
Rationalizing gives
G(j!)
K 1 À
!
!
n
2
&'
À j2
!
!
n
no
!
1 À
!
!
n
2
&'
2
2
!
!
n
no
2
(6:25)
Using equations (6.17) and (6.19), the modulus is
jG(j!)j
K
1 À
!
!
n
2
&'
2
2 p
!
!
n
no
2
s
(6:26)
And from equation (6.20), the argument is
G(j!) tan
À1
À2
!
!
n
1 À
!
!
n
2
V
b
`
b
X
W
b
a
b
Y
(6:27)
Table 6.2 Modulus and phase for a second-order system
! (rad/s) jG(j!)jG(j!) (degrees)
0 K À0
!
n
K/2 À90
I 0 À180
150 Advanced control engineering
//SYS21/D:/B&H3B2/ACE/REVISES(08-08-01)/ACEC06.3D ± 151 ± [145±197/53] 9.8.2001 2:31PM
From equations (6.26) and (6.27) the modulus and phase may be calculated as shown
in Table 6.2. The results in Table 6.2 are a function of and may be represented as a
Polar Plot, Figure 6.5, or by the frequency response diagrams given in Figure 6.6.
6.3 The Bode diagram
The Bode diagram is a logarithmic version of the frequency response diagrams
illustrated in Figures 6.4(b) and (c), and also Figure 6.6, and consists of
(i) a log modus±log frequency plot
(ii) a linear phase±log frequency plot.
The technique uses asymptotes to quickly construct frequency response diagrams by
hand. The construction of diagrams for high-order systems is achieved by simple
graphical addition of the individual diagrams of the separate elements in the system.
The modulus is plotted on a linear y-axis scale in deciBels, where
jG(j!)jdB 20 log
10
jG(j!)j (6:28)
The frequency is plotted on a logarithmic x-axis scale.
Re
Im
K
ω =
n
ω
ωω
=
n
ωω=
n
ζ = 1
ω = 0
ζ = 0.5
ζ = 0.5
0.5
K
2
K
K
Fig. 6.5 Polar plot of a second-order system.
Classical design in the frequency domain 151
//SYS21/D:/B&H3B2/ACE/REVISES(08-08-01)/ACEC06.3D ± 152 ± [145±197/53] 9.8.2001 2:31PM
6.3.1 Summation of system elements on a Bode diagram
Consider two elements in cascade as shown in Figure 6.7.
G
1
(j!) jG
1
(j!)je
j
1
(6:29)
G
2
(j!) jG
2
(j!)je
j
2
(6:30)
G
(j )ω
2.5
2
K
K
0.5
K
0.5
2
1.5
1
0
–20
–40
–60
–80
–100
–120
–140
–160
–180
0
0
0 0.2 0.4 0.6 0.8 1 1.2 1.4 1.6 1.8 2
0.2 0.4 0.6 0.8 1 1.2 1.4 1.6 1.8 2
ω (rad/s)
ω(rad/s)
(a) Modulus
(
b
)
Phase
ω
n
ω
n
ζ = 0.5
ζ = 1.0
ζ = 1.0
(degrees)
∠
G
(j )ω
ζ = 0.25
ζ = 0.25
ζ = 0.5
Fig. 6.6 Frequency response diagrams for a second-order system.
152 Advanced control engineering
//SYS21/D:/B&H3B2/ACE/REVISES(08-08-01)/ACEC06.3D ± 153 ± [145±197/53] 9.8.2001 2:31PM
C
R
(j!) G
1
(j!)G
2
(j!)
jG
1
(j!)kG
2
(j!)je
j(
1
2
)
(6:31)
Hence
C
R
(j!)
jG
1
(j!)kG
2
(j!)j
or
C
R
(j!)
dB 20 log
10
jG
1
(j!)j20 log
10
jG
2
(j!)j (6:32)
and
C
R
(j!)
1
2
G
1
(j!) G
2
(j!)(6:33)
In general, the complete system frequency response is obtained by summation of the
log modulus of the system elements, and also summation of the phase of the system
elements.
6.3.2 Asymptotic approximation on Bode diagrams
(a) First-order lag systems
These are conventional first-order systems where the phase of the output lags behind
the phase of the input.
(i) Log modulus plot: This consists of a low-frequency asymptote and a high-
frequency asymptote, which are obtained from equation (6.18).
Low frequency (LF) asymptote: When ! 3 0, jG(j!)j3K. Hence the LF
asymptote is a horizontal line at K dB.
High frequency (HF) asymptote: When ! ) 1/T, equation (6.18) approximates
to
jG(j!)j
K
!T
(6:34)
As can be seen from equation (6.34), each time the frequency doubles (an increase of
one octave) the modulus halves, or falls by 6 dB. Or alternatively, each time the
frequency increases by a factor of 10 (decade), the modulus falls by 10, or 20 dB.
Hence the HF asymptote for a first-order system has a slope which can be expressed
as À6 dB per octave, or À20 dB per decade.
R
(j )ω
G
1
(j )ω
G
2
(j )ω
C
(j )ω
Fig. 6.7 Summation of two elements in cascade.
Classical design in the frequency domain 153
//SYS21/D:/B&H3B2/ACE/REVISES(08-08-01)/ACEC06.3D ± 154 ± [145±197/53] 9.8.2001 2:31PM
From equation (6.34), when ! 1/T, the HF asymptote has a value of K. Hence
the asymptotes intersect at ! 1/T rad/s. Also at this frequency, from equation
(6.18) the exact modulus has a value
jG(j!)j
K
2
p
Since 1/
p
2isÀ3 dB, the exact modulus passes 3 dB below the asymptote intersection
at 1/T rad/s. The asymptotic construction of the log modulus Bode plot for a first-
order system is shown in Figure 6.8.
K
||ω)
G
(j
dB
log
ω
HF Asymptote
–6 dB/octave
(–20 dB/decade)
LF Asymptote
3dB
1
T
Fig. 6.8 Bode modulus construction for a first-order system.
–90
–45
10
T
0
∠ )
G
(jω
(degrees)
log
ω
1
T
HF Asymptote
LF Asymptote
1
10
T
MF Asymptote
Fig. 6.9 Bode phase construction for a first-order system.
154 Advanced control engineering
//SYS21/D:/B&H3B2/ACE/REVISES(08-08-01)/ACEC06.3D ± 155 ± [145±197/53] 9.8.2001 2:31PM
(ii) Phase plot: This has three asymptotes
.
A LF horizontal asymptote at 0
.
A HF horizontal asymptote at À90
.
A Mid-Frequency (MF) asymptote that intersects the LF asymptote at 1/10T
and the HF asymptote at 10/T (i.e. a decade either side of 1/T ).
The Bode phase plot for a first-order system is given in Figure 6.9.
(b) First-order lead systems
These are first-order systems where the phase of the output (in steady-state) leads the
phase of the input. The transfer function of a first-order lead system is
G(s) K(1 Ts)(6:35)
and
jG(j!)jK
1 !
2
T
2
p
(6:36)
G(j!) tan
À1
(!T)(6:37)
The Bode diagram, given in Figure 6.10, is the mirror image, about the frequency
axis, of the first-order lag system. Note that the transfer function given in equation
(6.35) is also that of a PD controller.
(c) Second-order systems
(i) Log modulus plot
LF asymptote: A horizontal line at K dB
HF asymptote: When ! ) !
n
, equation (6.26) approximates to
jG(j!)j
K
!
!
n
2
(6:38)
From equation (6.38), an octave increase in frequency will reduce the modulus by
a quarter, or À12 dB and a decade frequency increase will reduce the modulus
by a factor of 100, or À40 dB. Hence the HF asymptote for a second-order system
has a slope of À12 dB/octave or À40 dB/decade. The LF and HF asymptotes inter-
sect at ! !
n
. Also at !
n
, the exact value of modulus from equation (6.26) is
jG(j!)j
K
2
The value of the modulus relative to the LF asymptote is
jG(j!)jdB 20 log
10
K=2
K
20 log
10
1
2
(6:39)
Classical design in the frequency domain 155
//SYS21/D:/B&H3B2/ACE/REVISES(08-08-01)/ACEC06.3D ± 156 ± [145±197/53] 9.8.2001 2:31PM
Hence
0:25, Relative modulus 6dB
0:5, Relative modulus 0dB
1:0, Relative modulus À6dB
(ii) Phase plot: This has two asymptotes:
.
A LF horizontal asymptote at 0
.
A HF horizontal asymptote at À180
.
The phase curve passes through À90
at ! !
n
. Its shape depends upon and is
obtained from the standard curves given in Figure 6.11.
(degrees)
90
45
0
K
||ω)
G
(j
dB
log
ω
1
T
Slope = +6 dB/octave
(+20 dB/decade)
3dB
(a) Log modulus
(b) Phase
∠
ω)
G
(j
1
T
log ω
Fig. 6.10 Bode gain and phase for a first-order lead system.
156 Advanced control engineering
//SYS21/D:/B&H3B2/ACE/REVISES(08-08-01)/ACEC06.3D ± 157 ± [145±197/53] 9.8.2001 2:31PM
|(j)
G
ω |
dB
10
0
–10
–20
–30
–40
10
–1
10
0
(a) Log modulus
10
1
ω
ζ
= 0.1
ζ = 0.2
ζ = 0.4
ω
n
–50
ζ = 0.6
ζ = 0.8
ζ = 1.0
ζ = 1.5
ζ = 2.0
(degrees)
∠
G
(j )ω
0
–50
–100
–150
–200
10
–1
10
0
(b) Phase
10
1
ω
ω
n
ζ= 1.5
ζ= 0.1
ζ= 0.2
ζ= 0.4
ζ= 0.6
ζ= 0.8
ζ= 2.0
ζ= 1.0
Fig. 6.11 Bode gain and phase for a second-order system.
Classical design in the frequency domain 157
//SYS21/D:/B&H3B2/ACE/REVISES(08-08-01)/ACEC06.3D ± 158 ± [145±197/53] 9.8.2001 2:31PM
(d) A pure integrator
Consider a pure integrator of the form
G(s)
K
s
(6:40)
now
G(j!)
K
0 j!
Rationalizing
G(j!)
K(0 À j!)
!
2
(6:41)
From equation (6.17)
jG(j!)j
0
K
2
!
2
!
4
r
K
!
(6:42)
and from equation (6.20)
G(j!) tan
À1
ÀK!=!
2
0
tan
À1
(ÀI) À90
(6:43)
It can be seen from equation (6.42) that the modulus will halve in value each time the
frequency is doubled, i.e. it has a slope of À 6 dB/octave (À20 dB/decade) over the
complete frequency range.
Note that
jG(j!)jK dB when ! 1
jG(j!)j1 0 dB when ! K
The Bode diagram for a pure integrator is shown in Figure 6.12.
dB
K
0
1.0
K
(degrees)
–90
0
log
ω
||ω)
G
(j
∠ ω)
G
(j
log ω
–6 dB/octave
(–20 dB/decade)
Fig. 6.12 Bode diagram for a pure integrator.
158 Advanced control engineering
//SYS21/D:/B&H3B2/ACE/REVISES(08-08-01)/ACEC06.3D ± 159 ± [145±197/53] 9.8.2001 2:31PM
Example 6.1 (See also Appendix 1, examp61.m)
Construct, using asymptotes, the Bode diagram for
G(s)
2
1 0:5s
(6:44)
Low Frequency asymptote is a horizontal line at K dB,
i:e: 6dB
Asymptote intersection (break frequency) occurs at 1/T, i.e. 2 rad/s. The Bode
diagram is shown in Figure 6.13.
|(j)
G
ω |
dB
10
5
0
–5
–10
–15
–20
–25
–30
10
–1
10
0
2
(a) Bode Gain
10
1
10
2
ω (rad/s)
10
–1
10
0
2
(b) Bode Phase
10
1
10
2
ω (rad/s)
0
–20
–40
–60
–80
–100
(degrees)
∠
G
(j )ω
– 6 dB/octave
Fig. 6.13 Bode diagram for G(s) 2/1 0:5s.
Classical design in the frequency domain 159
//SYS21/D:/B&H3B2/ACE/REVISES(08-08-01)/ACEC06.3D ± 160 ± [145±197/53] 9.8.2001 2:31PM
Example 6.2 (See also Appendix 1, examp62.m)
Draw the Bode diagram for
G(s)
4
0:25s
2
0:2s 1
(6:45)
|(j)
G
ω |
dB
40
20
12
0
–20
–40
–60
10
–1
10
0
2
(a) Bode Gain
10
1
10
2
ω (rad/s)
10
–1
10
0
2
(b) Bode Phase
10
1
10
2
ω (rad/s)
0
–50
–100
–150
–200
(degrees)
∠G(j )ω
–12 dB/octave
8dB
Fig. 6.14 Bode diagram for a second-order system, K 4, !
n
2, 0:2.
160 Advanced control engineering
//SYS21/D:/B&H3B2/ACE/REVISES(08-08-01)/ACEC06.3D ± 161 ± [145±197/53] 9.8.2001 2:31PM
Comparing equation (6.45) with the standard form given in (6.22)
1
!
2
n
0:25
i:e:!
n
2 rad/s
2
!
n
0:2
i:e: 0:2
Low Frequency asymptote is a horizontal line at K dB
i:e: 20 log
10
(4) 12 dB
The log modulus relative to the LF asymptote at ! !
n
is given by equation (6.39)
jG(j!)j
!
n
20 log
10
1
0:4
8dB
(Hence the absolute log modulus at ! !
n
is 20 dB). The Bode diagram is given by
Figure 6.14. Note in Figure 6.14 that the phase curve was constructed by reading the
phase from Figure 6.11(b), an octave either side of !
n
.
Example 6.3
Construct, on log-linear graph paper, using asymptotes, and validate using
MATLAB or a similar tool, the Bode diagrams for
(a) G(s)
4
s(1 2s)
(b) G(s)
1
(1 0:5s)(1 4s)
(c) G(s)
10(1 s)
(1 0:2s)(1 5s)
(d) G(s)
100
s(0:25s
2
0:1s 1)
6.4 Stability in the frequency domain
6.4.1 Conformal mapping and Cauchy's theorem
In Chapter 5 the stability of linear control systems were considered in the s-plane.
Using a process of conformal transformation or mapping, it is possible to map a
contour from one complex plane to another. It is therefore possible to transfer
stability information from the s-plane to another complex plane, the F(s)-plane.
The relationship between the contours in the two complex planes is given by
Cauchy's theorem, which states: `For a given contour in the s-plane that encircles
P poles and Z zeros of the function F(s) in a clockwise direction, the resulting
Classical design in the frequency domain 161
//SYS21/D:/B&H3B2/ACE/REVISES(08-08-01)/ACEC06.3D ± 162 ± [145±197/53] 9.8.2001 2:31PM
contour in the F(s)-plane encircles the origin a total of N times in a clockwise
direction'.
Where
N Z À P (6:46)
Consider a function
F(s)
(s z
1
)(s z
2
)
(s p
1
)(s p
2
)
(6:47)
where z
1
and z
2
are zeros of F(s)andp
1
and p
2
are poles. Equation (6.47) can be
written as
F(s) jF(s)jF (s)
The mapping of a contour from the s-plane to the F(s)-plane is shown in Figure 6.15.
From Figure 6.15
jF(s)j
jajjbj
jcjjdj
(6:48)
and
F(s)
z1
z2
À
p1
À
p2
(6:49)
As s
1
in Figure 6.15(a) is swept clockwise around the contour, it encircles two zeros
and one pole. From Cauchy's theorem given in equation (6.46), the number of
clockwise encirclements of the origin in Figure 6.15(b) is
N 2 À1 1(6:50)
6.4.2 The Nyquist stability criterion
A frequency domain stability criterion developed by Nyquist (1932) is based upon
Cauchy's theorem. If the function F(s) is in fact the characteristic equation of a
closed-loop control system, then
jω
φ
z
1
φ
z
2
φ
p
1
σ
φ
p
2
d
a
c
(a) plane
s-
(b) ( )-plane
Fs
Im
s
1
Fs
()
b
s
1
∠
Fs
()
Re
Fig. 6.15 Mapping of a contour from the s-plane to the F(s)-plane.
162 Advanced control engineering
//SYS21/D:/B&H3B2/ACE/REVISES(08-08-01)/ACEC06.3D ± 163 ± [145±197/53] 9.8.2001 2:31PM
F(s) 1 G(s)H(s)(6:51)
Note that the roots of the characteristic equation are the closed-loop poles, which are
the zeros of F(s).
In order to encircle any poles or zeros of F(s) that lie in the right-hand side of the
s-plane, a Nyquist contour is constructed as shown in Figure 6.16. To avoid poles at
the origin, a small semicircle of radius ", where " 3 0, is included.
Figure 6.17(a) shows the 1 G(s)H(s) plane when Z À P 2, i.e. two clockwise
encirclements. However, if the contour is plotted in G(s)H(s) plane as shown in
Figure 6.17(b), then it moves one unit to the left, i.e. encircles the À1 point.
σ
r
→
∞
ε
+jω
–jω
Fig. 6.16 s-plane Nyquist contour.
Im
Re
Re
Im
(a) 1 + ( ) ( ) plane
GsHs
(b) ( ) ( ) plane
GsHs
ω= –∞
ω ∞=
(–1, j0)
ω 0=
ω 0=
Fig. 6.17 Contours in the 1 G(s)H(s) and G(s)H(s) planes.
Classical design in the frequency domain 163
//SYS21/D:/B&H3B2/ACE/REVISES(08-08-01)/ACEC06.3D ± 164 ± [145±197/53] 9.8.2001 2:31PM
The Nyquist stability criterion can be stated as: `A closed-loop control system is
stable if, and only if, a contour in the G(s)H(s) plane describes a number of counter-
clockwise encirclements of the (À1, j0) point, the number of encirclements being
equal to the number of poles of G(s)H(s) with positive real parts'.
Hence, because there is a net clockwise encirclement of the (À1, j0) point in Figure
6.17(b) the system is unstable. If, however, there had been a net counter-clockwise
encirclement, the system would have been stable, and the number of encirclements
would have been equal to the number of poles of G(s)H(s) with positive real parts.
For the condition P 0, the Nyquist criterion is: `A closed-loop control system is
stable if, and only if, a contour in the G(s)H(s) plane does not encircle the (À1, j0)
point when the number of poles of G(s)H(s) in the right-hand s-plane is zero'.
In practice, only the frequencies ! 0toI are of interest and since in the
frequency domain s j!, a simplified Nyquist stability criterion, as shown in Figure
6.18 is: `A closed-loop system is stable if, and only if, the locus of the G(j!)H(j!)
function does not enclose the (À1, j0) point as ! is varied from zero to infinity.
Enclosing the (À1, j0) point may be interpreted as passing to the left of the point'.
The G(j!)H(j!) locus is referred to as the Nyquist Diagram.
An important difference between analysis of stability in the s-plane and stability in
the frequency domain is that, in the former, system models in the form of transfer
functions need to be known. In the latter, however, either models or a set of
input±output measured open-loop frequency response data from an unknown system
may be employed.
Margins of stability
The closer the open-loop frequency response locus G(j!)H(j!) is to the (À1, j0)
point, the nearer the closed-loop system is to instability. In practice, all control
Re
Im
(–1, j0)
Stable
Unstable
GH
(j ) (j ) planeωω
ω
=0
ω = ∞
Fig. 6.18 Nyquist diagram showing stable and unstable contours.
164 Advanced control engineering
//SYS21/D:/B&H3B2/ACE/REVISES(08-08-01)/ACEC06.3D ± 165 ± [145±197/53] 9.8.2001 2:31PM
systems possess a Margin of Stability, generally referred to as gain and phase
margins. These are shown in Figure 6.19.
Gain Margin (GM): The gain margin is the increase in open-loop gain required
when the open-loop phase is À180
to make the closed-loop system just unstable.
Nyquist diagram
GM
1
jG(j!)H(j!)j
180
(6:52)
Bode diagram
GM 20 log
10
1
jG(j!)H(j!)j
180
&'
(6:53)
Phase Margin (PM): The phase margin is the change in open-loop phase, required
when the open-loop modulus is unity, (or 0 dB on the Bode diagram) to make the
closed-loop system just unstable.
Phase Margin 180 ÀG(j!)H(j!)(mod 1) (6:54)
Re
Unit circle
PM
1
GM
Im
(–1, j0)
Fig. 6.19 Gain margin (GM) and phase margin (PM) on the Nyquist diagram.
Classical design in the frequency domain 165
//SYS21/D:/B&H3B2/ACE/REVISES(08-08-01)/ACEC06.3D ± 166 ± [145±197/53] 9.8.2001 2:31PM
Example 6.4 (See also Appendix 1, examp64.m)
Construct the Nyquist diagram for the control system shown in Figure 6.20 and find
the controller gain K
1
that
(a) makes the system just unstable. (Confirm using the Routh stability criterion)
(b) gives the system a gain margin of 2 (6 dB). What is now the phase margin?
Solution
Open-loop transfer function
G(s)H(s)
K
s(s
2
2s 4)
(6:55)
where
K 4K
1
(6:56)
G(s)H(s)
K
s
3
2s
2
4s
G(j!)H(j!)
K
(j!)
3
2( j!)
2
4j!
K
À2!
2
j(4! À !
3
)
Rationalizing
G(j!)H(j!)
KfÀ2!
2
À j(4! À!
3
)g
4!
4
(4! À!
3
)
2
(6:57)
From equation (6.19)
jG(j!)H(j!)j
K
4!
4
(4! À!
3
)
2
q
(6:58)
From equation (6.20)
G(j!)H(j!) tan
À1
À(4! À !
3
)
À2!
2
&'
tan
À1
4 À !
2
2!
(6:59)
Rs
()
Cs
()
Controller Plant
K
1
ss s
(+2+4)
2
4
+
–
Fig. 6.20 Closed-loop control system.
166 Advanced control engineering
//SYS21/D:/B&H3B2/ACE/REVISES(08-08-01)/ACEC06.3D ± 167 ± [145±197/53] 9.8.2001 2:31PM
The Nyquist diagram is constructed, for K 1, at frequencies either side of the 180
point, which, from equation (6.59) can be seen to be ! 2 rad/s. Using equations
(6.58) and (6.59), Table 6.3 may be evaluated.
(a) From equation (6.52)
GM 1/0:125 8
Value of K to make system just unstable
K
unstab
K Á GM
1 Â8 8
From equation (6.56)
K
1
for instability 2
(b) For a GM of 2, the locus must pass through the (À0:5, j0) point in Figure 6.21.
This can be done by multiplying all the modulus values in Table 6.3 by four and
re-drawing Figure 6.21. Alternatively, the scales of Figure 6.21 can be multiplied
by a factor of four (without re-drawing). Hence the unit circle is 0:25 Â4 and the
PM can be seen to have a value of 50
when the GM is 2.0.
Value of K to give a GM of 2 is the original K times 4, i.e. 1 Â 4 4. From (6.56)
K
1
1:0
Hence, to give a GM of 2 and a PM of 50
, the controller gain must be set at 1.0. If it
is doubled, i.e. multiplied by the GM, then the system just becomes unstable. Check
using the Routh stability criterion:
Characteristic equation
1
K
s(s
2
2s 4)
0(6:60)
s
3
2s
2
4s K 0(6:61)
Routh's array
j
s
0
K
s
1
1
2
(8 À K)
s
2
2 K
s
3
14
À
Thus when K ! 8 then the system is unstable.
Table 6.3 Data for Nyquist diagram for system in Figure 6.20
! (rad/s) 0.5 1.0 1.5 2.0 2.5 3.0 4.0 5.0
jG( j!)H( j!)j(K 1) 0.515 0.278 0.191 0.125 0.073 0.043 0.018 0.0085
G( j!)H( j!) (deg) À105 À124 À150 À180 À204 À220 À236 À245
Classical design in the frequency domain 167
//SYS21/D:/B&H3B2/ACE/REVISES(08-08-01)/ACEC06.3D ± 168 ± [145±197/53] 9.8.2001 2:31PM
System type classification
Closed-loop control systems are classified according to the number of pure integra-
tions in the open-loop transfer function. If
G(s)H(s)
K
m
i1
(s z
i
)
s
n
q
k1
(s p
k
)
(6:62)
Then n in equation (6.62) is the `type number' of the system and
denotes the
product of the factors. The system `type' can be observed from the starting point
(! 3 0) of the Nyquist diagram, and the system order from the finishing point
(! 3I), see Figure 6.22.
System `type' and steady-state errors
From the final value theorem given in equation (3.10) it is possible to define a set of
steady-state error coefficients.
1. Position error coefficient
K
p
lim
s30
G(s)
New scale
Original scale
–
0.6 –0.5 –0.4 –0.3
–1–1
–0.2 –0.1 0
0
Im
Unit circle
on new
scale
Re
0.1
ω = 2.5
ω = 2.0
ω = 1.5
ω = 1.0
ω = 0.5
–0.1
–0.2
–0.3
–0.4
–0.5
–0.6
0.1
PM=50°
Fig. 6.21 Nyquist diagram for system in Figure 6.20.
168 Advanced control engineering
//SYS21/D:/B&H3B2/ACE/REVISES(08-08-01)/ACEC06.3D ± 169 ± [145±197/53] 9.8.2001 2:31PM
For a step input,
e
ss
1
1 K
p
(6:63)
2. Velocity error coefficient
K
v
lim
s30
sG(s)
For a ramp input,
e
ss
1
K
v
(6:64)
3. Acceleration error coefficient
K
a
lim
s30
s
2
G(s)
For a parabolic input,
e
ss
1
K
a
(6:65)
(c) Third-order type two system
Re
Im
(a) First-order type zero system
(b) Second-order type one system
Im
Re
GsHs
K
() ()=
(1+ )
sTs
GsHs
K
() ()=
(1+ )
Ts
Re
Im
GsHs
K
() ()=
(1+ )
sTs
2
Fig. 6.22 Relationship between system type classification and the Nyquist diagram.
Classical design in the frequency domain 169