Báo cáo y học: "B lymphocyte stimulator (BLyS) isoforms in systemic lupus erythematosus: disease activity correlates better with blood leukocyte BLyS mRNA levels than with plasma BLyS protein levels" ppsx
Bạn đang xem bản rút gọn của tài liệu. Xem và tải ngay bản đầy đủ của tài liệu tại đây (1.03 MB, 12 trang )
Open Access
Available online />Page 1 of 12
(page number not for citation purposes)
Vol 8 No 1
Research article
B lymphocyte stimulator (BLyS) isoforms in systemic lupus
erythematosus: disease activity correlates better with blood
leukocyte BLyS mRNA levels than with plasma BLyS protein levels
Christopher E Collins
1
*, Amanda L Gavin
2
*, Thi-Sau Migone
3
, David M Hilbert
3
, David Nemazee
2
and William Stohl
1
1
Division of Rheumatology, Department of Medicine, Los Angeles County + University of Southern California Medical Center, and University of
Southern California Keck School of Medicine, 2011 Zonal Avenue, Los Angeles, CA 90033, USA
2
Department of Immunology, Scripps Research Institute, 10550 North Torrey Pines Road, La Jolla, CA 92037, USA
3
Human Genome Sciences, Inc., 14200 Shady Grove Road, Rockville, MD 20850, USA
* Contributed equally
Corresponding author: William Stohl,
Received: 10 Aug 2005 Revisions requested: 7 Sep 2005 Revisions received: 23 Sep 2005 Accepted: 20 Oct 2005 Published: 15 Nov 2005
Arthritis Research & Therapy 2006, 8:R6 (doi:10.1186/ar1855)
This article is online at: />© 2005 Collins et al.; licensee BioMed Central Ltd.
This is an open access article distributed under the terms of the Creative Commons Attribution License ( />),
which permits unrestricted use, distribution, and reproduction in any medium, provided the original work is properly cited.
Abstract
Considerable evidence points to a role for B lymphocyte
stimulator (BLyS) overproduction in murine and human systemic
lupus erythematosus (SLE). Nevertheless, the correlation
between circulating levels of BLyS protein and disease activity
in human SLE is modest at best. This may be due to an
inadequacy of the former to reflect endogenous BLyS
overproduction faithfully, in that steady-state protein levels are
affected not just by production rates but also by rates of
peripheral utilization and excretion. Increased levels of BLyS
mRNA may better reflect increased in vivo BLyS production,
and therefore they may correlate better with biologic and clinical
sequelae of BLyS overexpression than do circulating levels of
BLyS protein. Accordingly, we assessed peripheral blood
leukocyte levels of BLyS mRNA isoforms (full-length BLyS and
∆BLyS) and plasma BLyS protein levels in patients with SLE,
and correlated these levels with laboratory and clinical features.
BLyS protein, full-length BLyS mRNA, and ∆BLyS mRNA levels
were greater in SLE patients (n = 60) than in rheumatoid arthritis
patients (n = 60) or normal control individuals (n = 30). Although
full-length BLyS and ∆BLyS mRNA levels correlated
significantly with BLyS protein levels in the SLE cohort, BLyS
mRNA levels were more closely associated with serum
immunoglobulin levels and SLE Disease Activity Index scores
than were BLyS protein levels. Moreover, changes in SLE
Disease Activity Index scores were more closely associated with
changes in BLyS mRNA levels than with changes in BLyS
protein levels among the 37 SLE patients from whom repeat
blood samples were obtained. Thus, full-length BLyS and
∆BLyS mRNA levels are elevated in SLE and are more closely
associated with disease activity than are BLyS protein levels.
BLyS mRNA levels may be a helpful biomarker in the clinical
monitoring of SLE patients.
Introduction
B lymphocyte stimulator (BLyS; a trademark of Human
Genome Sciences, Inc., Rockville, MD, USA) is a 285-amino-
acid member of the tumor necrosis factor ligand superfamily
[1-3]. A causal relation between constitutive overproduction of
BLyS and development of systemic lupus erythematosus
(SLE)-like illness has incontrovertibly been established in
mice. BLyS-transgenic mice often develop SLE-like features
as they age [3-5], and SLE-prone (NZB × NZW)F
1
(BWF
1
)
and MRL-lpr/lpr mice respond clinically to treatment with BLyS
antagonists (decreased disease progression and improved
survival) [3,6].
Considerable inferential evidence points to a role for BLyS
overproduction in human SLE as well. Cross-sectional studies
have demonstrated elevated circulating levels of BLyS in 20–
anti-dsDNA = anti-double-stranded DNA; BLyS = B lymphocyte stimulator; bp = base pairs; Ct = threshold cycle; ELISA = enzyme-linked immuno-
sorbent assay; PCR = polymerase chain reaction; RA = rheumatoid arthritis; SLE = systemic lupus erythematosus; SLEDAI = SLE Disease Activity
Index.
Arthritis Research & Therapy Vol 8 No 1 Collins et al.
Page 2 of 12
(page number not for citation purposes)
30% of human SLE patients tested at a single point in time
[7,8]. Moreover, a 12-month longitudinal study documented
persistently elevated serum BLyS levels in about 25% of SLE
patients and intermittently elevated serum BLyS levels in an
additional 25% of patients [9]. Remarkably, circulating BLyS
levels did not correlate with disease activity (measured using
the SLE Disease Activity Index [SLEDAI]) in these cross-sec-
tional or longitudinal studies [7-9]. Although a statistically sig-
nificant correlation between circulating BLyS levels and
SLEDAI has been appreciated in a more recent 24-month lon-
gitudinal study of 245 SLE patients (with >1,700 plasma sam-
ples analyzed) [10], the correlation remains weak.
The limited correlation between circulating BLyS protein levels
and disease activity in these studies may have exposed an
inadequacy of the former to reflect faithfully endogenous BLyS
overproduction. In addition to the rate of BLyS protein produc-
tion, several other factors (for example, utilization and excre-
tion) can affect circulating BLyS protein levels. Although there
are no practicable means of directly measuring in vivo BLyS
production per se in humans, the level of BLyS mRNA may
serve as a better surrogate marker of in vivo BLyS production
than does the level of BLyS protein. Candidate BLyS mRNA
isoforms include the full-length BLyS mRNA isoform, which
encodes the full-length protein, and the alternatively spliced
∆BLyS mRNA isoform, which encodes a protein with a small
peptide deletion [11]. (∆BLyS does not bind to cells express-
ing BLyS receptors, and therefore it has no agonistic activity.
Moreover, ∆BLyS can form heterotrimers with full-length
BLyS, thereby actually functioning as a dominant-negative
antagonist of BLyS activity.)
In this report we demonstrate that peripheral blood leukocytes
from SLE patients express elevated mRNA levels of both full-
Table 1
Characteristics of study populations
Parameter Normal RA SLE SLE repeat
Number of subjects 30 60 60 37
Age (mean [range]; years) 36.5 (21.2–54.4) 47.3 (19.1–71.7) 39.4 (19.4–66.8) 35.1 (20.4–66.3)
Sex (female/male; n) 27/3 52/8 56/4 36/1
Race (n)
Asian 11 5 5 2
Black 3 3 6 3
Hispanic 13 51 49 32
White 3 1 0 0
Prednisone use
Number of patients - 17 50 31
Mean dosage (mg/day) - 5.5 10.8 6.0
Dosage range (mg/day) - 2.5–10 2–30 1–30
Use of other medications (n)
Cyclophosphamide - 0 4 2
Azathioprine - 4 27 15
Mycophenolate mofetil - 1 9 13
Methotrexate - 42 2 2
Sulfasalazine - 17 0 0
Hydroxychloroquine - 36 53 36
Leflunomide - 0 1 0
Any TNF antagonist - 18 0 0
RA, rheumatoid arthritis; SLE, systemic lupus erythematosus; TNF, tumor necrosis factor.
Available online />Page 3 of 12
(page number not for citation purposes)
length BLyS and ∆BLyS relative to those levels expressed by
patients with rheumatoid arthritis (RA) or by normal control
individuals. In the SLE patients, both full-length BLyS and
∆BLyS mRNA levels are more closely associated with disease
activity (SLEDAI) than are BLyS protein levels. Accordingly,
BLyS mRNA levels may be a helpful biomarker in the clinical
monitoring of SLE patients.
Materials and methods
General details
This study was approved by the institutional review boards of
the University of Southern California and the Scripps
Research Institute. All participants gave their written informed
consent before participation in this study.
Participants
Patients receiving outpatient medical care at the rheumatology
clinics of the Los Angeles County + University of Southern
California Medical Center were recruited into the study. Diag-
noses of SLE (n = 60) or RA (n = 60) were based on estab-
lished clinical criteria [12]. Healthy control individuals (n = 30)
were recruited from Los Angeles County + University of
Southern California Medical Center and University of Southern
California Keck School of Medicine personnel. No exclusions
were made on any basis other than an inability to give informed
consent. Each patient's sex, race, age, and medications at the
time of the phlebotomy were recorded (Table 1).
Based solely on the patient's willingness to donate a second
blood sample, repeat blood samples were collected from 37
of the SLE patients 147–511 days (median 371 days) after
collection of the first samples. These patients were not
selected on the basis of any demographic, clinical, or labora-
tory feature.
Clinical disease activity for the SLE patients was assessed
using the SLEDAI [13] and using a modified SLEDAI that
excludes the contribution of anti-double-stranded DNA (anti-
dsDNA) antibodies from the total score. Each patient's medi-
cal chart was reviewed for results of standard clinical labora-
tory tests within the previous or subsequent 1-month period.
Plasma BLyS determination
Whole venous blood was centrifuged to yield plasma and a
buffy coat. The plasma was harvested, stored at -70°C, and
assayed for BLyS levels by ELISA [8,14] using Fab fragments
of the capture antibody rather than the whole antibody to
reduce assay interference by rheumatoid factor. The lower
limit of detection in this assay is 0.3 ng/ml. For statistical pur-
poses, plasma samples with BLyS concentrations below the
lower limit of detection were assigned a value of 0.25 ng/ml.
Blood BLyS mRNA determination
The buffy coat from centrifuged whole blood was harvested,
added to RNAlater™ (Ambion, Austin, TX, USA) at a 1:4 vol/
vol ratio for RNA stabilization, stored at -70°C, and assayed for
full-length BLyS and ∆BLyS mRNA levels by real-time PCR.
Total RNA was purified from buffy coat samples using RNAe-
asy miniprep kits (Qiagen, Valencia, CA, USA), and contami-
nating genomic DNA was removed by DNAse-I digestion.
One-tenth volume of total RNA was used as template in the
first-strand cDNA reaction using oligo-dT and the Superscript
III first-strand synthesis system (Invitrogen, Carlsbad, CA,
USA). Duplicate samples of cDNA were amplified with primers
against β-actin, full-length BLyS, or ∆BLyS: β-actin sense 5'-
CGAGAAGATGACCCAGATCATGT-3'; β-actin anti-sense
5'-GGCATACCCCTCGTAGATGG-3'; full-length BLyS
sense 5'-GCAGACAGTGAAACACCAACTATAC-3'; ∆BLyS
sense 5'-CAGAAGAAACAGGATCTTACACAT-3'; and full-
length BLyS/∆BLyS anti-sense 5'-TGCCAGCTGAATAG-
CAGGAATTAT-3'.
A 165 bp amplicon for β-actin was PCR-amplified using the
7900 HT ABI Prism machine (Qiagen) with annealing at 65°C.
A 296 bp amplicon for full-length BLyS was PCR-amplified,
with annealing at 64°C. A 270 bp amplicon for ∆BLyS was
PCR-amplified with annealing at 61°C. The annealing condi-
tions for full-length BLyS and ∆BLyS were determined so that
each primer set remained specific to the respective BLyS iso-
form and yielded a PCR efficiency similar to those of cloned
cDNA standards. Melting curve analysis revealed a single
peak for each gene amplified. The threshold cycle (Ct) values
for each reaction were determined using Sequence Detection
System software (Applied Biosystems, Foster City, CA, USA).
Results are presented as ratios of full-length BLyS or ∆BLyS
mRNA to β-actin mRNA, which were calculated using the fol-
lowing formulae:
2 exp(Ct
β-actin
- Ct
full-length BLyS
)
2 exp(Ct
β-actin
- Ct
∆BLyS
)
Determination of anti-BLyS autoantibodies
BLyS was bound to microtiter plates by first coating the plates
with streptavidin and then adding biotinylated recombinant
BLyS. Using these plates as the capture reagent, plasma
samples were incubated, and horseradish peroxidase-conju-
gated anti-human IgA/IgM/IgG (Southern Biotechnology
Associates, Birmingham, AL, USA; 1:20,000 final dilution) or
horseradish peroxidase-conjugated anti-human IgG (Southern
Biotechnology; 1:10,000 final dilution) were used as the
detector reagents.
Statistical analysis
All analyses were performed using SigmaStat software
(SPSS, Chicago, IL, USA). Results that did not follow a normal
distribution were log-transformed to achieve normality. Para-
metric testing between two matched or unmatched groups
was performed using the paired or unpaired t test, respec-
tively. Parametric testing among three or more groups was
Arthritis Research & Therapy Vol 8 No 1 Collins et al.
Page 4 of 12
(page number not for citation purposes)
performed using one-way analysis of variance. When log-
transformation failed to generate normally distributed data or
the equal variance test was not satisfied, nonparametric test-
ing was performed using the Mann–Whitney rank sum test
between two groups and by Kruskal–Wallis one-way analysis
of variance on ranks among three or more groups. Correlations
were determined using Pearson product moment correlation
for interval data and using Spearman rank order correlation for
ordinal data or for interval data that did not follow a normal dis-
tribution. Nominal data were analyzed using χ
2
analysis-of-con-
tingency tables.
Results
Elevated plasma BLyS levels and blood levels of full-
length BLyS and ∆BLyS mRNA isoforms in systemic
lupus erythematosus patients
Previous reports of elevated circulating BLyS levels in SLE
patients were based on a BLyS ELISA that utilized a whole
(unfragmented) capture anti-BLyS monoclonal antibody [7-9].
Since the publication of these reports, it has been recognized
that the presence of rheumatoid factor can potentially interfere
with the assay and lead to spurious overestimation of the true
circulating BLyS levels (Human Genome Sciences, Inc.;
unpublished observations). To mitigate potential interference
from rheumatoid factor, the BLyS ELISA has been modified
and the capture anti-BLyS monoclonal antibody is now utilized
as a Fab fragment. Despite the changes in the ELISA format,
our findings are entirely consistent with those of the previous
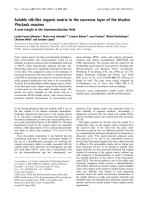
reports. Plasma BLyS levels were significantly greater in the
SLE group than in either RA or normal control group (P <
0.001; Figure 1a). Arbitrary assignment of the 95th percentile
value among the normal control individuals as the upper limit
of 'normal' revealed that two of the 30 normal control individu-
als, 15 of the 60 RA patients, and 29 of the 60 SLE patients
harbored elevated plasma BLyS levels (P < 0.001).
Overexpression of BLyS in SLE patients was also established
by measuring BLyS mRNA levels normalized to β-actin mRNA
levels in peripheral blood leukocytes (buffy coats). The geo-
metric mean full-length BLyS mRNA and ∆BLyS mRNA levels
among the SLE patients were each significantly greater than
those among the RA patients and normal control individuals,
respectively (P < 0.001 for each; Figure 1b,c). Arbitrary
assignment of the 95th percentile values for full-length BLyS
and ∆BLyS mRNA levels among the normal control individuals
as the upper limits of 'normal' revealed that two of the 30 nor-
mal control individuals, four of the 60 RA patients, and 20 of
the 60 SLE patients had elevated full-length BLyS mRNA lev-
els (P < 0.001), and that two of the 30 normal control individ-
uals, three of the 60 RA patients, and 19 of the 60 SLE
patients had elevated ∆BLyS mRNA levels (P < 0.001). Levels
of full-length BLyS and ∆BLyS mRNA strongly correlated with
each other (r = 0.703; P < 0.001) in the SLE cohort, and
plasma BLyS levels also correlated significantly with levels of
each BLyS isoform (r = 0.429, P < 0.001; and r = 0.290, P =
0.024, respectively). Among these SLE patients, none of the
measured BLyS parameters correlated with patient age, sex,
race, or daily dose of corticosteroids (data not shown).
Because the racial composition of the normal cohort was not
as predominantly Hispanic as were those of the RA and SLE
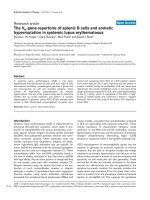
Figure 1
BLyS protein and BLyS isoform mRNA levels in normal individuals, and RA, and SLE patientsBLyS protein and BLyS isoform mRNA levels in normal individuals, and RA, and SLE patients. (a) Plasma from normal individuals (Nl), and RA and
SLE patients were assayed for BLyS levels by ELISA. Each symbol indicates an individual subject. The composite results are plotted as box plots.
The lines inside the boxes indicate the medians, the outer borders of the boxes indicate the 25th and 75th percentiles, and the bars extending from
the boxes indicate the 10th and 90th percentiles. The thin solid line across the plot indicates the lower limit of detection in the BLyS assay (0.3 ng/
ml). (b,c) RNA was extracted from peripheral blood buffy coats from the same individuals. Amounts of full-length BLyS, ∆BLyS, and actin mRNA
were quantified by real-time RT-PCR, and results are shown as ratios of full-length BLyS mRNA (b) and ∆BLyS mRNA (c) to actin mRNA. BLyS, B
lymphocyte stimulator; ELISA, enzyme-linked immunosorbent assay; RA, rheumatoid arthritis; RT-PCR, reverse transcription polymerase chain reac-
tion; SLE, systemic lupus erythematosus.
Available online />Page 5 of 12
(page number not for citation purposes)
cohorts, we assessed the BLyS parameters in the respective
Hispanic subpopulations. As for the entire populations, values
for SLE were significantly greater than those for either RA or
normal controls (P ≤ 0.004; data not shown).
Correlations between BLyS parameters and plasma
immunoglobulin levels
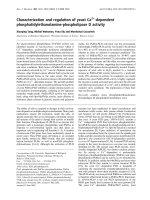
BLyS is a potent B cell survival factor [15-21], and administra-
tion of exogenous BLyS to mice leads to B cell expansion and
hypergammaglobulinemia [1]. Previous studies with numbers
of SLE patients greater than were included in the present
study documented a modest but significant correlation
between serum levels of BLyS and IgG [8,10]. In our SLE
cohort of limited size, plasma BLyS levels failed to show signif-
icant correlations with plasma levels of total immunoglobulin,
IgG, or IgA. In contrast, full-length BLyS and ∆BLyS mRNA
levels correlated significantly with each (Figure 2). (None of
the BLyS parameters correlated with plasma IgM levels.) The
absence of significant correlation between plasma BLyS lev-
els and the immunoglobulin parameters also persisted when
just the 53 patients with detectable plasma BLyS levels were
considered (r = -0.133, P = 0.346 for total immunoglobulin; r
= -0.048, P = 0.734 for IgG; and r = 0.033, P = 0.817 for
IgA).
Correlations between BLyS parameters and disease
activity
Previous studies either have failed to demonstrate a significant
correlation between disease activity and circulating BLyS lev-
els [7-9] or have detected only a weak correlation between the
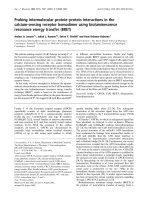
two [10]. Consonant with those studies, we identified no sig-
nificant correlation between plasma BLyS levels and SLEDAI
in our cohort of 60 SLE patients (Figure 3a). The failure to
demonstrate a significant correlation cannot be attributed to a
skewing of the results by the patients in whom plasma BLyS
levels were below the limit of detection, because no significant
correlation was detected among the 53 SLE patients in whom
plasma BLyS levels were in the detectable range (r = 0.185,
P = 0.183). In contrast, a significant correlation between
SLEDAI and full-length BLyS mRNA levels was readily dis-
cernible (Figure 3b). A trend toward a correlation between
SLEDAI and ∆BLyS mRNA levels was also observed, although
it did not achieve statistical significance (Figure 3c).
A component of the SLEDAI is the presence of circulating anti-
dsDNA antibodies. Because circulating BLyS levels may
affect the presence and/or titers of circulating anti-dsDNA
antibodies [7-10], we assessed correlations between the indi-
vidual BLyS parameters and a modified SLEDAI that excludes
any consideration of anti-dsDNA antibodies. As with the
unmodified SLEDAI, the modified SLEDAI did not correlate
with plasma BLyS levels (Figure 3d) either among the SLE
cohort overall or among the 53 patients in whom plasma BLyS
levels were in the detectable range (r = 0.160, P = 0.252), but
it significantly correlated with full-length BLyS mRNA levels
(Figure 3e) and exhibited a trend toward correlation with
∆BLyS mRNA levels (Figure 3f). Thus, the stronger correla-
tions between BLyS mRNA levels and disease activity cannot
solely be explained by any effects that BLyS may have on anti-
dsDNA antibodies per se.
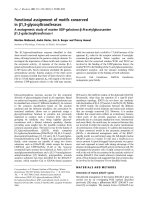
Moreover, among the 37 SLE patients who were evaluated on
two separate occasions, trends toward correlation were
appreciated between changes in the unmodified or modified
SLEDAI and changes in full-length BLyS or ∆BLyS mRNA lev-
els but not changes in plasma BLyS levels (Figure 4). These
results cannot be ascribed to changes in medications taken by
the patients, because changes in neither disease activity nor
in any of the BLyS parameters correlated with changes in the
doses of corticosteroids or cytotoxics taken by the patients
(data not shown). The failure to demonstrate a meaningful
association between changes in SLEDAI score and changes
in plasma BLyS protein levels cannot be attributed to a skew-
ing of the results by the patients in whom plasma BLyS levels
were below the limit of detection, because the absence of
association between the two persisted among the 27 SLE
patients in whom plasma BLyS levels were in the detectable
range in both samples (r = -0.069, P = 0.727 for plasma BLyS
versus unmodified SLEDAI; r = -0.020, P = 0.919 for plasma
BLyS versus modified SLEDAI).
Lack of correlation between levels of BLyS mRNA
isoforms and percentages of individual leukocyte cell
types
Among cells in peripheral blood, BLyS is predominantly
expressed by cells of the myeloid lineage (monocytes and neu-
trophils) [1,14,22,23]. Accordingly, a shift in the differential
leukocyte count away from lymphocytes to monocytes and/or
neutrophils could substantially alter BLyS mRNA results.
Because of the limited amount of blood we were permitted to
obtain from the SLE patients (consequent to the high preva-
lence of anemia among these patients), we were unable to
purify the individual leukocyte populations for BLyS mRNA
analysis. Nevertheless, to demonstrate that the elevated BLyS
mRNA levels in SLE did not simply reflect a shift in differential
leukocyte count, we assessed the correlations between the
individual BLyS parameters on the one hand and the percent-
ages of blood neutrophils, monocytes, and lymphocytes on the
other. No correlations were appreciated (Figure 5).
Presence of anti-BLyS autoantibodies in patients with
systemic lupus erythematosus
The poorer correlation between plasma BLyS protein levels
and disease activity compared with that between BLyS mRNA
levels and disease activity was striking. Patients with SLE fre-
quently develop autoantibodies against self-antigens, and so
some of the SLE patients might have harbored autoantibodies
to BLyS. Such autoantibodies could have complexed with
BLyS and enhanced its clearance, thereby masking BLyS
overproduction. Alternatively, such autoantibodies might have
Arthritis Research & Therapy Vol 8 No 1 Collins et al.
Page 6 of 12
(page number not for citation purposes)
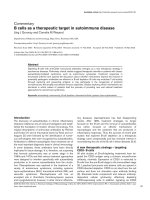
Figure 2
Correlations in the SLE patients between BLyS parameters and plasma immunoglobulin levelsCorrelations in the SLE patients between BLyS parameters and plasma immunoglobulin levels. Individual (a,d,g,j) BLyS protein levels, (b,e,h,k) full-
length BLyS mRNA levels, and (c,f,i,l) ∆BLyS mRNA levels are plotted against corresponding plasma total immunoglobulin levels (a–c), IgG levels
(d–f), IgA levels (g–i), and IgM levels (j–l). BLyS, B lymphocyte stimulator; IL, interleukin.
Available online />Page 7 of 12
(page number not for citation purposes)
sterically blocked the epitopes recognized by the detecting
antibodies in the in vitro ELISA. In this case, measured BLyS
levels would have been spuriously reduced, again masking
BLyS overproduction.
In our cohort, IgA/IgM/IgG anti-BLyS antibodies were
detected in six out of the 60 SLE patients. Such autoantibod-
ies were also detected in two out of 60 RA patients and in one
out of 30 normal control individuals, demonstrating that anti-
BLyS autoantibodies are not restricted to SLE patients. IgG
anti-BLyS autoantibodies were detected in 3 SLE patients but
in no RA patients or normal control individuals.
Discussion
Elevated blood levels of BLyS protein and mRNA are well
described features of human SLE [7-9]. We confirmed these
observations in our study and extended them by documenting
increases not just in levels of full-length BLyS mRNA but also
in levels of ∆BLyS mRNA (Figure 1). Of note, BLyS mRNA lev-
els were elevated in SLE but not in RA, raising the possibility
that BLyS overproduction in SLE is systemic whereas BLyS
overproduction in RA may be more focused to the affected
arthritic joints [24]. The modestly elevated plasma BLyS pro-
tein levels in RA patients may reflect, at least in part, release of
locally overproduced BLyS into the circulation.
The relationship between circulating BLyS protein levels and
disease activity was addressed in several previous studies, but
significant correlations between the two measures did not
emerge [7-9]. In the largest study to date, a 2-year longitudinal
study of 245 patients in which more than 1,700 plasma sam-
ples were analyzed, a significant but weak correlation between
the two was appreciated [10]. In the present study, a
significant correlation between plasma BLyS protein levels
and disease activity was again not realized (Figure 3a,d).
The weak, at best, correlation between circulating BLyS levels
and disease activity is seemingly rather surprising. There is a
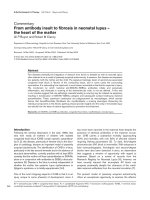
Figure 3
Correlations in the SLE patients between BLyS parameters and disease activityCorrelations in the SLE patients between BLyS parameters and disease activity. Individual (a,d) BLyS protein levels, (b,e) full-length BLyS mRNA
levels, and (c,f) ∆BLyS mRNA levels are plotted against corresponding SLEDAI scores (a–c) or modified SLEDAI scores (d–f). BLyS, B lymphocyte
stimulator; SLEDAI, Systemic Lupus Erythematosus Disease Activity Index.
Arthritis Research & Therapy Vol 8 No 1 Collins et al.
Page 8 of 12
(page number not for citation purposes)
clear-cut association in BlyS transgenic mice between BLyS
overexpression and development of SLE-like features [3-5],
and treatment of SLE-prone mice with BLyS antagonists
retards the progression of disease and improves survival [3,6].
Moreover, development of precocious glomerular pathology in
autoimmune-prone mice correlates strongly with circulating
BLyS levels [25].
The likely explanation for the weak correlation between circu-
lating BLyS levels and disease activity in human SLE is not that
disease activity in SLE patients is insensitive to the degree of
BLyS overproduction. Rather, a more tenable explanation is
that circulating BLyS levels in human SLE do not always accu-
rately reflect excessive endogenous BLyS production. We can
identify at least three nonmutually exclusive mechanisms to
explain a dissociation between the two.
First, SLE patients frequently develop autoantibodies to a myr-
iad of self-targets (for example, erythrocytes, lymphocytes).
Indeed, we detected circulating IgA/IgM/IgG anti-BLyS
autoantibodies in 10% (6/60) of the tested SLE patients, and
we detected circulating IgG anti-BLyS autoantibodies in 5%
(3/60). These percentages may be underestimates of the true
prevalence of anti-BLyS autoantibodies, because some of
these autoantibodies may be saturated in vivo with circulating
BLyS, rendering them incapable of binding to BLyS in the in
vitro detection assay. We do not yet know whether the anti-
BLyS autoantibodies are functionally neutralizing but, regard-
less, such autoantibodies could enhance the clearance of
BLyS and/or interfere with in vitro detection of BLyS, thereby
masking endogenous BLyS overproduction.
Second, increased urinary excretion of BLyS has been
reported in SLE patients, especially among those with clini-
Figure 4
Correlations in SLE patients between changes in SLEDAI and BLyS parametersCorrelations in SLE patients between changes in SLEDAI and BLyS parameters. Individual (a,d) BLyS protein levels, (b,e) full-length BLyS mRNA
levels, and (c,f) ∆BLyS mRNA levels are plotted according to directional changes in SLEDAI scores (a–c) or modified SLEDAI scores (d–f) between
the first and second clinical assessments. BLyS, B lymphocyte stimulator; SLEDAI, Systemic Lupus Erythematosus Disease Activity Index.
Available online />Page 9 of 12
(page number not for citation purposes)
cally overt renal involvement [26]. At least four of the patients
we studied manifested nephrotic-range proteinuria (≥3 g/24
hours), and so urinary loss of BLyS was probably substantial
in at least these patients. A validated assay for urinary BLyS
detection has not yet been developed so we were unable to
quantify urinary BLyS levels. Once an assay for urinary BLyS
levels is validated, we should be able to assess the effect of
urinary BLyS excretion on circulating BLyS levels.
Third, BLyS promotes in vivo expansion of B cells [1]. Freshly
isolated SLE B cells, despite intact surface expression of
BLyS receptors, bind less biotinylated BLyS ex vivo than do
freshly isolated normal B cells [27]. Although other interpreta-
tions are possible, the most likely explanation is that BLyS
receptors on B cells in SLE patients are occupied in vivo by
soluble BLyS. Accordingly, it is likely that BLyS receptors
expressed by the expanded B cell population do bind BLyS
and remove it from the circulation, resulting in a homeostatic
pathway that modulates the effects of BLyS overproduction on
circulating BLyS levels. Indeed, circulating levels of BLyS rise
with peripheral blood B cell depletion and fall with re-emer-
gence of peripheral blood B cells in rituximab-treated RA or
SLE patients [28,29], highlighting this inverse relationship
between circulating BLyS levels and B cell load. Moreover,
one of the hallmarks of active disease in human SLE is the
increased percentages of activated B cells and plasma cells in
peripheral blood [30-34], probably reflecting increased sys-
temic numbers of activated B cells and plasma cells. Although
not yet formally tested, differential BLyS receptor expression
by these cells compared with expression by nonactivated B
cells may result in increased peripheral BLyS utilization, further
dampening the effects of BLyS overproduction on circulating
protein levels.
To circumvent these confounding processes, we used BLyS
mRNA levels as a surrogate marker of endogenous BLyS pro-
duction. Overall, the correlations between disease activity and
either full-length BLyS or ∆BLyS mRNA levels were much
stronger than that between disease activity and BLyS protein
levels (Figures 3 and 4). This was the case regardless of
whether we used the standard SLEDAI or the modified
SLEDAI as a measure of disease activity. These correlations
were not spurious ones consequent to shifts in percentages of
leukocyte subpopulations in peripheral blood, because BLyS
Figure 5
No correlation in SLE between BLyS mRNA isoforms and percentages of individual leukocyte cell typesNo correlation in SLE between BLyS mRNA isoforms and percentages of individual leukocyte cell types. Individual (a–c) full-length BLyS mRNA lev-
els and (d–f) ∆BLyS mRNA levels are plotted against corresponding peripheral blood percentages of neutrophils (a,d), monocytes (b,e), and lym-
phocytes (c,f). BLyS, B lymphocyte stimulator.
Arthritis Research & Therapy Vol 8 No 1 Collins et al.
Page 10 of 12
(page number not for citation purposes)
mRNA levels did not correlate with percentages of blood neu-
trophils, monocytes, or lymphocytes (Figure 5).
A similar pattern was observed between plasma immunoglob-
ulin levels and the BLyS parameters, with plasma levels of total
immunoglobulin, IgG, and IgA correlating significantly with full-
length BLyS and ∆BLyS mRNA levels but not with plasma
BLyS levels (Figure 2). These significant correlations between
full-length BLyS or ∆BLyS mRNA levels and plasma immu-
noglobulin levels again highlight the greater ability of BLyS
mRNA levels, compared with plasma BLyS protein levels, to
reflect ongoing BLyS overproduction.
At present, it is not known whether soluble ∆BLyS protein is
present in the circulation of SLE patients or of normal individ-
uals. Although full-length BLyS protein is readily cleaved and
released from cells transfected with a vector containing
murine full-length BLyS, ∆BLyS protein is not cleaved or
released from murine ∆BLyS transfectants [11]. Given the
strong similarities between murine and human full-length BLyS
and ∆BLyS, it is likely that human soluble ∆BLyS protein is also
not cleaved from the cell surface and released into the circula-
tion. Moreover, soluble ∆BLyS protein is not released from
cells transfected with a vector containing just the extracellular
domain of human ∆BLyS (which encodes the soluble protein;
A.L. Gavin, unpublished observations). Whether this reflects
rapid intracellular degradation of soluble ∆BLyS or some other
impediment to its release remains unknown. Regardless, if the
inability to release soluble ∆BLyS in vitro faithfully recapitu-
lates in vivo biology, then the stronger associations between
SLE disease activity and full-length BLyS or ∆BLyS mRNA
levels compared with that between SLE disease activity and
BLyS protein levels could not be attributable to interference by
biologically inactive (inhibitory) ∆BLyS protein in the BLyS pro-
tein detection ELISA. Importantly, even if soluble ∆BLyS pro-
tein is present in the circulation and is detected by the BLyS
protein detection ELISA, then the stronger correlations
between SLE disease activity and full-length BLyS or ∆BLyS
mRNA levels than that between disease activity and total BLyS
(including ∆BLyS) protein levels suggest that full-length BLyS
and/or ∆BLyS mRNA levels may operationally serve as useful
biomarkers of disease activity in SLE. Although the complexity
and labor intensiveness associated with quantitative real-time
PCR may render measurement of BLyS mRNA levels imprac-
ticable for routine clinical practice, such measurement could
readily be incorporated into clinical trials and yield valuable
information.
Longitudinal observations in large numbers of SLE patients
will be necessary to establish or refute the utility of full-length
BLyS and/or ∆BLyS mRNA to subserve this clinically vital
function.
Although expression of the two major BLyS isoforms was
highly coordinate among SLE patients, there were several
patients in whom ∆BLyS mRNA levels were markedly greater
than or less than the expected values based on full-length
BLyS mRNA levels (data not shown). This raises the possibility
that dysregulation of ∆BLyS may contribute to overall BLyS
dysregulation in at least some SLE patients. It is known that
interferon-γ, interleukin-10, interferon-α, and CD154 can
upregulate full-length BLyS mRNA levels [14,22,35], but it is
not known what effects these or other cytokines/cell-surface
structures have on ∆BLyS expression. Further investigation of
the regulation of ∆BLyS and the differential expression of
BLyS isoforms is certainly warranted.
Although the associations between full-length BLyS and/or
∆BLyS mRNA levels and disease activity in SLE were usually
strong when the SLE cohort was analyzed in aggregate, there
were several SLE patients in whom BLyS mRNA levels were
quite high despite little objective ongoing disease activity, and
there were several SLE patients in whom BLyS mRNA levels
were low despite considerable ongoing disease activity. One
must recognize that the bulk of the pathogenic autoimmune
responses probably takes place in the spleen and lymph
nodes, rather than in the peripheral blood, where myeloid line-
age cells (for example, dendritic cells) produce BLyS and sup-
port B cell survival and expansion [36]. Local BLyS production
in the secondary lymphoid tissues will be more important to
the development and maintenance of an autoimmune
response than will remote BLyS levels in the circulation.
Because at least some autoreactive B cells may be more sen-
sitive to BLyS-mediated survival signals than non-autoreactive
B cells [37,38], local increases in BLyS production could
preferentially promote expansion of autoreactive B cells.
These cells, in turn, could activate autoreactive T cells by pre-
senting autoantigen to them, and some of the autoreactive B
cells would respond to T cell derived signals and mature into
(pathogenic) autoantibody secreting plasma cells. In contrast
to murine studies, in which investigators can readily harvest
and analyze lymphoid and myeloid lineage cells from any site
(for example, spleen, bone marrow), such is not the case for
human studies. Peripheral blood is the only site readily acces-
sible for human studies, and it is possible that, at least in some
patients, BLyS mRNA levels in circulating leukocytes do not
reflect local BLyS production in the secondary lymphoid
tissues.
One must also recognize that disease activity in SLE is not
solely driven by B cells. Systemic inflammation and SLE flares
can be triggered via B cell independent means. Not all SLE
patients treated with a B cell depleting course of rituximab
experience clinical remission [39], strongly pointing to the
importance of non-B cells in disease pathogenesis/mainte-
nance. Conversely, not all pathogenic B cells necessarily
require high levels of BLyS to effect their pathogenicity. Murine
studies have unequivocally documented B cell subpopulations
that do not depend upon BLyS for their survival [40-42].
Although mice completely devoid of BLyS have reduced num-
Available online />Page 11 of 12
(page number not for citation purposes)
bers of mature B cells and harbor reduced levels of immu-
noglobulin, these reductions are incomplete. Thus, it is
possible that some SLE patients harbor pathogenic B cells
that are relatively insensitive to BLyS and could drive consid-
erable disease activity even in the context of low endogenous
BLyS production. Conversely, patients with high BLyS mRNA
levels may be those patients whose disease is strongly driven
by BLyS and may be especially helped by BLyS antagonist
therapy. Future clinical trials should be able to establish
whether the BLyS mRNA levels are good predictors of
response to such agents.
Conclusion
Plasma total immunoglobulin, IgG, and IgA levels and disease
activity (as measured by SLEDAI) in SLE patients correlate
more closely with peripheral blood leukocyte levels of BLyS
mRNA than with plasma levels of BLyS protein. These findings
suggest that BLyS mRNA levels better reflect in vivo BLyS
production than do circulating BLyS protein levels, and may be
a useful biomarker in the clinical monitoring of SLE patients.
These findings also support the premise that BLyS overex-
pression not only promotes development of disease but also
actively contributes to the ongoing maintenance of disease in
SLE patients. This reinforces the rationale underlying clinical
trials with BLyS antagonists in SLE.
Competing interests
TSM and DMH were employees of Human Genome Sciences
(HGS) at the time the investigation was conducted. (DMH has
since left the company.) WS has received research support
from HGS and has served as a consultant to HGS
(<$10,000). CEC, ALG, and DN declare that they have no
competing interests.
Authors' contributions
CEC identified and recruited all participants; collected all the
blood samples and reviewed all the medical charts; and wrote
the initial working draft of this manuscript. ALG developed and
performed all the real-time PCR assays and assisted in the
interpretation of the results and in writing the final version of
the manuscript. TSM performed the plasma BLyS protein and
anti-BLyS assays and assisted in the interpretation of the
results and in writing the final version of the manuscript. DMH
assisted in the design in the study, in the interpretation of the
results, and in writing the final version of the manuscript. DN
assisted in the design in the study, in the interpretation of the
results, and in writing the final version of the manuscript. WS
conceived the study, supervised the recruitment of partici-
pants, performed the statistical analyses, assisted in the inter-
pretation of the results, and supervised the editing of the
manuscript to its final form. All authors read and approved the
final manuscript version.
Acknowledgements
The authors thank Dong Xu for handling and cataloging the specimens,
Dr Donald Mosier for use of the quantitative PCR device, and all sub-
jects for their participation in the study. This work was supported in part
by grants R01 GM44809 (DN) and R03 AR050017 (ALG).
References
1. Moore PA, Belvedere O, Orr A, Pieri K, LaFleur DW, Feng P, Sop-
pet D, Charters M, Gentz R, Parmelee D, et al.: BLyS: member of
the tumor necrosis factor family and B lymphocyte stimulator.
Science 1999, 285:260-263.
2. Schneider P, MacKay F, Steiner V, Hofmann K, Bodmer JL, Holler
N, Ambrose C, Lawton P, Bixler S, Acha-Orbea H, et al.: BAFF, a
novel ligand of the tumor necrosis factor family, stimulates B
cell growth. J Exp Med 1999, 189:1747-1756.
3. Gross JA, Johnston J, Mudri S, Enselman R, Dillon SR, Madden K,
Xu W, Parrish-Novak J, Foster D, Lofton-Day C, et al.: TACI and
BCMA are receptors for a TNF homologue implicated in B-cell
autoimmune disease. Nature 2000, 404:995-999.
4. Mackay F, Woodcock SA, Lawton P, Ambrose C, Baetscher M,
Schneider P, Tschopp J, Browning JL: Mice transgenic for BAFF
develop lymphocytic disorders along with autoimmune
manifestations. J Exp Med 1999, 190:1697-1710.
5. Khare SD, Sarosi I, Xia XZ, McCabe S, Miner K, Solovyev I,
Hawkins N, Kelley M, Chang D, Van G, et al.: Severe B cell hyper-
plasia and autoimmune disease in TALL-1 transgenic mice.
Proc Natl Acad Sci USA 2000, 97:3370-3375.
6. Kayagaki N, Yan M, Seshasayee D, Wang H, Lee W, French DM,
Grewal IS, Cochran AG, Gordon NC, Yin J, et al.: BAFF/BLyS
receptor 3 binds the B cell survival factor BAFF ligand through
a discrete surface loop and promotes processing of NF-κB2.
Immunity 2002, 17:515-524.
7. Zhang J, Roschke V, Baker KP, Wang Z, Alarcón GS, Fessler BJ,
Bastian H, Kimberly RP, Zhou T: Cutting edge: a role for B lym-
phocyte stimulator in systemic lupus erythematosus. J
Immunol 2001, 166:6-10.
8. Cheema GS, Roschke V, Hilbert DM, Stohl W: Elevated serum B
lymphocyte stimulator levels in patients with systemic
immune-based rheumatic diseases. Arthritis Rheum 2001,
44:1313-1319.
9. Stohl W, Metyas S, Tan SM, Cheema GS, Oamar B, Xu D,
Roschke V, Wu Y, Baker KP, Hilbert DM: B lymphocyte stimula-
tor overexpression in patients with systemic lupus erythema-
tosus: longitudinal observations. Arthritis Rheum 2003,
48:3475-3486.
10. Petri M, Stohl W, Chatham W, McCune W, Chevrier M, Shen Y-L,
Zhong J, Orr A, Hall L, Freimuth W: Association of BLyS™ with
measures of disease activity in a prospective SLE observa-
tional study. Arthritis Rheum 2004, 50:S603.
11. Gavin AL, Aït-Azzouzene D, Ware CF, Nemazee D: ∆BAFF, an
alternate splice isoform that regulates receptor binding and
biopresentation of the B cell survival cytokine, BAFF. J Biol
Chem 2003, 278:38220-38228.
12. Klippel JH: Primer on the Rheumatic Diseases 12th edition.
Atlanta: Arthritis Foundation; 2001.
13. Bombardier C, Gladman DD, Urowitz MB, Caron D, Chang CH:
Derivation of the SLEDAI: a disease activity index for lupus
patients. The Committee on Prognosis Studies in SLE. Arthritis
Rheum 1992, 35:630-640.
14. Nardelli B, Belvedere O, Roschke V, Moore PA, Olsen HS, Migone
TS, Sosnovtseva S, Carrell JA, Feng P, Giri JG, Hilbert DM: Syn-
thesis and release of B-lymphocyte stimulator from myeloid
cells. Blood 2001, 97:198-204.
15. Thompson JS, Schneider P, Kalled SL, Wang L, Lefevre EA, Cach-
ero TG, MacKay F, Bixler SA, Zafari M, Liu ZY, et al.: BAFF binds
to the tumor necrosis factor receptor-like molecule B cell mat-
uration antigen and is important for maintaining the peripheral
B cell population. J Exp Med 2000, 192:129-135.
16. Do RK, Hatada E, Lee H, Tourigny MR, Hilbert D, Chen-Kiang S:
Attenuation of apoptosis underlies B lymphocyte stimulator
enhancement of humoral immune response. J Exp Med 2000,
192:953-964.
17. Batten M, Groom J, Cachero TG, Qian F, Schneider P, Tschopp J,
Browning JL, Mackay F: BAFF mediates survival of peripheral
immature B lymphocytes. J Exp Med 2000, 192:1453-1466.
18. Harless SM, Lentz VM, Sah AP, Hsu BL, Clise-Dwyer K, Hilbert
DM, Hayes CE, Cancro MP: Competition for BLyS-mediated
Arthritis Research & Therapy Vol 8 No 1 Collins et al.
Page 12 of 12
(page number not for citation purposes)
signaling through Bcmd/BR3 regulates peripheral B lym-
phocyte numbers. Curr Biol 2001, 11:1986-1989.
19. Hsu BL, Harless SM, Lindsley RC, Hilbert DM, Cancro MP: Cut-
ting edge: BLyS enables survival of transitional and mature B
cells through distinct mediators. J Immunol 2002,
168:5993-5996.
20. Avery DT, Kalled SL, Ellyard JI, Ambrose C, Bixler SA, Thien M,
Brink R, Mackay F, Hodgkin PD, Tangye SG: BAFF selectively
enhances the survival of plasmablasts generated from human
memory B cells. J Clin Invest 2003, 112:286-297.
21. Hatada EN, Do RK, Orlofsky A, Liou HC, Prystowsky M, MacLen-
nan IC, Caamano J, Chen-Kiang S: NF-κB1 p50 is required for
BLyS attentuation of apoptosis but dispensible for processing
of NF-κB2 p100 to p52 in quiescent mature B cells. J Immunol
2003, 171:761-768.
22. Scapini P, Nardelli B, Nadali G, Calzetti F, Pizzolo G, Montecucco
C, Cassatella MA: G-CSF-stimulated neutrophils are a promi-
nent source of functional BLyS. J Exp Med 2003, 197:297-302.
23. Scapini P, Carletto A, Nardelli B, Calzetti F, Roschke V, Merigo F,
Tamassia N, Pieropan S, Biasi D, Sbarbati A, et al.: Proinflamma-
tory mediators elicit the secretion of the intracellular B-lym-
phocyte stimulator pool (BLyS) that is stored in activated
neutrophils: implications for inflammatory diseases. Blood
2005, 105:830-837.
24. Tan SM, Xu D, Roschke V, Perry JW, Arkfeld DG, Ehresmann GR,
Migone TS, Hilbert DM, Stohl W: Local production of B lym-
phocyte stimulator protein and APRIL in arthritic joints of
patients with inflammatory arthritis. Arthritis Rheum 2003,
48:982-992.
25. Stohl W, Xu D, Kim KS, Koss MN, Jorgensen TN, Deocharan B,
Metzger TE, Bixler SA, Hong YS, Ambrose CM, et al.: BAFF over-
expression and accelerated glomerular disease in mice with
an incomplete genetic predisposition to systemic lupus
erythematosus. Arthritis Rheum 2005, 52:2080-2091.
26. Davis JC Jr, Gross J, Gescuk B, Harder B, Wofsy D: zTNF4 and
soluble TACI receptor levels in serum and urine may reflect
disease activity in patients with SLE. Arthritis Rheum 2001,
44:S99.
27. Carter RH, Zhao H, Liu X, Pelletier M, Chatham W, Kimberly R,
Zhou T: Expression and occupancy of BAFF-R on B cells in sys-
temic lupus erythematosus. Arthritis Rheum 2005 in press.
28. Cambridge G, Stohl W, Migone T-S, Hilbert DM, Leandro MJ,
Edwards JCW: Circulating levels of B lymphocyte stimulator
(BLyS) in patients with rheumatoid arthritis following rituxi-
mab treatment: relationships with B cell depletion, circulating
antibodies, and clinical relapse. Arthritis Rheum 2006 in press.
29. Cambridge G, Leandro MJ, Stohl W, Migone TS, Hilbert DM, Isen-
berg DA, Teodorescu M, Ehrenstein MR, Edwards JC: Serological
changes following B cell depletion therapy in systemic lupus
erythematosus: relationship with BLyS. Arthritis Rheum 2004,
50:S645-S646.
30. Budman DR, Merchant EB, Steinberg AD, Doft B, Gershwin ME,
Lizzio E, Reeves JP: Increased spontaneous activity of anti-
body-forming cells in the peripheral blood of pateints with
active SLE. Arthritis Rheum 1977, 20:829-833.
31. Ginsburg WW, Finkelman FD, Lipsky PE: Circulating and pokew-
eed mitogen-induced immunoglobulin-secreting cells in sys-
temic lupus erythematosus. Clin Exp Immunol 1979, 35:76-88.
32. Klinman DM, Shirai A, Ishigatsubo Y, Conover J, Steinberg AD:
Quantitation of IgM- and IgG-secreting B cells in the periph-
eral blood of patients with systemic lupus erythematosus.
Arthritis Rheum 1991, 34:1404-1410.
33. Odendahl M, Jacobi A, Hansen A, Feist E, Hiepe F, Burmester GR,
Lipsky PE, Radbruch A, Dörner T: Disturbed peripheral B lym-
phocyte homeostasis in systemic lupus erythematosus. J
Immunol 2000, 165:5970-5979.
34. Jacobi AM, Odendahl M, Reiter K, Bruns A, Burmester GR, Rad-
bruch A, Valet G, Lipsky PE, Dörner T: Correlation between cir-
culating CD27
high
plasma cells and disease activity in patients
with systemic lupus erythematosus. Arthritis Rheum 2003,
48:1332-1342.
35. Litinskiy MB, Nardelli B, Hilbert DM, He B, Schaffer A, Casali P,
Cerutti A: DCs induce CD40-independent immunoglobulin
class switching through BLyS and APRIL. Nat Immunol 2002,
3:822-829.
36. Balázs M, Martin F, Zhou T, Kearney J: Blood dendritic cells inter-
act with splenic marginal zone B cells to initiate T-independent
immune responses. Immunity 2002, 17:341-352.
37. Lesley R, Xu Y, Kalled SL, Hess DM, Schwab SR, Shu HB, Cyster
JG: Reduced competitiveness of autoantigen-engaged B cells
due to increased dependence on BAFF. Immunity 2004,
20:441-453.
38. Thien M, Phan TG, Gardam S, Amesbury M, Basten A, Mackay F,
Brink R: Excess BAFF rescues self-reactive B cells from
peripheral deletion and allows them to enter forbidden follicu-
lar and marginal zone niches. Immunity 2004, 20:785-798.
39. Leandro MJ, Edwards JC, Cambridge G, Ehrenstein MR, Isenberg
DA: An open study of B lymphocyte depletion in systemic
lupus erythematosus. Arthritis Rheum 2002, 46:2673-2677.
40. Gross JA, Dillon SR, Mudri S, Johnston J, Littau A, Roque R, Rixon
M, Schou O, Foley KP, Haugen H, et al.: TACI-Ig neutralizes mol-
ecules critical for B cell development and autoimmune dis-
ease: impaired B cell maturation in mice lacking BLyS.
Immunity 2001, 15:289-302.
41. Schiemann B, Gommerman JL, Vora K, Cachero TG, Shulga-Mor-
skaya S, Dobles M, Frew E, Scott ML: An essential role for BAFF
in the normal development of B cells through a BCMA-inde-
pendent pathway. Science 2001, 293:2111-2114.
42. Gorelik L, Cutler AH, Thill G, Miklasz SD, Shea DE, Ambrose C,
Bixler SA, Su L, Scott ML, Kalled SL: Cutting edge: BAFF regu-
lates CD21/35 and CD23 expression independent of its B cell
survival function. J Immunol 2004, 172:762-766.