Báo cáo y học: "Correlation of histopathological findings and magnetic resonance imaging in the spine of patients with ankylosing spondylitis" potx
Bạn đang xem bản rút gọn của tài liệu. Xem và tải ngay bản đầy đủ của tài liệu tại đây (3.96 MB, 7 trang )
Open Access
Available online />Page 1 of 7
(page number not for citation purposes)
Vol 8 No 5
Research article
Correlation of histopathological findings and magnetic resonance
imaging in the spine of patients with ankylosing spondylitis
Heiner Appel
1
†, Christoph Loddenkemper
2
†, Zarko Grozdanovic
3
, Harald Ebhardt
2
,
Marc Dreimann
4
, Axel Hempfing
4
, Harald Stein
2
, Peter Metz-Stavenhagen
4
, Martin Rudwaleit
1
and
Joachim Sieper
1
1
Charité Berlin, Campus Benjamin Franklin, Department of Gastroenterology, Infectiology and Rheumatology, Hindenburgdamm 30, 12200 Berlin,
Germany
2
Charité Berlin, Campus Benjamin Franklin, Department of Pathology, Hindenburgdamm 30, 12200 Berlin, Germany
3
Charite Berlin, Campus Benjamin Franklin, Department of Radiology, Hindenburgdamm 30, 12200 Berlin, Germany
4
Werner-Wicker-Klinik, Department II, Center for Spine Surgery, Im Kreuzfeld 4, 34537 Bad Wildungen, Germany
Corresponding author: Joachim Sieper,
†Equal contributors
Received: 7 Jun 2006 Revisions requested: 17 Jul 2006 Revisions received: 19 Jul 2006 Accepted: 22 Aug 2006 Published: 22 Aug 2006
Arthritis Research & Therapy 2006, 8:R143 (doi:10.1186/ar2035)
This article is online at: />© 2006 Appel et al.; licensee BioMed Central Ltd.
This is an open access article distributed under the terms of the Creative Commons Attribution License ( />),
which permits unrestricted use, distribution, and reproduction in any medium, provided the original work is properly cited.
Abstract
Ankylosing spondylitis (AS) is a chronic inflammatory disease
which affects primarily the sacroiliac joints and the spine. In
patients with active disease, magnetic resonance imaging (MRI)
of the spine shows areas of bone marrow edema, the
histopathological equivalent of which is unknown. In this study
we correlate inflammation in the spine of patients with AS as
revealed by histological examination with bone marrow edema
as detected by MRI. We have compared the histopathological
findings of zygapophyseal joints from 8 patients with AS (age:
30 to 64, disease duration 7 to 33 years) undergoing spinal
surgery with findings in MRI. For histopathological analysis, we
quantified infiltrates of CD3+, CD4+ and CD8+ T cells as well
as CD20+ B cells immunohistochemically. Bone marrow edema
was evaluated in hematoxylin and eosin stained sections and
quantified as the percentage of the bone marrow area involved.
All patients with AS showed interstitial mononuclear cell
infiltrates and various degrees of bone marrow edema (range
from 10% to 60%) in histopathological analysis. However, in
only three of eight patients histopathological inflammation and
edema in the zygapophyseal joints correlated with bone marrow
edema in zygapophyseal joints of the lumbar spine as detected
by MRI. Interestingly, two of these patients showed the highest
histological score for bone marrow edema (60%). This first
study correlating histopathological changes in the spine of
patients with AS with findings in MRI scans suggests that a
substantial degree of bone marrow inflammation and edema is
necessary to be detected by MRI.
Introduction
The prevalence of ankylosing spondylitis (AS) within Cauca-
sians has been estimated to be between 0.2% and 0.8% [1,2].
About 20% of these patients with AS have bridging syn-
desmophytes which result in restricted movement of the spine
as a consequence of active inflammation in spinal joints and
adjacent structures [3]. It has been suggested that the involve-
ment of zygapophyseal joints is important in the restriction of
spinal mobility [3-5]. This is supported by computed tomogra-
phy observations, which displayed a significant correlation
between changes in the zygapophyseal joints and restriction
of spinal mobility [6,7].
Acute inflammation in the spine associated with AS, as
detected by magnetic resonance imaging (MRI), has been
described in the intervertebral disc, in the vertebra, enthesis of
AS = ankylosing spondylitis; HPF = high-power field; MR = magnetic resonance; MRI = magnetic resonance imaging; TIRM = turbo inversion recovery
magnitude.
Arthritis Research & Therapy Vol 8 No 5 Appel et al.
Page 2 of 7
(page number not for citation purposes)
interspinal ligaments, costovertebral joints and zygapophyseal
joints [8]. However, systematic MRI of zygapophyseal joints
has not been undertaken so far.
As a consequence, a correlation of histopathological analysis
of the spine and inflammation as visualized by MRI has also not
previously been done. In the sacroiliac joints of patients with
AS, a correlation of MRI findings and histopathological evalu-
ations from needle biopsies out of the same sacroiliac joints
was reported, but without description and quantification of his-
tological edema [9].
We have recently reported the first systematic histological
study of zygapophyseal joints in patients with AS [10]. In the
present study, we first examined whether inflammation in the
spine of patients with AS, as detected by histopathology, can
be correlated with bone marrow edema detected by MRI and
consequently whether a negative MRI excludes active inflam-
mation of the spine in patients with AS.
Materials and methods
Patients
Zygapophyseal joints were obtained from eight patients with
AS (mean age 45 (range 30 to 59); five men, three women).
This study includes patients from a larger group for which his-
topathological observations from the zygapophyseal joints
were reported recently [10]. In brief, all eight patients had
severe kyphosis and were completely ankylosed in the lumbar
spine. The mean disease duration of all eight patients was
22.5 years (range 7 to 33 years). Seven of eight patients
reported symptoms of nocturnal back pain before surgery. His-
tologically detectable edema and cellular infiltrates were also
searched for in control samples taken from autopsies of 10
patients without AS who died from cardiovascular diseases
and had no history of rheumatic diseases.
Surgery was performed as reported in more detail previously
[10]: we obtained at least one zygapophyseal joint (Figure 1a)
from the lumbar spine of each patient with AS. For all eight
patients with AS, preoperative MR images of the lumbar spine
and the thoracic spine were available for comparative analysis.
Permission for this study was given by the local ethic commit-
tee of the Charité Berlin, Campus Benjamin Franklin. All
patients gave permission for histopathological analysis of the
obtained material.
Histological assessment
The histopathological assessment was performed as
described recently [11]. In brief, the zygapophyseal joints were
cut into thin slices (3 to 4 mm) with a saw and fixed in 4% buff-
ered formalin. After decalcification with EDTA, sections 4 to 6
µm thick were prepared and stained with hematoxylin and
eosin for the evaluation of bone marrow edema. Bone marrow
edema was characterized by the accumulation of eosinophilic
fluid in the bone marrow interstitium in between univacuolar fat
cells, resembling the morphological findings described in the
bone marrow of patients with severe malnutrition [12], during
the first couple of weeks following stem cell transplantation
[13] or after cytoreductive therapy in chronic idiopathic
myelofibrosis [14] (Figure 1b; red arrows, edema; black arrow,
vacuoles of fat cells). The relative amount of edema, calculated
as the percentage of the total bone marrow area, was quanti-
fied as described in an earlier study in which bone marrow
edema was assessed for a comparative analysis of magnetic
resonance (MR) images and histopathology in osteoarthritis
[15]. The sections were also examined by polarized light after
staining with Congo red to rule out the presence of amyloid
mimicking extracellular edema.
The evaluation of all sections was performed by an experi-
enced pathologist (CL) who was blinded for patients, controls,
and the MRI results. Sections were examined with a micro-
scope allowing light and immune fluorescence microscopy
(BX60; Olympus, Hamburg, Germany). Pictures were taken
with a digital camera (Color View II; Soft Imaging System
GmbH, Münster, Germany) and were further analyzed by
Analysis
®
software (Soft Imaging System).
Immunohistochemistry
Immunohistochemistry was performed, as described in more
detail recently [11], to detect CD3
+
T cells, CD4
+
T cells,
CD8
+
T cells and CD20
+
B cells. In brief, sections were
immersed in a sodium citrate buffer solution at pH 6.0 and
heated in a high-pressure cooker (CD3, CD4, CD8 and
CD20). After cooking, the slides were incubated with the
respective primary antibodies including monoclonal antibodies
against CD4 (clone 1F6; Novocastra, Newcastle, UK), CD34
(QBend10; Immunotech, Marseille, France), and CD3
(F7.2.38), CD8 (C8/144B) and CD20 (L26) obtained from
Dako (Glostrup, Denmark). For detection, the alkaline phos-
phatase/anti-alkaline phosphatase complex (APAAP) method
was used, with 'Fast Red' as chromogen.
T-cell and B-cell aggregates were defined as clusters of 50 or
more CD3
+
T cells or CD20
+
B cells, and for each patient the
number of CD3
+
T-cell aggregates or CD20
+
B-cell aggre-
gates in 10 high-power microscopic fields (HPFs), based on a
HPF of 0.237 mm
2
first, ocular with a 22 mm field of view at
×10 magnification, and a 40× objective), was assessed. For
the quantification of interstitial CD4
+
and CD8
+
T cells and
CD20
+
B cells in the bone marrow, 10 HPFs were analyzed
similarly. The number of interstitial CD4
+
and CD8
+
T cells was
defined as increased if at least ten CD4
+
T cells and at least
six CD8
+
T cells per HPF were present; for CD20
+
B cells the
criterion was at least five positive cells per HPF on the basis of
the findings in zygapophyseal joints of patients without AS,
which we used as negative controls.
Available online />Page 3 of 7
(page number not for citation purposes)
The results are given semi-quantitatively: +++, at least two
CD3
+
lymphocytic aggregates and increased interstitial
CD4
+
, CD8
+
and CD20
+
lymphocytic infiltrates; ++, one
CD3
+
lymphocytic aggregate and increased interstitial CD4
+
,
CD8
+
and CD20
+
lymphocytic infiltrates; +, increased intersti-
tial CD4
+
, CD8
+
and CD20
+
lymphocytic infiltrates, no aggre-
gates. For the quantification of CD34
+
micro-vessel density a
semi-quantitative analysis was performed: 0, not more than
two micro-vessels per HPF; +, three or four micro-vessels per
HPF; ++, five or six micro-vessels per HPF.
Magnetic resonance imaging
MRI, including T1-weighted, T2-weighted and TIRM (turbo
inversion recovery magnitude) sequences, was performed as
a preoperative procedure in patients with AS, as shown in
Table 1. TIRM sequences allow excellent illustration of the
anatomy and detection of inflammation in the bone marrow.
The entire lumbar spine including the zygapophyseal joints
and, if available, the thoracic spine was analyzed for increased
signals in T2-weighted sequences.
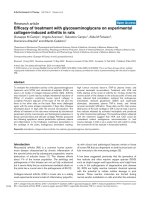
Figure 1
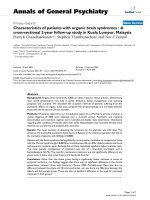
Macroscopic and microscopic assessment of zygapophyseal jointsMacroscopic and microscopic assessment of zygapophyseal joints. (a) Macroscopic picture of a zygapophyseal joint from a patient with ankylosing
spondylitis (AS). (b) Hematoxylin and eosin staining of a zygapophyseal joint from an AS patient: weakly eosinophilic fluid accumulation in the bone
marrow interstitium (red arrows) neighboring dense interstitial infiltrates of mononuclear cells (yellow arrows). The black arrow indicates fat vacuoles.
(c) Immunohistochemical analysis of CD3
+
T cells in the zygapophyseal joint of an AS patient: dense formations of CD3
+
T cells (red stain, yellow
arrow) neighboring bone marrow edema (red arrow). (d) Immunohistochemical analysis of CD3
+
T cells in a zygapophyseal joint of a non-AS control
with only few loosely distributed CD3
+
T cells in the bone marrow without edema.
Table 1
Correlation of histopathological findings and magnetic resonance imaging
Patient no. HLA-B27 Edema (%) Cellular infiltration Microvessel
density
Edema detected by magnetic resonance imaging
Zygapophyseal joints of lumbar
spine
Other segments of lumbar or
thoracic spine
1 - 60 +++ ++ L1, L2 Th12
2 + 60 +++ + L2, L3 -
3 - 30 +++ + L2, L3, L4 Th5–Th7 and zygapophyseal
joints Th5–Th7
4 + 20 +++ + - Thoracic spine Th11, Th12
5+10+ + - -
Arthritis Research & Therapy Vol 8 No 5 Appel et al.
Page 4 of 7
(page number not for citation purposes)
Results
Mononuclear cell infiltration
We summarize the results of a semi-quantitative analysis of
mononuclear cell infiltration in the bone marrow of zygapophy-
seal joints as described in the Method section. Five patients
with AS had the highest score of cellular infiltration (+++) with
at least two CD3
+
lymphocytic aggregates including
increased interstitial CD4
+
, CD8
+
and CD20
+
lymphocytic
infiltrates, and three patients with AS had an increased level of
cellular infiltrations (+) without aggregates (Table 1).
Microvessel density
To address the question of whether hypervascularization
might contribute to the detection of bone marrow edema in the
spine by MRI we also stained CD34
+
endothelial cells in our
sections. This issue was examined more thoroughly in a previ-
ous paper [10]. The present results are shown in Table 1.
Bone marrow edema
All patients with AS showed different degrees of interstitial
bone marrow edema in histopathological analysis: in two
patients with AS, interstitial edema was present in 10% of the
total bone marrow area, in two patients it was present in 20%,
in two patients in 30% and in two patients in 60% (Table 1).
In contrast, none of the controls showed interstitial bone mar-
row edema.
Correlation of histopathology with MRI
Interstitial bone marrow edema as detected by histopathology
in the zygapophyseal joints of the lumbar spine was found by
MRI in three of eight patients with AS (Table 1). Most interest-
ingly, in these patients a good correlation between histopatho-
logically confirmed interstitial edema and cellular infiltration
was found. Two patients showed the highest score for intersti-
tial bone marrow edema (60%) and for mononuclear cell infil-
trates (+++). An example of such an AS patient is shown in
Figure 2: bone marrow edema as detected by MRI (Figure 2a)
was correlated with interstitial bone marrow edema as
detected by hematoxylin and eosin staining (Figure 2b) and T-
cell infiltration (Figure 2c). The third patient with AS (no. 3)
with bone marrow edema detected by MRI had 30% interstitial
bone marrow edema and the highest score of bone marrow
infiltation in the histopathological assessment. Some of the
patients had inflammatory lesions in other parts of the spine,
as indicated in Table 1.
Interestingly, histopathologically detected cellular infiltration
and interstitial bone marrow edema was also observed,
although to a smaller degree (between 10% and 30%), in
patients with negative MRI. An example is shown in Figure 3:
interstitial bone marrow edema (20%) (Figure 3b) and cellular
infiltration (Figure 3c) was detectable in histopathological
observations but not by MRI (Figure 3a). In two of the patients
in whom zygapophyseal joints were MRI-negative, signs of
osteitis were seen at other sites of the spine: in the vertebral
bodies of thoracic vertebrae 11 and 12 of patient 4 and at pos-
terior sites of the vertebral bodies of thoracic vertebrae 6 to 9
including the zygapophyseal joints of patient 6 (Table 1).
Discussion
Interstitial bone marrow edema in zygapophyseal joints of the
lumbar spine as detected by histological examination was
present in all eight patients with AS to a different degree, var-
ying from 10% to 60% of the total bone marrow area. There
was a clear correlation between histopathologically confirmed
interstitial edema and edema as shown by MRI. However, a
small amount of histopathological interstitial edema in the
bone marrow (less than 30% of the surface area) is not
detected by MRI. There was only a poor correlation between
histopathologically observed interstitial edema and inflamma-
tory cell infiltration, and therefore only a poor correlation
between cell infiltration and MRI edema, which might explain
why some patients with AS can have active disease despite a
normal MRI [16]. An earlier study comparing AS histology from
computed-tomography-guided biopsies from the sacroiliac
joint with MRI observed some correlation between cell infiltra-
tion and bone marrow edema by MRI but did not investigate
and compare histopathological and MRI bone marrow edema
[9].
We are aware that this analysis has its limitations: the number
of patients in this study is small, all patients had advanced dis-
ease progression, the slices of MR images were 4 mm thick or
were for example available only in sagittal sections (patients 7
and 8) and because of that it might be possible that inflamma-
tion and edema was missed. Furthermore, transverse images
of the zygapophyseal joints might be more sensitive [8]. How-
ever, the protocol used for MR images is a standard protocol
for daily routine and should therefore be used for comparative
analysis.
6 + 20 + + - Th6–Th9 and zygapophyseal
joints Th6–Th9
7 + 30 +++ + - -
8+10+ + - -
L, vertebra of the lumbar spine; Th, vertebra of the thoracic spine.
Table 1 (Continued)
Correlation of histopathological findings and magnetic resonance imaging
Available online />Page 5 of 7
(page number not for citation purposes)
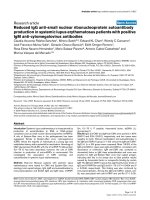
Figure 2
Positive correlation of bone marrow edema in histopathological assessment and magnetic resonance imagingPositive correlation of bone marrow edema in histopathological assessment and magnetic resonance imaging. (a) Magnetic resonance imaging (T2
sequence) of a zygapophyseal joint with bone marrow edema (cyan arrow) (asterisk, vertebral body; open square, epidural space; plus signs, supe-
rior and inferior articular processes of the zygapophyseal joint; hash sign, processus spinosus). (b) Hematoxylin and eosin staining, revealing dense
infiltrations of mononuclear cells (yellow arrow) and interstitial bone marrow edema (red arrow). (c) Immunohistochemical analysis of CD3
+
T cells,
revealing mononuclear cell aggregates in the same zygapophyseal joint (yellow arrow).
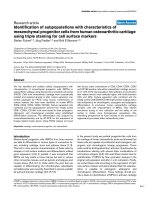
Figure 3
Negative correlation of bone marrow edema in histopathological assessment and magnetic resonance imagingNegative correlation of bone marrow edema in histopathological assessment and magnetic resonance imaging. (a) Magnetic resonance imaging of
zygapophyseal joints (cyan arrows) without detectable bone marrow edema (asterisk, vertebral body; open square, epidural space; plus signs, supe-
rior and inferior articular processes of the zygapophyseal joint; hash sign, processus spinosus). (b) Hematoxylin and eosin staining of the zygapophy-
seal joint, revealing numerous mononuclear cells in the bone marrow (yellow arrow) and a relatively small amount of edema (20%) in the bone
marrow (red arrow). (c) Immunohistochemical analysis of CD3
+
T cells (red arrow), showing dense infiltrates of CD3
+
T cells (yellow arrow).
Arthritis Research & Therapy Vol 8 No 5 Appel et al.
Page 6 of 7
(page number not for citation purposes)
In patients with AS, spinal MRI is being used to assess spinal
inflammation as an indicator of disease activity. Lesions of
active inflammation are depicted as areas of increased signal
intensity in T2-weighted images with fat saturation (STIR
sequences) and most probably represent an increased water
content, probably as a correlate of bone marrow edema [17].
The term 'bone marrow edema' in MR images was first used
by Wilson and colleagues in 1988. Regional decreased signal
intensity of the bone marrow in T1-weighted images and
increased signal intensity on T2-weighted images represented
an accumulation of 'bone marrow water', which could be con-
firmed by biopsy. They defined such lesions as 'bone marrow
edema' [18]. A first systematic analysis of bone marrow edema
in MR images and histopathological analysis was performed in
osteoarthritis [15] in which bone marrow edema could be
observed in MR images in up to 50 to 68% of patients. In this
study the bone marrow edema, defined as a hyperintense zone
on STIR images and hypointense on T1-weighted MR images,
consisted mainly of normal tissue (53% of the area was fatty
marrow, 16% was intact trabeculae, and 2% was blood ves-
sels) and in a smaller proportion of other changes, namely
interstitial bone marrow edema 4% [15]. Taken as a whole, the
study by Zanetti and colleagues [15] revealed non-character-
istic histopathological abnormalities without increased infiltra-
tions of mononuclear cells, increased microvessel density or
interstitial bone marrow edema, clearly indicating that MRI-
detected 'bone marrow edema' in patients with osteoarthritis
can have various underlying histomorphological alterations. In
our study the presence of large numbers of cellular infiltrates
in all patients with a greater percentage of histopathologically
confirmed interstitial edema argues strongly for the hypothesis
that the bone marrow edema in MRI in our cohort of patients
with AS was caused by inflammation.
Conclusion
There is a good correlation between histological and MRI
edema in patients with AS, although MRI seems to be less
sensitive than histopathological analysis. Edema is a product
of inflammatory reaction but our histopathological observa-
tions indicate that inflammation reflected by cellular infiltrates
does not always cause the same degree of edema. This might
be an explanation for the sometimes observed discrepancy
between high disease activity and negative MRI in AS. Further
investigations comparing radiological and histological
changes will be needed to clarify this topic. Therefore, other
structures involved in AS, for example hip joints and knees
obtained from joint replacement, should be analyzed in future.
Competing interests
The authors declare that they have no competing interests.
Authors' contributions
HA, CL and JS were responsible for study design, manuscript
preparation, data acquisition and interpretation, and statistics.
ZG and MR were responsible for acquisition of MRI data and
its interpretation, and for manuscript preparation. HE was
responsible for data acquisition from patients without AS and
for interpretation of data. MD, AH and PM-S were responsible
for data acquisition from patients with AS and for interpreta-
tion of data. HS was responsible for data acquisition and inter-
pretation and for manuscript preparation. All authors read and
approved the final manuscript.
Acknowledgements
This study was supported by a grant from the Deutsche Forschungsge-
meinschaft (DFG) Ap 82/3-1 (to HA and JS) and Project Z1 from the
Sonderforschungsbereich (SFB) 633 (to CL and HS).
References
1. Braun J, Bollow M, Remlinger G, Eggens U, Rudwaleit M, Distler
A, Sieper J: Prevalence of spondylarthropathies in HLA B27-
positive and -negative blood donors. Arthritis Rheum 1998,
41:58-67.
2. van der Linden SM, Khan MA: The risk of ankylosing spondylitis
in HLA-B27 positive individuals: a reappraisal. J Rheumatol
1984, 11:727-728.
3. Jimenez-Balderas FJ, Mintz G: Ankylosing spondylitis: clinical
course in women and men. J Rheumatol 1993, 20:2069-2072.
4. Wilkinson M, Bywaters EG: Clinical features and course of
ankylosing spondylitis; as seen in a follow-up of 222 hospital
referred cases. Ann Rheum Dis 1958, 17:209-228.
5. de Vlam K, Mielants H, Veys EM: Involvement of the zygapophy-
seal joint in ankylosing spondylitis: relation to the bridging
syndesmophyte. J Rheumatol 1999, 26:1738-1745.
6. Simkin PA, Downey DJ, Kilcoyne RF: Apophyseal arthritis limits
lumbar motion in patients with ankylosing spondylitis. Arthritis
Rheum 1988, 31:798-802.
7. Russell AS, Jackson F: Computer assisted tomography of the
apophyseal changes in patients with ankylosing spondylitis. J
Rheumatol 1986, 13:581-585.
8. Hermann KG, Althoff CE, Schneider U, Zuhlsdorf S, Lembcke A,
Hamm B, Bollow M: Spinal changes in patients with spondy-
loarthritis: comparison of MR imaging and radiographic
appearances. Radiographics 2005, 25:559-569.
9. Bollow M, Fischer T, Reisshauer H, Backhaus M, Sieper J, Hamm
B, Braun J: Quantitative analyses of sacroiliac biopsies in
spondyloarthropathies: T cells and macrophages predomi-
nate in early and active sacroiliitis – cellularity correlates with
the degree of enhancement detected by magnetic resonance
imaging. Ann Rheum Dis 2000, 59:135-140.
10. Appel H, Kuhne M, Spiekermann S, Ebhardt H, Groszdanovic Z,
Köhler D, Dreimann M, Hempfing A, Rudwaleit M, Stein H, et al.:
Immunohistological analysis of zygapophyseal joints in
patients with ankylosing spondylitis. Arthritis Rheum 2006,
54:2845-2851.
11. Appel H, Kuhne M, Spiekermann S, Köhler D, Zacher J, Stein H,
Sieper J, Loddenkemper C: Immunohistochemical analysis of
hip arthritis in ankylosing spondylitis – an analysis of the
bone/cartilage interface and subchondral bone marrow.
Arthritis Rheum 2006, 54:1805-1813.
12. Lampert F, Lau B: Bone marrow hypoplasia in anorexia
nervosa. Eur J Pediatr 1976, 124:65-71.
13. van Marion AM, Thiele J, Kvasnicka HM, van den Tweel JG: Mor-
phology of the bone marrow after stem cell transplantation.
Histopathology 2006, 48:329-342.
14. Thiele J, Kvasnicka HM, Schmitt-Graeff A, Diehl V: Bone marrow
histopathology following cytoreductive therapy in chronic idi-
opathic myelofibrosis. Histopathology 2003, 43:470-479.
15. Zanetti M, Bruder E, Romero J, Hodler J: Bone marrow edema
pattern in osteoarthritic knees: correlation between MR imag-
ing and histologic findings. Radiology 2000, 215:835-840.
16. Rudwaleit M, Schwarzlose S, Listing J, Brandt J, Braun J, Sieper J:
Do patients with ankylosing spondylitis (AS) without elevated
CRP and without active inflammation as detected by magnetic
resonance imaging (MRI) respond to TNF alpha blockers?
Ann Rheum Dis 2005:336.
Available online />Page 7 of 7
(page number not for citation purposes)
17. Jevtic V, Kos-Golja M, Rozman B, McCall I: Marginal erosive dis-
covertebral 'Romanus' lesions in ankylosing spondylitis dem-
onstrated by contrast enhanced Gd-DTPA magnetic
resonance imaging. Skeletal Radiol 2000, 29:27-33.
18. Wilson AJ, Murphy WA, Hardy DC, Totty WG: Transient oste-
oporosis: transient bone marrow edema? Radiology 1988,
167:757-760.